

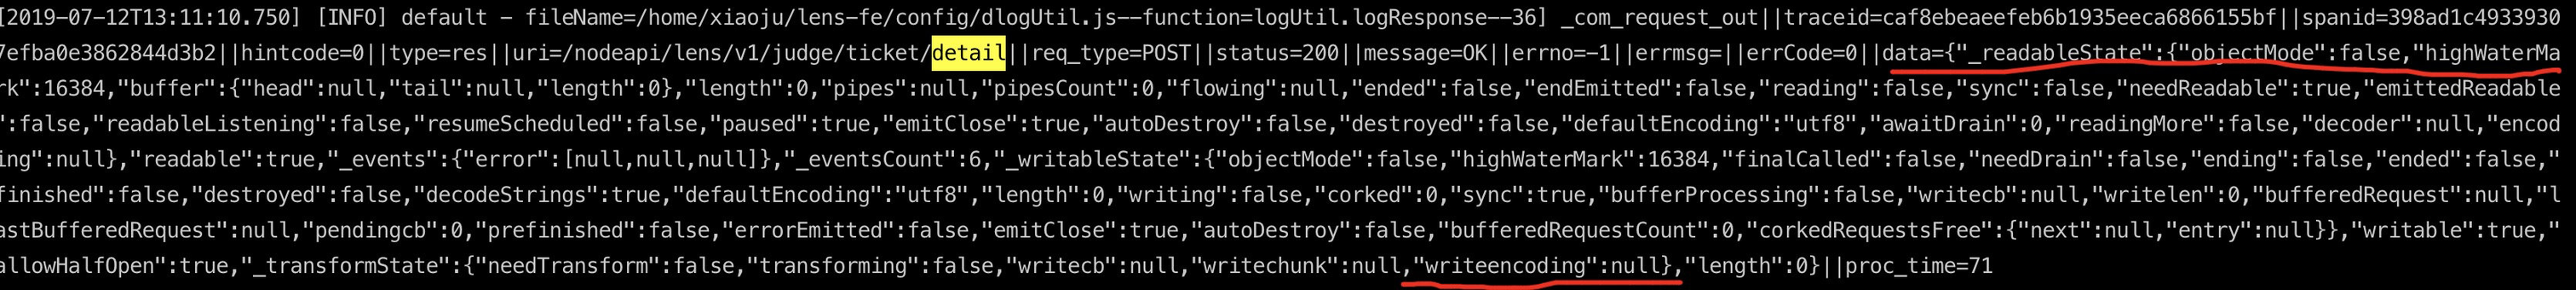
最近遇到一个问题,在项目中的部分日志一直是一些怪异的数据,有些日志的数据又是能正常的打印上去,但是前端接收都是正常的。 服务器异常的日志的图片如下
//封装请求日志
logUtil.logRequest = function (ctx, resTime) {
    if (ctx) {
        const options = formatReqLog(ctx, resTime)
        logMethod.info(options)
    }
}
//封装响应日志
logUtil.logResponse = function (ctx, resTime) {
    if (ctx) {
        const options = formatRes(ctx, resTime)
        logMethod.info(options)
    }
};
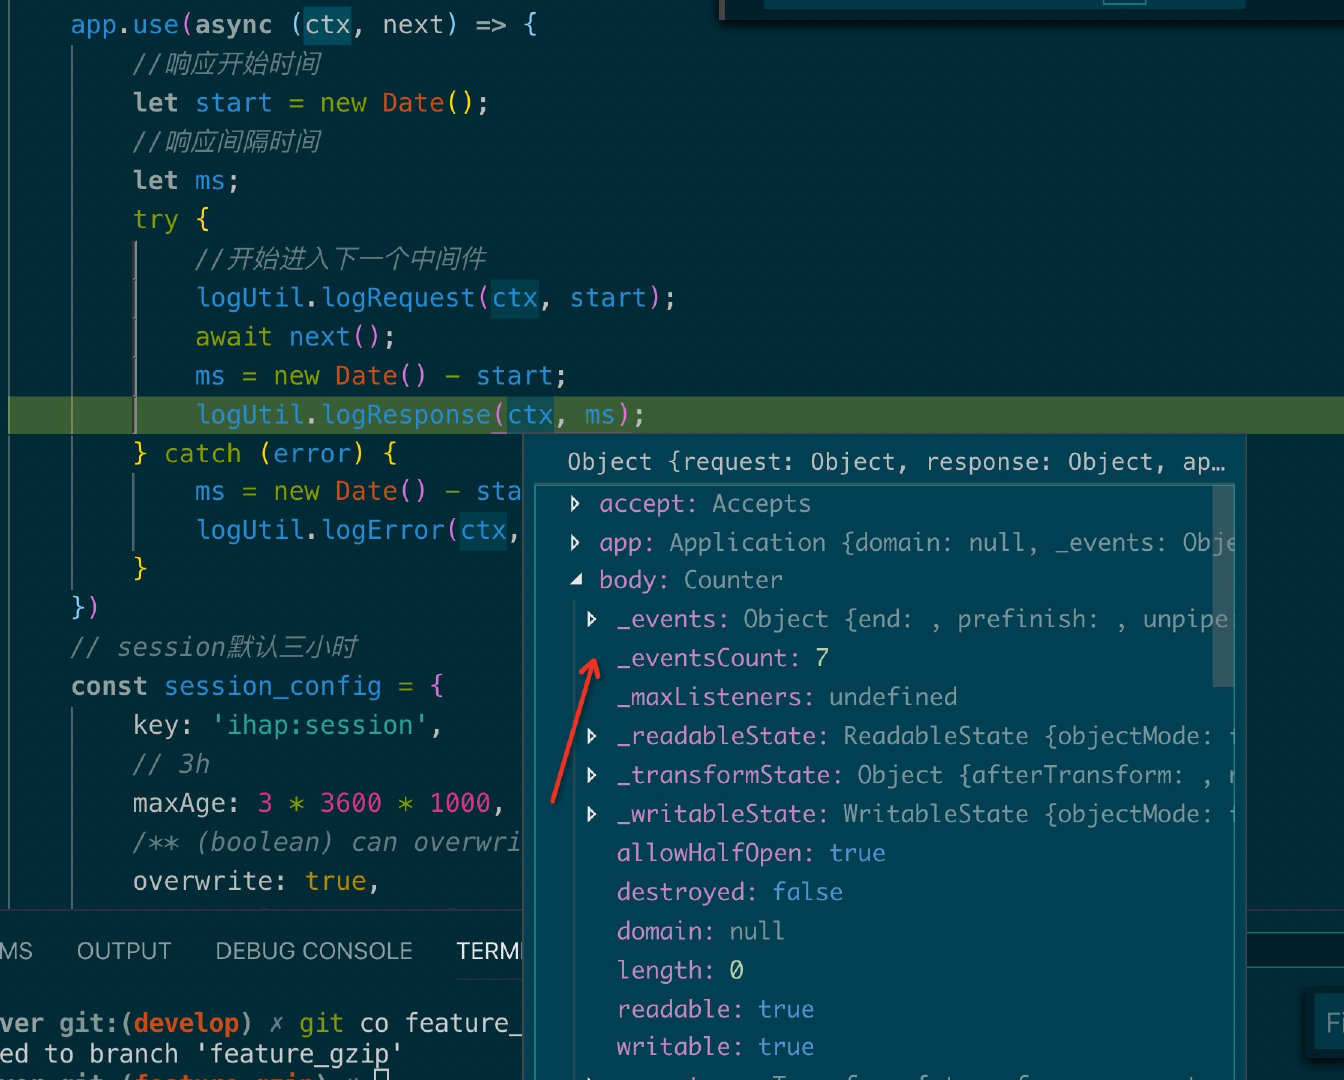
打印日志的代码也没啥问题,那问题到底出在哪里呢?接下来我去看了下我koa中间件的代码(大家可以先熟悉下koa的洋葱模型) 主要流程如下,请求进来打一个请求进来日志->zip压缩中间件->静态资源解析中间件->路由中间件->zip压缩中间件->请求响应打印日志
app.use(async (ctx, next) => {
        //响应开始时间
        let start = new Date();
        //响应间隔时间
        let ms;
        try {
            //开始进入下一个中间件
            logUtil.logRequest(ctx, start);
            await next();
            ms = new Date() - start;
            logUtil.logResponse(ctx, ms);
        } catch (error) {
            ms = new Date() - start;
            logUtil.logError(ctx, error, ms);
        }
    })
    //开启gzip压缩响应文件大小
    app.use(
        compress({
            threshold: 2 * 1024,
            flush: require('zlib').Z_SYNC_FLUSH,
        })
    );
    // koa的静态文件服务
    app.use(staticServ(path.join(__dirname, '../../dist/'), {
        maxAge: 7 * 24 * 60 * 60
    }));
     app.use(router.middleware());
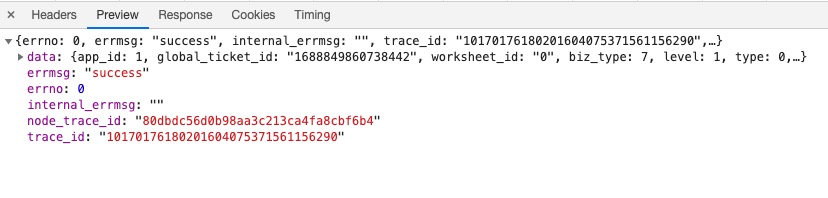
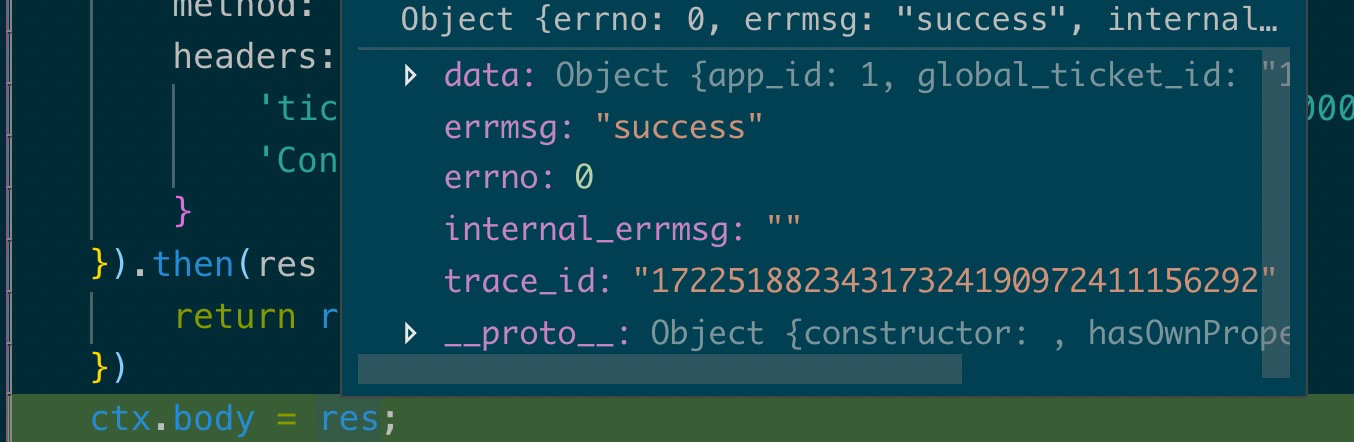
最开始怀疑是router出现了问题,然后在router返回的接口debug
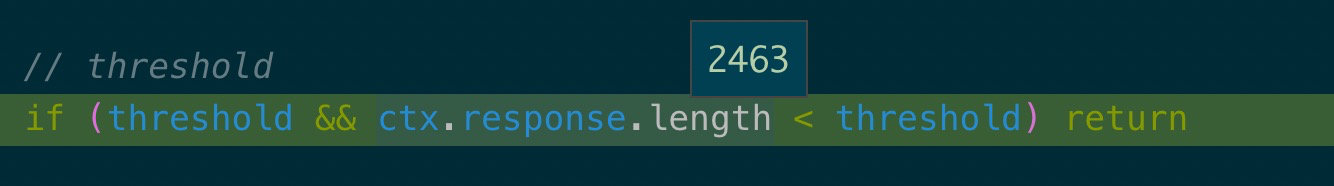
if (threshold && ctx.response.length < threshold) return
// //开启gzip压缩响应文件大小
app.use(
compress({
threshold: 2 * 1024,
flush: require('zlib').Z_SYNC_FLUSH,
})
);
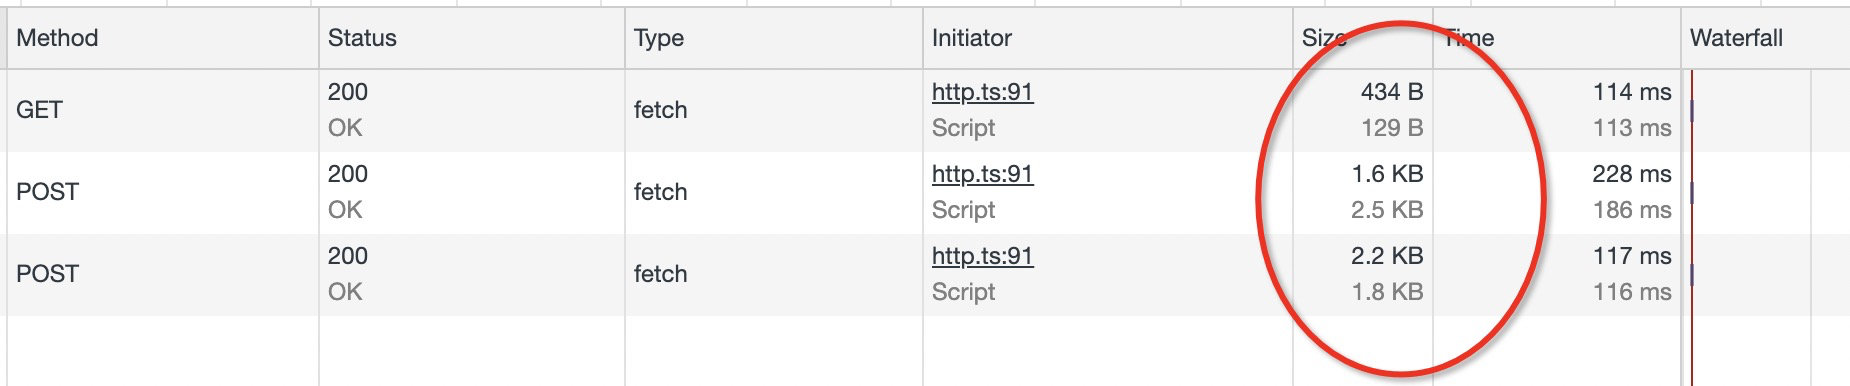
// 看看我们的threshold传入的是2*1024,也就是响应body的大小小于2kb,不进行gzip
// 接下来我看看我的这个detail接口有多大,我靠2.4kb.....
var encodingMethods = {
gzip: zlib.createGzip,
deflate: zlib.createDeflate
}
//调取zlib.createGzip方法
var stream = ctx.body = encodingMethods[encoding](options)
// zlib.createGzip([options])#
// 创建并返回一个带有给定 options 的新的 [Gzip][] 对象。
// gzip对象是一个可读可写的流,返回给浏览器去解析
如下图所示
2中方案
1.threshold: 10 的下限改为10kb
 app.use(
        compress({
            threshold: 10 * 1024,
            flush: require('zlib').Z_SYNC_FLUSH,
        })
    );

 2.不修改threshold,过滤掉json数据,也就是接口返回的json数据不压缩
  app.use(
        compress({
            threshold: 2 * 1024,
            filter: function (content_type) {
                return !/application\/json/i.test(content_type)
            },
            flush: require('zlib').Z_SYNC_FLUSH,
        })
    );
