

echarts教程
模块⼆:、大数据可视化技术:Echarts图表详解
-
Echarts图表标准配置图示技巧
-
在webpack中使用echarts
-
下载:npm install echarts --save
-
使用
var echarts = require('echarts'); // 基于准备好的dom,初始化echarts实例 var myChart = echarts.init(document.getElementById('main')); // 绘制图表 myChart.setOption({ title: { text: 'ECharts 入门示例' }, tooltip: {}, xAxis: { data: ['衬衫', '羊毛衫', '雪纺衫', '裤子', '高跟鞋', '袜子'] }, yAxis: {}, series: [{ name: '销量', type: 'bar', data: [5, 20, 36, 10, 10, 20] }] }); -
vue使用
//全局引入
import echarts from 'echarts'
Vue.prototype.$echarts = echarts;
//所在组件设置变量获取
var echarts = require('echarts')
//设置方法在mounted调用methods方法(添加echarts的代码)
//设置div,id名称要与init中的document.getElementbyid('')一致。
var myChart = echarts.init(document.getElementById('lxy_id'));
      myChart.setOption({
          title: {
              text: 'ECharts 入门示例'
          },
          tooltip: {},
          xAxis: {
              data: ['衬衫', '羊毛衫', '雪纺衫', '裤子', '高跟鞋', '袜子']
          },
          yAxis: {},
          series: [{
              name: '销量',
              type: 'bar',
              data: [5, 20, 36, 10, 10, 20]
          }]
      });
-
-
-
饼图(pie)详解标准饼图
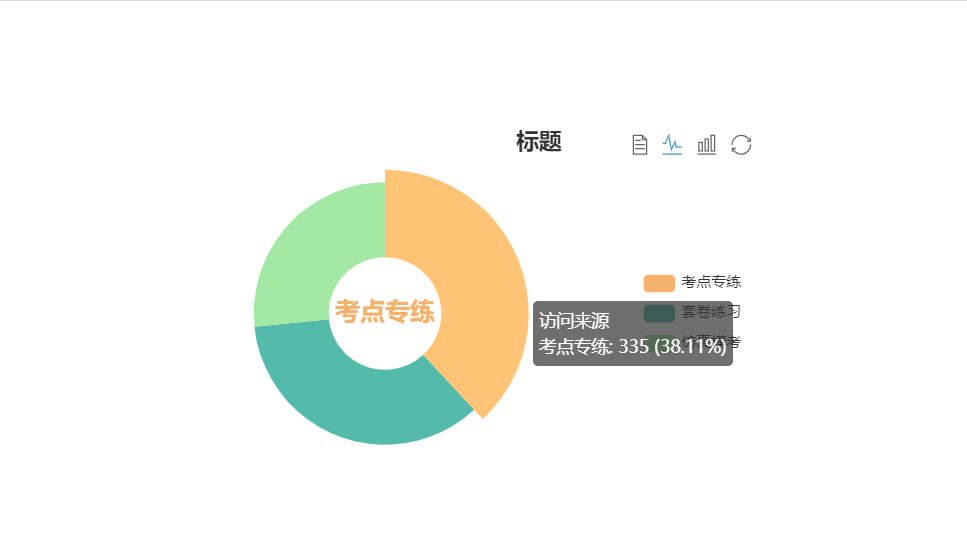
myChart.setOption({ tooltip: { trigger: 'item', //气泡提示配置 formatter: '{a} <br/>{b}: {c} ({d}%)', }, legend: { //图例配置 orient: 'vertical', left: 10, //legend各个item的间隔 padding:5 //图例内边距 data: this.a }, toolbox:{ //工具箱,可以对数据进行批量修改 show:true, feature:{ mark:{ //相关标记 show:true }, dataView:{ //修改标记 show:true, readOnly:false //判断数据是否可以刷新,true则不能修改 }, magicType:{ //是否进行类型切换 show:true, type:["line","bar"] }, restore:{ //是否进行刷新 show:true }, savaAsImage:{ //是否保存图片 show:true }, } }, series: [ { name: '访问来源',//系列名称 type: 'pie', //图表类型,折线图line,柱状图bar。。。 radius: ['50%', '70%'], avoidLabelOverlap: false, label: { show: false, position: 'center' }, emphasis: { label: { show: true, fontSize: '30', fontWeight: 'bold' } }, labelLine: { show: false }, data: [ {value: 335, name: '直接访问'}, {value: 310, name: '邮件营销'}, {value: 234, name: '联盟广告'}, {value: 135, name: '视频广告'}, {value: 1548, name: '搜索引擎'} ] } ] }); -
辅助线的作用及Echart3.x与2.x中的区别
-
添加辅助线
//直接在series中添加如下:
markLine:{
  /*以下设置一行后,平均线就没有开始和结束标记了(即看不见箭头了)*/
  symbol:"none",
  data: [
    {
    	name: '平均线',
      // 支持 'average', 'min', 'max'
      type: 'average',
      lineStyle:{
      normal:{
      color:"green",
      width:2,
      type:"solid",
    }
  }
},]
-
-
拖动自动计算(calculable)功能实现及Echart3.x与2.x中的区别
-
Echarts 如何实现拖拽
myChart.setOption({
    // 声明一个 graphic component,里面有若干个 type 为 'circle' 的 graphic elements。
    // 这里使用了 echarts.util.map 这个帮助方法,其行为和 Array.prototype.map 一样,但是兼容 es5 以下的环境。
    // 用 map 方法遍历 data 的每项,为每项生成一个圆点。
    graphic: echarts.util.map(data, function (dataItem, dataIndex) {
        return {
            // 'circle' 表示这个 graphic element 的类型是圆点。
            type: 'circle',
            shape: {
                // 圆点的半径。
                r: symbolSize / 2
            },
            // 用 transform 的方式对圆点进行定位。position: [x, y] 表示将圆点平移到 [x, y] 位置。
            // 这里使用了 convertToPixel 这个 API 来得到每个圆点的位置,下面介绍。
            position: myChart.convertToPixel('grid', dataItem),

            // 这个属性让圆点不可见(但是不影响他响应鼠标事件)。
            invisible: true,
            // 这个属性让圆点可以被拖拽。
            draggable: true,
            // 把 z 值设得比较大,表示这个圆点在最上方,能覆盖住已有的折线图的圆点。
            z: 100,
            // 此圆点的拖拽的响应事件,在拖拽过程中会不断被触发。下面介绍详情。
            // 这里使用了 echarts.util.curry 这个帮助方法,意思是生成一个与 onPointDragging
            // 功能一样的新的函数,只不过第一个参数永远为此时传入的 dataIndex 的值。
            ondrag: echarts.util.curry(onPointDragging, dataIndex)
        };
    })
});
-
-
饼图(pie)高级 环形图
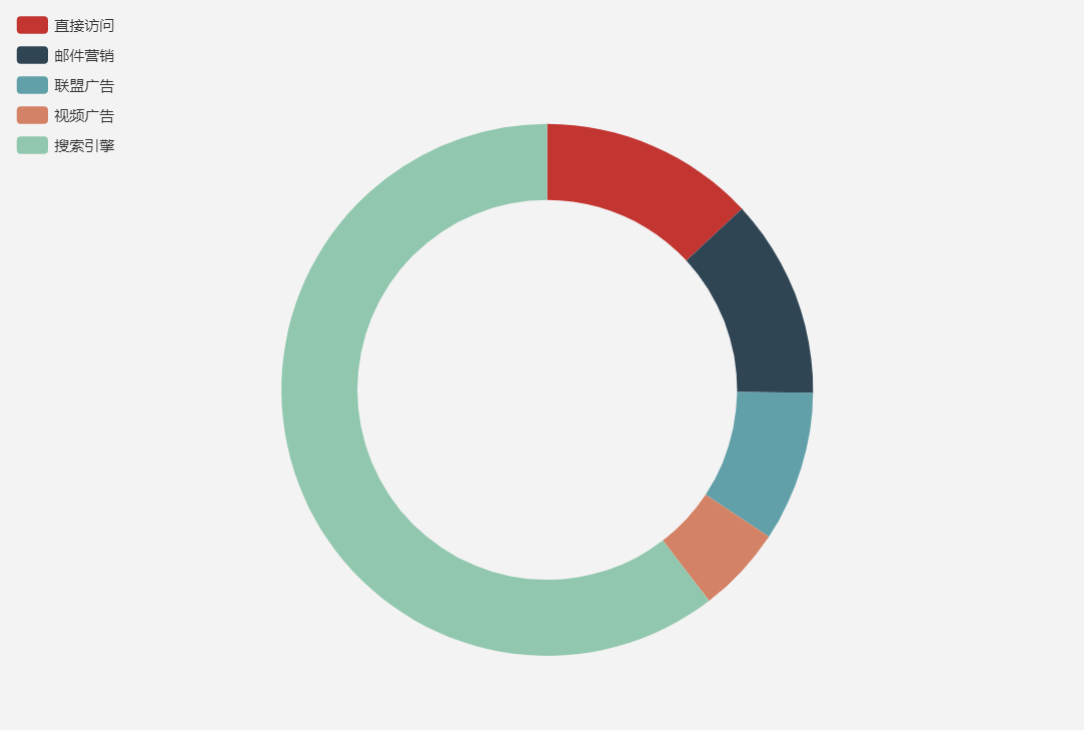
option = { tooltip: { trigger: 'item', formatter: '{a} <br/>{b}: {c} ({d}%)' }, legend: { orient: 'vertical', left: 10, data: ['直接访问', '邮件营销', '联盟广告', '视频广告', '搜索引擎'] }, series: [ { name: '访问来源', type: 'pie', radius: ['50%', '70%'], avoidLabelOverlap: false, label: { show: false, position: 'center' }, emphasis: { label: { show: true, fontSize: '30', fontWeight: 'bold' } }, labelLine: { show: false }, data: [ {value: 335, name: '直接访问'}, {value: 310, name: '邮件营销'}, {value: 234, name: '联盟广告'}, {value: 135, name: '视频广告'}, {value: 1548, name: '搜索引擎'} ] } ] }; -
饼图(pie)高级嵌套环形图
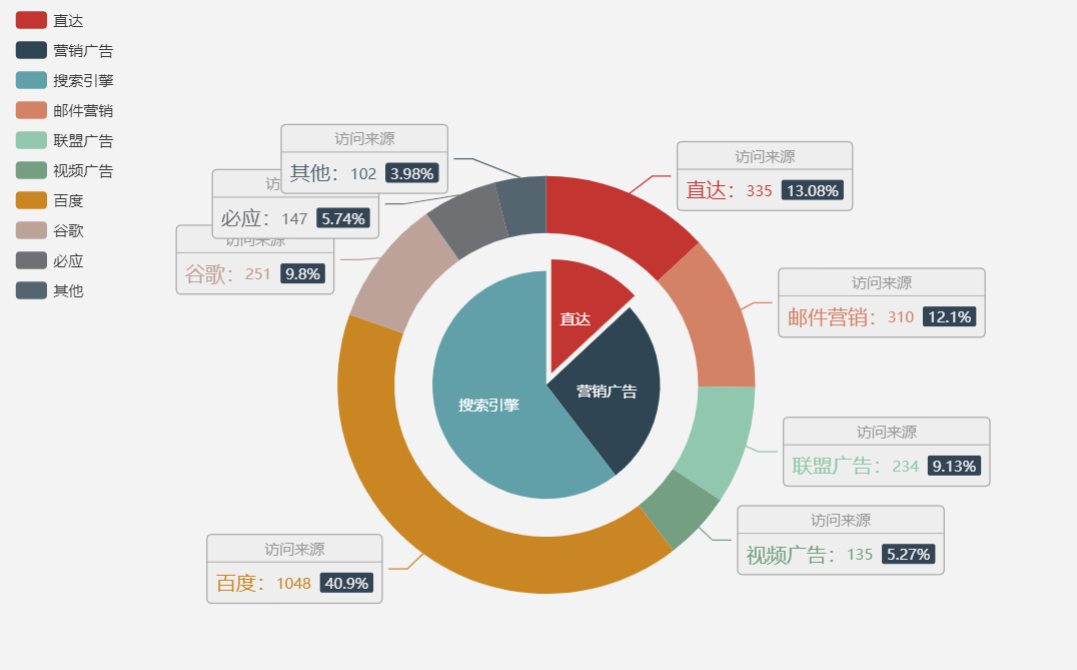
option = { tooltip: { trigger: 'item', formatter: '{a} <br/>{b}: {c} ({d}%)' }, legend: { orient: 'vertical', left: 10, data: ['直达', '营销广告', '搜索引擎', '邮件营销', '联盟广告', '视频广告', '百度', '谷歌', '必应', '其他'] }, series: [ { name: '访问来源', type: 'pie', selectedMode: 'single', radius: [0, '30%'], label: { position: 'inner' }, labelLine: { show: false }, data: [ {value: 335, name: '直达', selected: true}, {value: 679, name: '营销广告'}, {value: 1548, name: '搜索引擎'} ] }, { name: '访问来源', type: 'pie', radius: ['40%', '55%'], label: { formatter: '{a|{a}}{abg|}\n{hr|}\n {b|{b}:}{c} {per|{d}%} ', backgroundColor: '#eee', borderColor: '#aaa', borderWidth: 1, borderRadius: 4, // shadowBlur:3, // shadowOffsetX: 2, // shadowOffsetY: 2, // shadowColor: '#999', // padding: [0, 7], rich: { a: { color: '#999', lineHeight: 22, align: 'center' }, // abg: { // backgroundColor: '#333', // width: '100%', // align: 'right', // height: 22, // borderRadius: [4, 4, 0, 0] // }, hr: { borderColor: '#aaa', width: '100%', borderWidth: 0.5, height: 0 }, b: { fontSize: 16, lineHeight: 33 }, per: { color: '#eee', backgroundColor: '#334455', padding: [2, 4], borderRadius: 2 } } }, data: [ {value: 335, name: '直达'}, {value: 310, name: '邮件营销'}, {value: 234, name: '联盟广告'}, {value: 135, name: '视频广告'}, {value: 1048, name: '百度'}, {value: 251, name: '谷歌'}, {value: 147, name: '必应'}, {value: 102, name: '其他'} ] } ] }; -
散点图(scatter)高级 提示信息及坐标轴的自定义
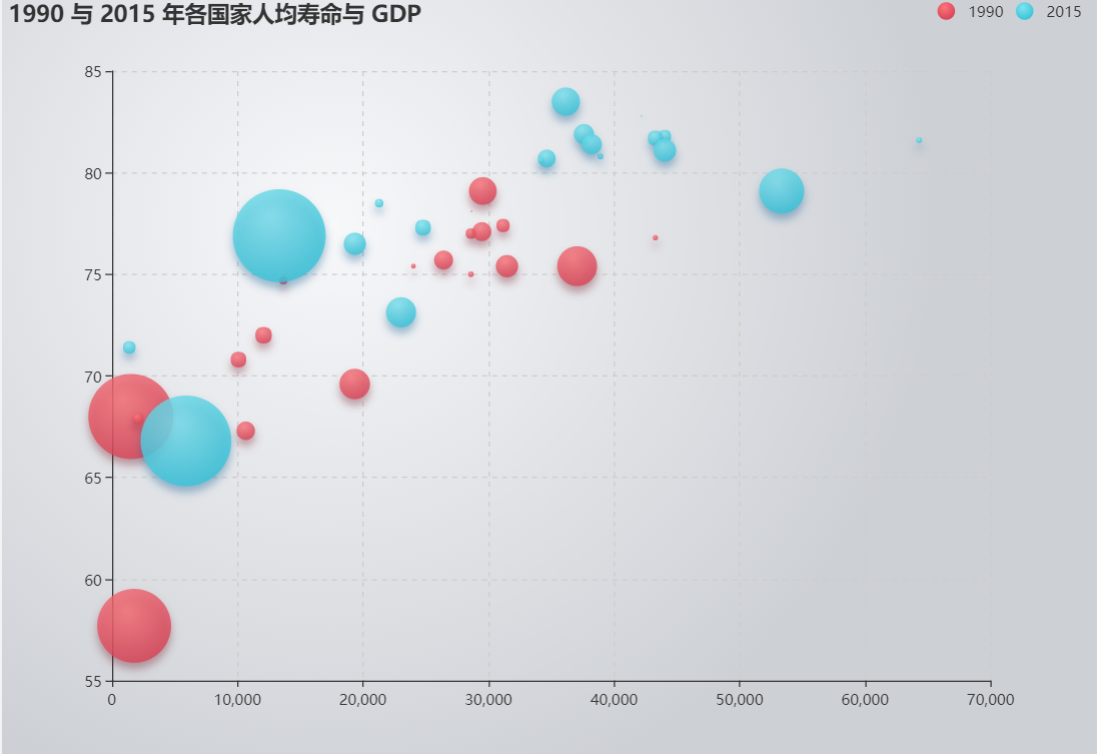
var data = [ [[28604,77,17096869,'Australia',1990],[31163,77.4,27662440,'Canada',1990],[1516,68,1154605773,'China',1990],[13670,74.7,10582082,'Cuba',1990],[28599,75,4986705,'Finland',1990],[29476,77.1,56943299,'France',1990],[31476,75.4,78958237,'Germany',1990],[28666,78.1,254830,'Iceland',1990],[1777,57.7,870601776,'India',1990],[29550,79.1,122249285,'Japan',1990],[2076,67.9,20194354,'North Korea',1990],[12087,72,42972254,'South Korea',1990],[24021,75.4,3397534,'New Zealand',1990],[43296,76.8,4240375,'Norway',1990],[10088,70.8,38195258,'Poland',1990],[19349,69.6,147568552,'Russia',1990],[10670,67.3,53994605,'Turkey',1990],[26424,75.7,57110117,'United Kingdom',1990],[37062,75.4,252847810,'United States',1990]], [[44056,81.8,23968973,'Australia',2015],[43294,81.7,35939927,'Canada',2015],[13334,76.9,1376048943,'China',2015],[21291,78.5,11389562,'Cuba',2015],[38923,80.8,5503457,'Finland',2015],[37599,81.9,64395345,'France',2015],[44053,81.1,80688545,'Germany',2015],[42182,82.8,329425,'Iceland',2015],[5903,66.8,1311050527,'India',2015],[36162,83.5,126573481,'Japan',2015],[1390,71.4,25155317,'North Korea',2015],[34644,80.7,50293439,'South Korea',2015],[34186,80.6,4528526,'New Zealand',2015],[64304,81.6,5210967,'Norway',2015],[24787,77.3,38611794,'Poland',2015],[23038,73.13,143456918,'Russia',2015],[19360,76.5,78665830,'Turkey',2015],[38225,81.4,64715810,'United Kingdom',2015],[53354,79.1,321773631,'United States',2015]] ]; option = { backgroundColor: new echarts.graphic.RadialGradient(0.3, 0.3, 0.8, [{ offset: 0, color: '#f7f8fa' }, { offset: 1, color: '#cdd0d5' }]), title: { text: '1990 与 2015 年各国家人均寿命与 GDP' }, legend: { right: 10, data: ['1990', '2015'] }, xAxis: { splitLine: { lineStyle: { type: 'dashed' } } }, yAxis: { splitLine: { lineStyle: { type: 'dashed' } }, scale: true }, series: [{ name: '1990', data: data[0], type: 'scatter', symbolSize: function (data) { return Math.sqrt(data[2]) / 5e2; }, emphasis: { label: { show: true, formatter: function (param) { return param.data[3]; }, position: 'top' } }, itemStyle: { shadowBlur: 10, shadowColor: 'rgba(120, 36, 50, 0.5)', shadowOffsetY: 5, color: new echarts.graphic.RadialGradient(0.4, 0.3, 1, [{ offset: 0, color: 'rgb(251, 118, 123)' }, { offset: 1, color: 'rgb(204, 46, 72)' }]) } }, { name: '2015', data: data[1], type: 'scatter', symbolSize: function (data) { return Math.sqrt(data[2]) / 5e2; }, emphasis: { label: { show: true, formatter: function (param) { return param.data[3]; }, position: 'top' } }, itemStyle: { shadowBlur: 10, shadowColor: 'rgba(25, 100, 150, 0.5)', shadowOffsetY: 5, color: new echarts.graphic.RadialGradient(0.4, 0.3, 1, [{ offset: 0, color: 'rgb(129, 227, 238)' }, { offset: 1, color: 'rgb(25, 183, 207)' }]) } }] }; -
雷达图(radar)详解
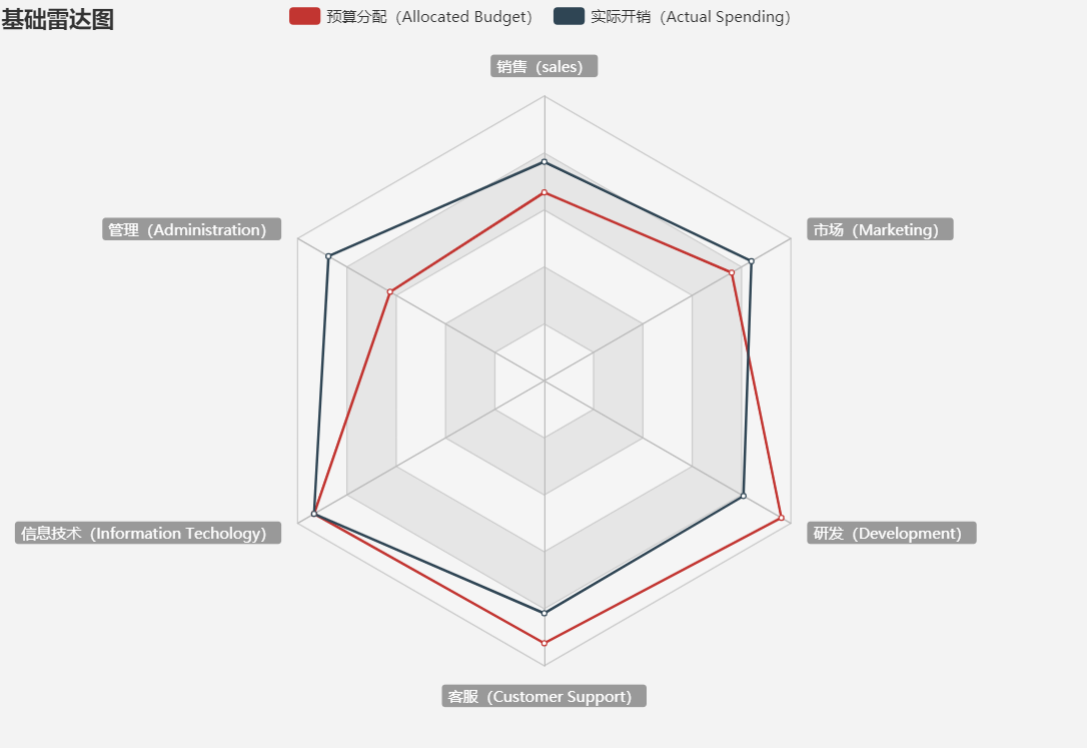
option = {
    title: {
        text: '基础雷达图'
    },
    tooltip: {},
    legend: {
        data: ['预算分配(Allocated Budget)', '实际开销(Actual Spending)']
    },
    radar: {
        // shape: 'circle',
        name: {
            textStyle: {
                color: '#fff',
                backgroundColor: '#999',
                borderRadius: 3,
                padding: [3, 5]
            }
        },
        indicator: [
            { name: '销售(sales)', max: 6500},
            { name: '管理(Administration)', max: 16000},
            { name: '信息技术(Information Techology)', max: 30000},
            { name: '客服(Customer Support)', max: 38000},
            { name: '研发(Development)', max: 52000},
            { name: '市场(Marketing)', max: 25000}
        ]
    },
    series: [{
        name: '预算 vs 开销(Budget vs spending)',
        type: 'radar',
        // areaStyle: {normal: {}},
        data: [
            {
                value: [4300, 10000, 28000, 35000, 50000, 19000],
                name: '预算分配(Allocated Budget)'
            },
            {
                value: [5000, 14000, 28000, 31000, 42000, 21000],
                name: '实际开销(Actual Spending)'
            }
        ]
