坐标轴 Axis
坐标轴通常需要和比例尺一起使用,比例尺相关见【d3.js-02】scale
坐标轴组成:
path元素表示比例尺的输入范围
一组类名为"tick"且被坐标变化的g元素表示比例尺的刻度
每个刻度包含一个line元素表示刻度线和text元素表示刻度标签
例如:刻度朝下的坐标轴组件结构如下
<g fill="none" font-size="10" font-family="sans-serif" text-anchor="middle" >
<path class="domain" stroke="#000" d="M0.5,6V0.5H880.5V6" ></path>
<g class="tick" opacity="1" transform="translate(0.5,0)" >
<line stroke="#000" y2="6" ></line>
<text fill="#000" y="9" dy="0.71em" >0.0</text>
</g>
<g class="tick" opacity="1" transform="translate(176.5,0)" >
<line stroke="#000" y2="6" ></line>
<text fill="#000" y="9" dy="0.71em" >0.2</text>
</g>
<g class="tick" opacity="1" transform="translate(352.5,0)" >
<line stroke="#000" y2="6" ></line>
<text fill="#000" y="9" dy="0.71em" >0.4</text>
</g>
<g class="tick" opacity="1" transform="translate(528.5,0)" >
<line stroke="#000" y2="6" ></line>
<text fill="#000" y="9" dy="0.71em" >0.6</text>
</g>
<g class="tick" opacity="1" transform="translate(704.5,0)" >
<line stroke="#000" y2="6" ></line>
<text fill="#000" y="9" dy="0.71em" >0.8</text>
</g>
<g class="tick" opacity="1" transform="translate(880.5,0)" >
<line stroke="#000" y2="6" ></line>
<text fill="#000" y="9" dy="0.71em" >1.0</text>
</g>
</g>
坐标轴生成器:生成器返回axis
d3.axisTop 创建一个刻度向上的坐标轴
d3.axisRight 刻度向右
d3.axisBottom 刻度向下
d3.axisLeft 刻度向左
axis方法:
axis.scale 设置坐标轴的scale
axis.ticks() 指定刻度的数量
axis.tickSize(inner,outer) 指定刻度线长度,默认为6px
axis.tickSizeInner 同上
axis.tickSizeOuter 同上
axis.tickPadding(padding) 指定刻度线与刻度标注之间的填充,默认为3px
axis.tickFormat() 刻度标注格式化
//linear为一个线性比例尺
let xAxis=d3.axisBottom(linear).ticks(10);
containerG.append("g" )
.attr("transform" ,"translate(0,0)" )
.attr("class" ,"barAxis" )
.call(xAxis);
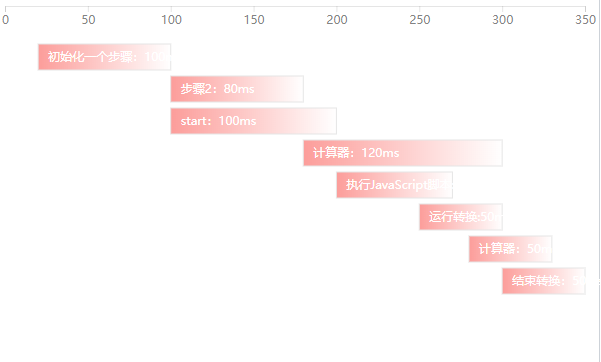
横向柱状图
准备数据
data: [
{
text: "初始化一个步骤:100ms" ,
start: 100,
end: 200
},
{
text: "初始化2个步骤:200ms" ,
start: 100,
end: 300
},
{
text: "start:80ms" ,
start: 120,
end: 200
},
{
text: "计算器:120ms" ,
start: 180,
end: 300
},
{
text: "运行转换:70ms" ,
start: 200,
end: 270
},
{
text: "运行转换:50ms" ,
start: 250,
end: 300
},
{
text: "计算器:50ms" ,
start: 280,
end: 330
},
{
text: "结束转换:50ms" ,
start: 300,
end: 350
},
]
生成线性比例尺和坐标轴
let width=1000;
let distance = d3.max(data, function (d) {
                return d.end
            });

let linear = d3.scaleLinear()
                .domain([0, distance])
                .range([0, width]);

let xAxis = d3.axisBottom(linear)
                .ticks(10);
绘制rect和text生成柱状图
let gt = this.container.selectAll(".rect" )
.data(data)
.enter()
.append("g" )
.attr("transform" , function (d, i) {
return `translate(${linear(d.start)} ,${i * 30 + 30} )`; //柱子高度30,间距30
});
this.container.append("g" )
.attr('transform' , 'translate(0,0)' )
.attr('class' , 'barAxis' )
.call(xAxis);
//柱子
gt.append('rect' )
.attr("x" , 0)
.attr("y" , 0)
.attr("height" , 26)
.attr("fill" , 'url(#blueGradient)' )
.attr("style" , 'stroke:#E5E5E5;stroke-width:1' )
.transition()
.duration(1000)
.ease(d3.easeSin In)
.delay(function (d, i) {
return d.start;
})
.attr("width" , function (d, i, nodes) {
return linear(d.end - d.start);
});
//文字
gt.append('text' )
.attr("x" , 10)
.attr("y" , 17)
.attr("class" , "barText" )
.text(function (d, i) {
return d.text;
});