let myChart = echarts.init(document.getElementById(idName));
let option = {
tooltip: {
trigger: 'axis',
backgroundColor: '#FFFFFF',
borderColor: '#D9D9D9',
lineHeight: 17,
axisPointer : { // 坐标轴指示器,坐标轴触发有效
type : 'line' // 默认为直线,可选为:'line' | 'shadow'
},
textStyle: {
color: '#4d4d4d',
fontSize: 12,
},
extraCssText: 'box-shadow: 0 10px 20px rgba(0, 0, 0, 0.1)',
},
xAxis: {
boundaryGap : false,
axisLine: {onZero: false},
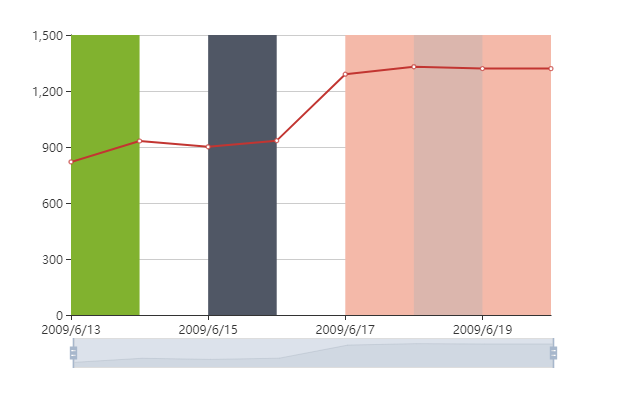
data: ['2009/6/13', '2009/6/14', '2009/6/15', '2009/6/16', '2009/6/17', '2009/6/18', '2009/6/19', '2009/6/20']
},
yAxis: {
type: 'value'
},
dataZoom: [
{
show: true,
start: 55,
},
{
type: 'inside'
}
],
series: [{
data: [820, 932, 901, 934, 1290, 1330, 1320, 1320],
type: 'line',
markArea: {//设置具体区域的背景颜色,选择不同区间 设置图表对应的背景颜色
silent: true,
data: [
[{
xAxis:'2009/6/13',
itemStyle:{
color:'#81b22f'
}
}, {
xAxis:'2009/6/14'
}],[{
xAxis:'2009/6/15',
itemStyle:{
color:'#505765'
}
}, {
xAxis:'2009/6/16'
}],[{
xAxis:'2009/6/17',
itemStyle:{
color:'#f4b9a9'
}
}, {
xAxis:'2009/6/20'
}],[{
xAxis:'2009/6/18',
itemStyle:{
color:'#a5aeb44f'
}
}, {
xAxis:'2009/6/19'
}]
]
}
}]
};
myChart.setOption(option);


