

序
本文主要研究一下openjdk的jhsdb工具
sa-jdi.jar
export JAVA_HOME="/Library/Java/JavaVirtualMachines/jdk1.8.0_151.jdk/Contents/Home"
chmod +x $JAVA_HOME/lib/sa-jdi.jar
java -cp $JAVA_HOME/lib/sa-jdi.jar sun.jvm.hotspot.HSDB
java -cp $JAVA_HOME/lib/sa-jdi.jar sun.jvm.hotspot.CLHSDB
- 在java9之前,JAVA_HOME/lib目录下有个sa-jdi.jar,可以通过如上命令启动HSDB(
图形界面)及CLHSDB(命令行) - sa-jdi.jar中的sa的全称为Serviceability Agent,它之前是sun公司提供的一个用于协助调试HotSpot的组件,而HSDB便是使用Serviceability Agent来实现的
- HSDB就是HotSpot Debugger的简称,由于Serviceability Agent在使用的时候会先attach进程,然后暂停进程进行snapshot,最后deattach进程(
进程恢复运行),所以在使用HSDB时要注意
jhsdb
/ # jhsdb
    clhsdb       	command line debugger
    debugd       	debug server
    hsdb         	ui debugger
    jstack --help	to get more information
    jmap   --help	to get more information
    jinfo  --help	to get more information
    jsnap  --help	to get more information
- jhsdb是java9引入的,可以在JAVA_HOME/bin目录下找到jhsdb;它取代了jdk9之前的JAVA_HOME/lib/sa-jdi.jar
- jhsdb有clhsdb、debugd、hsdb、jstack、jmap、jinfo、jsnap这些mode可以使用
- 其中hsdb为ui debugger,就是jdk9之前的sun.jvm.hotspot.HSDB;而clhsdb即为jdk9之前的sun.jvm.hotspot.CLHSDB
jhsdb jstack
/ # jhsdb jstack --help
    --locks	to print java.util.concurrent locks
    --mixed	to print both java and native frames (mixed mode)
    --exe	executable image name
    --core	path to coredump
    --pid	pid of process to attach
--pid用于指定JVM的进程ID;--exe用于指定可执行文件;--core用于指定core dump文件
异常
jhsdb jstack --mixed --pid 1
//......
Caused by: sun.jvm.hotspot.debugger.DebuggerException: get_thread_regs failed for a lwp
	at jdk.hotspot.agent/sun.jvm.hotspot.debugger.linux.LinuxDebuggerLocal.getThreadIntegerRegisterSet0(Native Method)
	at jdk.hotspot.agent/sun.jvm.hotspot.debugger.linux.LinuxDebuggerLocal$1GetThreadIntegerRegisterSetTask.doit(LinuxDebuggerLocal.java:534)
	at jdk.hotspot.agent/sun.jvm.hotspot.debugger.linux.LinuxDebuggerLocal$LinuxDebuggerLocalWorkerThread.run(LinuxDebuggerLocal.java:151)
如果出现这个异常表示是采用jdk版本的问题,可以尝试一下其他jdk编译版本
debugger
/ # jhsdb jstack --locks --pid 1
Attaching to process ID 1, please wait...
Debugger attached successfully.
Server compiler detected.
JVM version is 12+33
Deadlock Detection:

No deadlocks found.

"DestroyJavaVM" #32 prio=5 tid=0x000055c3b5be0800 nid=0x6 waiting on condition [0x0000000000000000]
   java.lang.Thread.State: RUNNABLE
   JavaThread state: _thread_blocked

Locked ownable synchronizers:
    - None

"http-nio-8080-Acceptor-0" #30 daemon prio=5 tid=0x000055c3b5d71800 nid=0x2f runnable [0x00007fa0d13de000]
   java.lang.Thread.State: RUNNABLE
   JavaThread state: _thread_in_native
 - sun.nio.ch.ServerSocketChannelImpl.accept0(java.io.FileDescriptor, java.io.FileDescriptor, java.net.InetSocketAddress[]) @bci=0 (Interpreted frame)
 - sun.nio.ch.ServerSocketChannelImpl.accept(java.io.FileDescriptor, java.io.FileDescriptor, java.net.InetSocketAddress[]) @bci=4, line=525 (Interpreted frame)
 - sun.nio.ch.ServerSocketChannelImpl.accept() @bci=41, line=277 (Interpreted frame)
 - org.apache.tomcat.util.net.NioEndpoint.serverSocketAccept() @bci=4, line=448 (Interpreted frame)
 - org.apache.tomcat.util.net.NioEndpoint.serverSocketAccept() @bci=1, line=70 (Interpreted frame)
 - org.apache.tomcat.util.net.Acceptor.run() @bci=98, line=95 (Interpreted frame)
 - java.lang.Thread.run() @bci=11, line=835 (Interpreted frame)

Locked ownable synchronizers:
    - <0x00000000e3aab6e0>, (a java/util/concurrent/locks/ReentrantLock$NonfairSync)

"http-nio-8080-ClientPoller-0" #29 daemon prio=5 tid=0x000055c3b5c20000 nid=0x2e runnable [0x00007fa0d14df000]
   java.lang.Thread.State: RUNNABLE
   JavaThread state: _thread_in_native
 - sun.nio.ch.EPoll.wait(int, long, int, int) @bci=0 (Interpreted frame)
 - sun.nio.ch.EPollSelectorImpl.doSelect(java.util.function.Consumer, long) @bci=96, line=120 (Interpreted frame)
 - sun.nio.ch.SelectorImpl.lockAndDoSelect(java.util.function.Consumer, long) @bci=42, line=124 (Interpreted frame)
	- locked <0x00000000e392ece8> (a sun.nio.ch.EPollSelectorImpl)
	- locked <0x00000000e392ee38> (a sun.nio.ch.Util$2)
 - sun.nio.ch.SelectorImpl.select(long) @bci=31, line=136 (Interpreted frame)
 - org.apache.tomcat.util.net.NioEndpoint$Poller.run() @bci=55, line=743 (Interpreted frame)
 - java.lang.Thread.run() @bci=11, line=835 (Interpreted frame)

Locked ownable synchronizers:
    - None

"http-nio-8080-exec-10" #28 daemon prio=5 tid=0x000055c3b48d6000 nid=0x2d waiting on condition [0x00007fa0d15e0000]
   java.lang.Thread.State: WAITING (parking)
   JavaThread state: _thread_blocked
 - jdk.internal.misc.Unsafe.park(boolean, long) @bci=0 (Interpreted frame)
	- parking to wait for <0x00000000e3901670> (a java/util/concurrent/locks/AbstractQueuedSynchronizer$ConditionObject)
 - java.util.concurrent.locks.LockSupport.park(java.lang.Object) @bci=14, line=194 (Interpreted frame)
 - java.util.concurrent.locks.AbstractQueuedSynchronizer$ConditionObject.await() @bci=42, line=2081 (Interpreted frame)
 - java.util.concurrent.LinkedBlockingQueue.take() @bci=27, line=433 (Interpreted frame)
 - org.apache.tomcat.util.threads.TaskQueue.take() @bci=36, line=107 (Interpreted frame)
 - org.apache.tomcat.util.threads.TaskQueue.take() @bci=1, line=33 (Interpreted frame)
 - java.util.concurrent.ThreadPoolExecutor.getTask() @bci=147, line=1054 (Interpreted frame)
 - java.util.concurrent.ThreadPoolExecutor.runWorker(java.util.concurrent.ThreadPoolExecutor$Worker) @bci=26, line=1114 (Interpreted frame)
 - java.util.concurrent.ThreadPoolExecutor$Worker.run() @bci=5, line=628 (Interpreted frame)
 - org.apache.tomcat.util.threads.TaskThread$WrappingRunnable.run() @bci=4, line=61 (Interpreted frame)
 - java.lang.Thread.run() @bci=11, line=835 (Interpreted frame)
 //......

/ # jhsdb jstack --mixed --pid 1
Attaching to process ID 1, please wait...
Debugger attached successfully.
Server compiler detected.
JVM version is 12+33
Deadlock Detection:

No deadlocks found.

----------------- 47 -----------------
"http-nio-8080-Acceptor-0" #30 daemon prio=5 tid=0x000055c3b5d71800 nid=0x2f runnable [0x00007fa0d13de000]
   java.lang.Thread.State: RUNNABLE
   JavaThread state: _thread_in_native
0x00007fa0ee0923ad		????????
----------------- 46 -----------------
"http-nio-8080-ClientPoller-0" #29 daemon prio=5 tid=0x000055c3b5c20000 nid=0x2e runnable [0x00007fa0d14df000]
   java.lang.Thread.State: RUNNABLE
   JavaThread state: _thread_in_native
0x00007fa0ee05f3d0	epoll_pwait + 0x1d
0x00007fa0daa97810	* sun.nio.ch.EPoll.wait(int, long, int, int) bci:0 (Interpreted frame)
0x00007fa0daa91680	* sun.nio.ch.EPollSelectorImpl.doSelect(java.util.function.Consumer, long) bci:96 line:120 (Interpreted frame)
0x00007fa0db85f57c	* sun.nio.ch.SelectorImpl.lockAndDoSelect(java.util.function.Consumer, long) bci:42 line:124 (Compiled frame)
* sun.nio.ch.SelectorImpl.select(long) bci:31 line:136 (Compiled frame)
* org.apache.tomcat.util.net.NioEndpoint$Poller.run() bci:55 line:743 (Interpreted frame)
0x00007fa0daa91c88	* java.lang.Thread.run() bci:11 line:835 (Interpreted frame)
0x00007fa0daa88849	<StubRoutines>
0x00007fa0ed122952	_ZN9JavaCalls11call_helperEP9JavaValueRK12methodHandleP17JavaCallArgumentsP6Thread + 0x3c2
0x00007fa0ed1208d0	_ZN9JavaCalls12call_virtualEP9JavaValue6HandleP5KlassP6SymbolS6_P6Thread + 0x200
0x00007fa0ed1ccfc5	_ZL12thread_entryP10JavaThreadP6Thread + 0x75
0x00007fa0ed74f3a3	_ZN10JavaThread17thread_main_innerEv + 0x103
0x00007fa0ed74c3f5	_ZN6Thread8call_runEv + 0x75
0x00007fa0ed4a477e	_ZL19thread_native_entryP6Thread + 0xee
//......
--locks或者--mixed花费的时间可能比较长(
几分钟,可能要将近6分钟),因而进程暂停的时间也可能比较长,在使用这两个选项时要注意
jhsdb jmap
jmap -heap pid
/ # jmap -heap 1
Error: -heap option used
Cannot connect to core dump or remote debug server. Use jhsdb jmap instead
jdk9及以上版本使用jmap -heap pid命令查看当前heap使用情况时,发现报错,提示需要使用jhsdb jmap来替代
jhsdb jmap pid
/ # jhsdb jmap 1
sh: jhsdb: not found
发现jlink的时候没有添加jdk.hotspot.agent这个module,添加了这个module之后可以发现JAVA_HOME/bin目录下就有了jhsdb
PTRACE_ATTACH failed
/ # jhsdb jmap 1
You have to set --pid or --exe.
    <no option>	to print same info as Solaris pmap
    --heap	to print java heap summary
    --binaryheap	to dump java heap in hprof binary format
    --dumpfile	name of the dump file
    --histo	to print histogram of java object heap
    --clstats	to print class loader statistics
    --finalizerinfo	to print information on objects awaiting finalization
    --exe	executable image name
    --core	path to coredump
    --pid	pid of process to attach
/ # jhsdb jmap --heap --pid 1
Attaching to process ID 1, please wait...
ERROR: ptrace(PTRACE_ATTACH, ..) failed for 1: Operation not permitted
Error attaching to process: sun.jvm.hotspot.debugger.DebuggerException: Can't attach to the process: ptrace(PTRACE_ATTACH, ..) failed for 1: Operation not permitted
sun.jvm.hotspot.debugger.DebuggerException: sun.jvm.hotspot.debugger.DebuggerException: Can't attach to the process: ptrace(PTRACE_ATTACH, ..) failed for 1: Operation not permitted
	at jdk.hotspot.agent/sun.jvm.hotspot.debugger.linux.LinuxDebuggerLocal$LinuxDebuggerLocalWorkerThread.execute(LinuxDebuggerLocal.java:176)
	at jdk.hotspot.agent/sun.jvm.hotspot.debugger.linux.LinuxDebuggerLocal.attach(LinuxDebuggerLocal.java:336)
	at jdk.hotspot.agent/sun.jvm.hotspot.HotSpotAgent.attachDebugger(HotSpotAgent.java:672)
	at jdk.hotspot.agent/sun.jvm.hotspot.HotSpotAgent.setupDebuggerLinux(HotSpotAgent.java:612)
	at jdk.hotspot.agent/sun.jvm.hotspot.HotSpotAgent.setupDebugger(HotSpotAgent.java:338)
	at jdk.hotspot.agent/sun.jvm.hotspot.HotSpotAgent.go(HotSpotAgent.java:305)
	at jdk.hotspot.agent/sun.jvm.hotspot.HotSpotAgent.attach(HotSpotAgent.java:141)
	at jdk.hotspot.agent/sun.jvm.hotspot.tools.Tool.start(Tool.java:185)
	at jdk.hotspot.agent/sun.jvm.hotspot.tools.Tool.execute(Tool.java:118)
	at jdk.hotspot.agent/sun.jvm.hotspot.tools.JMap.main(JMap.java:176)
	at jdk.hotspot.agent/sun.jvm.hotspot.SALauncher.runJMAP(SALauncher.java:326)
	at jdk.hotspot.agent/sun.jvm.hotspot.SALauncher.main(SALauncher.java:455)
Caused by: sun.jvm.hotspot.debugger.DebuggerException: Can't attach to the process: ptrace(PTRACE_ATTACH, ..) failed for 1: Operation not permitted
	at jdk.hotspot.agent/sun.jvm.hotspot.debugger.linux.LinuxDebuggerLocal.attach0(Native Method)
	at jdk.hotspot.agent/sun.jvm.hotspot.debugger.linux.LinuxDebuggerLocal$1AttachTask.doit(LinuxDebuggerLocal.java:326)
	at jdk.hotspot.agent/sun.jvm.hotspot.debugger.linux.LinuxDebuggerLocal$LinuxDebuggerLocalWorkerThread.run(LinuxDebuggerLocal.java:151)
发现PTRACE_ATTACH被docker禁用了,需要在运行容器时启用PTRACE_ATTACH
docker启用SYS_PTRACE
docker run --cap-add=SYS_PTRACE
之后就可以正常使用jhsdb如下:
/ # jhsdb jmap --heap --pid 1
Attaching to process ID 1, please wait...
Debugger attached successfully.
Server compiler detected.
JVM version is 12+33

using thread-local object allocation.
Shenandoah GC with 4 thread(s)

Heap Configuration:
   MinHeapFreeRatio         = 40
   MaxHeapFreeRatio         = 70
   MaxHeapSize              = 523763712 (499.5MB)
   NewSize                  = 1363144 (1.2999954223632812MB)
   MaxNewSize               = 17592186044415 MB
   OldSize                  = 5452592 (5.1999969482421875MB)
   NewRatio                 = 2
   SurvivorRatio            = 8
   MetaspaceSize            = 21807104 (20.796875MB)
   CompressedClassSpaceSize = 1073741824 (1024.0MB)
   MaxMetaspaceSize         = 17592186044415 MB
   ShenandoahRegionSize     = 262144 (0.25MB)

Heap Usage:
Shenandoah Heap:
   regions   = 1997
   capacity  = 523501568 (499.25MB)
   used      = 70470552 (67.2059555053711MB)
   committed = 144441344 (137.75MB)
jhsdb jinfo
/ # jhsdb jinfo --help
    --flags	to print VM flags
    --sysprops	to print Java System properties
    <no option>	to print both of the above
    --exe	executable image name
    --core	path to coredump
    --pid	pid of process to attach
使用jhsdb显示jinfo的sysprops如下:
/ # jhsdb jinfo --sysprops --pid 1
Attaching to process ID 1, please wait...
Debugger attached successfully.
Server compiler detected.
JVM version is 12+33
awt.toolkit = sun.awt.X11.XToolkit
java.specification.version = 12
sun.jnu.encoding = UTF-8
//......
这个命令其实跟jinfo -sysprops 1是等价的
jhsdb jsnap
/ # jhsdb jsnap --pid 1
Attaching to process ID 1, please wait...
Debugger attached successfully.
Server compiler detected.
JVM version is 12+33
java.threads.started=27 event(s)
java.threads.live=24
java.threads.livePeak=24
java.threads.daemon=20
java.cls.loadedClasses=8250 event(s)
java.cls.unloadedClasses=1 event(s)
java.cls.sharedLoadedClasses=0 event(s)
java.cls.sharedUnloadedClasses=0 event(s)
java.ci.totalTime=18236958158 tick(s)
java.property.java.vm.specification.version=12
java.property.java.vm.specification.name=Java Virtual Machine Specification
java.property.java.vm.specification.vendor=Oracle Corporation
java.property.java.vm.version=12+33
java.property.java.vm.name=OpenJDK 64-Bit Server VM
java.property.java.vm.vendor=Azul Systems, Inc.
java.property.java.vm.info=mixed mode
java.property.jdk.debug=release
//......
jhsdb jsnap的功能主要是由jdk.hotspot.agent模块中的sun.jvm.hotspot.tools.JSnap.java来提供的,它可以用于查看threads及class loading/unloading相关的event、JVM属性参数等,其中--all可以显示更多的JVM属性参数
jhsdb与jcmd
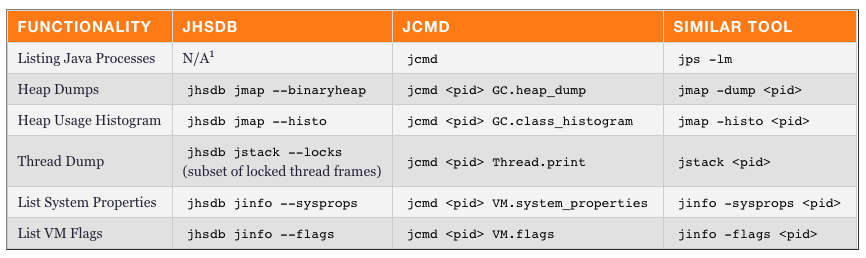
jhsdb: A New Tool for JDK 9这篇文章中列出了jhsdb与jcmd的等价命令,如下图:
小结
- 在java9之前,JAVA_HOME/lib目录下有个sa-jdi.jar,可以通过如上命令启动HSDB(
图形界面)及CLHSDB(命令行);sa-jdi.jar中的sa的全称为Serviceability Agent,它之前是sun公司提供的一个用于协助调试HotSpot的组件,而HSDB便是使用Serviceability Agent来实现的;HSDB就是HotSpot Debugger的简称,由于Serviceability Agent在使用的时候会先attach进程,然后暂停进程进行snapshot,最后deattach进程(进程恢复运行),所以在使用HSDB时要注意 - jhsdb是java9引入的,可以在JAVA_HOME/bin目录下找到jhsdb;它取代了jdk9之前的JAVA_HOME/lib/sa-jdi.jar;jhsdb有clhsdb、debugd、hsdb、jstack、jmap、jinfo、jsnap这些mode可以使用;其中hsdb为ui debugger,就是jdk9之前的sun.jvm.hotspot.HSDB;而clhsdb即为jdk9之前的sun.jvm.hotspot.CLHSDB
- jhsdb在jdk.hotspot.agent这个模块中;对于jhsdb jstack的--locks或者--mixed命令花费的时间可能比较长(
几分钟,可能要将近6分钟),因而进程暂停的时间也可能比较长,在使用这两个选项时要注意;对于jdk9及以后的版本不再使用jmap -heap命令来查询heap内存情况,需要用jhsdb jmap --heap --pid来替代;使用jhsdb jmap需要在运行容器时启用PTRACE_ATTACH才可以
