

Python代码
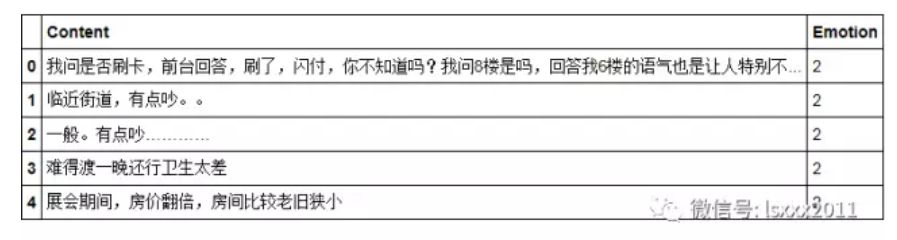
# 导入第三包
import jieba
from sklearn.feature_extraction.text import TfidfVectorizer
from sklearn.naive_bayes import GaussianNB
from sklearn.ensemble import RandomForestClassifier
from sklearn.cross_validation import train_test_split
from sklearn import metrics
import pandas as pd
import matplotlib.pyplot as plt

# 读入评论数据
evaluation = pd.read_excel('Hotel Evaluation.xlsx',sheetname=1)
# 展示数据前5行
evaluation.head()
# 读入自定义词
with open('all_words.txt', encoding='UTF-8') as words:

   my_words = [i.strip() for i in words.readlines()]

# 将自定义词加入到jieba分词器中
for word in my_words:

   jieba.add_word(word)

# 读入停止词
with open('mystopwords.txt', encoding='UTF-8') as words:

   stop_words = [i.strip() for i in words.readlines()]

# 基于切词函数,构造自定义函数
def cut_word(sentence):

   words = [i for i in jieba.cut(sentence) if i not in stop_words]

   # 切完的词用空格隔开

   result = ' '.join(words)

   return(result)
上面代码所做的工作是将用户自定义词设置到jieba分词器中,同时,构造切词的自定义函数,添加的附加功能是删除停用词。
# TFIDF权重(根据词频,选出高频的20个词)
tfidf = TfidfVectorizer(max_features=20)

# 文档词条矩阵
dtm = tfidf.fit_transform(words).toarray()
# 矩阵的列名称
columns = tfidf.get_feature_names()
# 将矩阵转换为数据框--即X变量
X = pd.DataFrame(dtm, columns=columns)
# 情感标签变量
y = evaluation.Emotion

# 将数据集拆分为训练集和测试集
X_train,X_test,y_train,y_test = train_test_split(X,y,train_size = 0.8, random_state=1)
使用TFIDF权重构造文档词条矩阵,注意,这里根据词频选择了最高频的20个词,作为矩阵的列数。
# 朴素贝叶斯模型
nb = GaussianNB()
# 建模
fit = nb.fit(X_train,y_train)
# 预测
pred = fit.predict(X_test)

# 测试集上的准确率
accuracy = metrics.accuracy_score(y_test,pred)
print(accuracy)
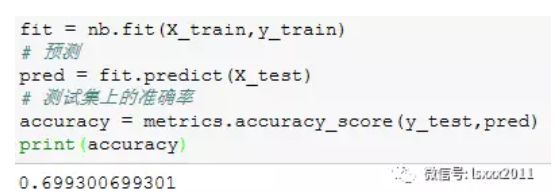
通过构建朴素贝叶斯模型,得到的样本测试集准确率约为70%。
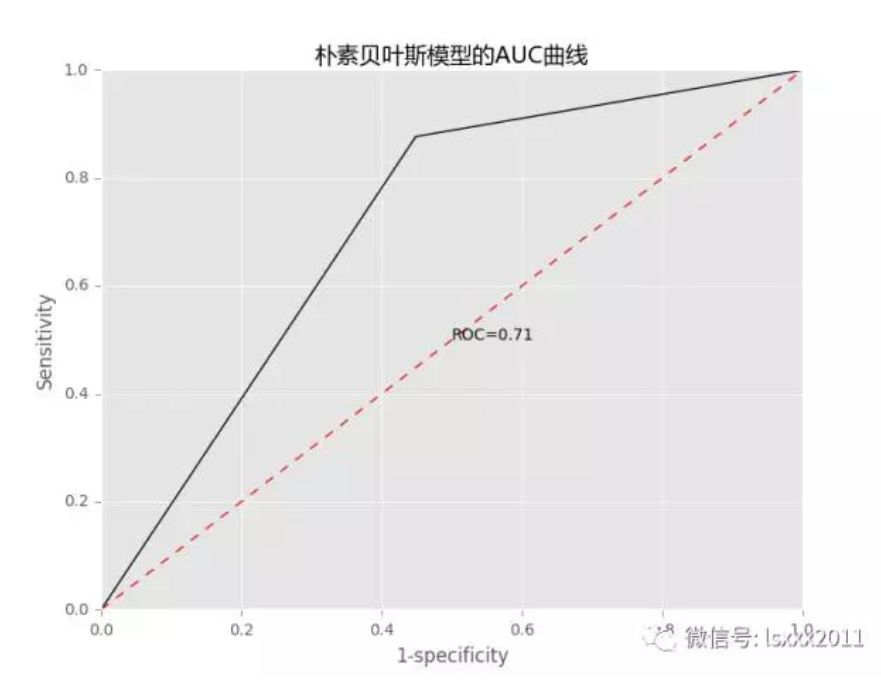
# 模型优度的可视化展现
fpr, tpr, _ = metrics.roc_curve(y_test, pred,pos_label=2)

auc = metrics.auc(fpr, tpr)

# 中文和负号的正常显示
plt.rcParams['font.sans-serif'] = ['Microsoft YaHei']

plt.rcParams['axes.unicode_minus'] = False
# 设置绘图风格
plt.style.use('ggplot')

# 绘制ROC曲线
plt.plot(fpr, tpr,'')
# 绘制参考线
plt.plot((0,1),(0,1),'r--')
# 添加文本注释
plt.text(0.5,0.5,'ROC=%.2f' %auc)
# 设置坐标轴标签和标题
plt.title('朴素贝叶斯模型的AUC曲线')

plt.xlabel('1-specificity')

plt.ylabel('Sensitivity')

# 去除图形顶部边界和右边界的刻度
plt.tick_params(top='off', right='off')
# 图形显示
plt.show()
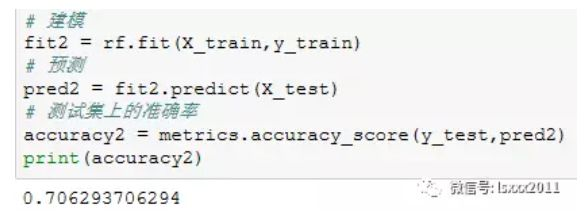
# 随机森林模型

rf = RandomForestClassifier()
# 建模

fit2 = rf.fit(X_train,y_train)
# 预测

pred2 = fit2.predict(X_test)
# 测试集上的准确率

accuracy2 = metrics.accuracy_score(y_test,pred2)
print(accuracy2)
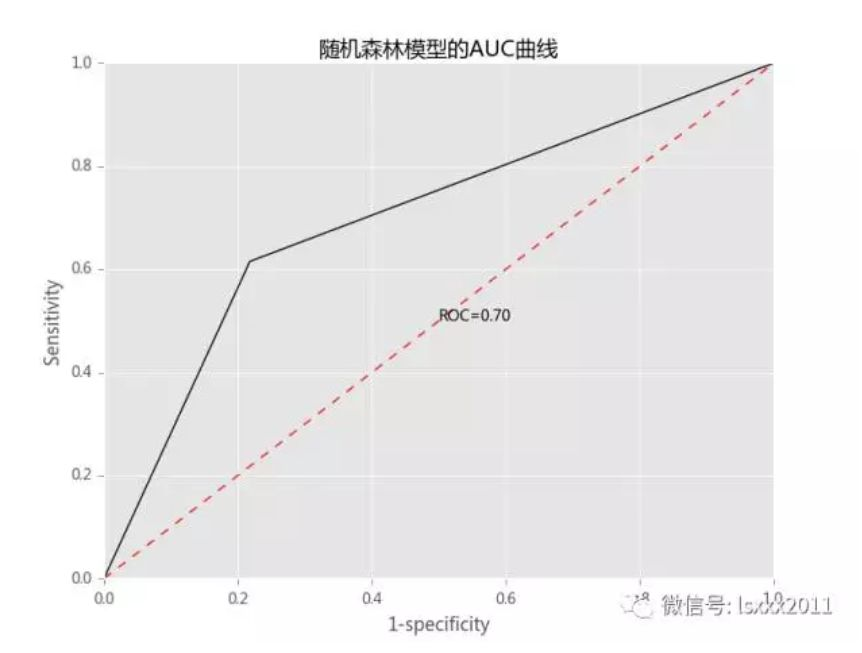
# 模型优度的可视化展现

fpr2, tpr2, _ = metrics.roc_curve(y_test, pred2,pos_label=2)

auc2 = metrics.auc(fpr2, tpr2)

# 中文和负号的正常显示

plt.rcParams['font.sans-serif'] = ['Microsoft YaHei']

plt.rcParams['axes.unicode_minus'] = False
# 设置绘图风格

plt.style.use('ggplot')

# 绘制ROC曲线

plt.plot(fpr2, tpr2,'')
# 绘制参考线

plt.plot((0,1),(0,1),'r--')
# 添加文本注释

plt.text(0.5,0.5,'ROC=%.2f' %auc2)
# 设置坐标轴标签和标题

plt.title('随机森林模型的AUC曲线')

plt.xlabel('1-specificity')

plt.ylabel('Sensitivity')

# 去除图形顶部边界和右边界的刻度

plt.tick_params(top='off', right='off')
# 图形显示

plt.show()
结语
OK,关于使用Python完成情感分类的实战我们就分享到这里,大家注意,上面的方法是通过构造DFIDF权重的文档词条矩阵(词袋法)。如果你的文本非常大的话,使用这种方法会导致“词汇鸿沟”,即形成非常庞大的矩阵(而且还是稀疏矩阵),就会吃掉电脑的很多内存。而且这种方法还不能考虑到词与词之间的逻辑顺序。为了克服这个问题,科学家想出了 词向量、文档向量等方法,后期我也会把这部分内容的理论和实战给大家做一个分享。如果你有任何问题,欢迎在公众号的留言区域表达你的疑问。同时,也欢迎各位朋友继续转发与分享文中的内容,让更多的人学习和进步。
转载。原文:http://blog.csdn.net/kMD8d5R/article/details/78986643
