

微服务监控主要分为两部分,一部分是对微服务本身的监控,另一方面是对整个调用链的监控。目前,我们主要采用dubbo作为rpc框架,所以下面重点介绍dubbo监控。
1、dubbo监控
1.1、原理
dubbo架构如下:
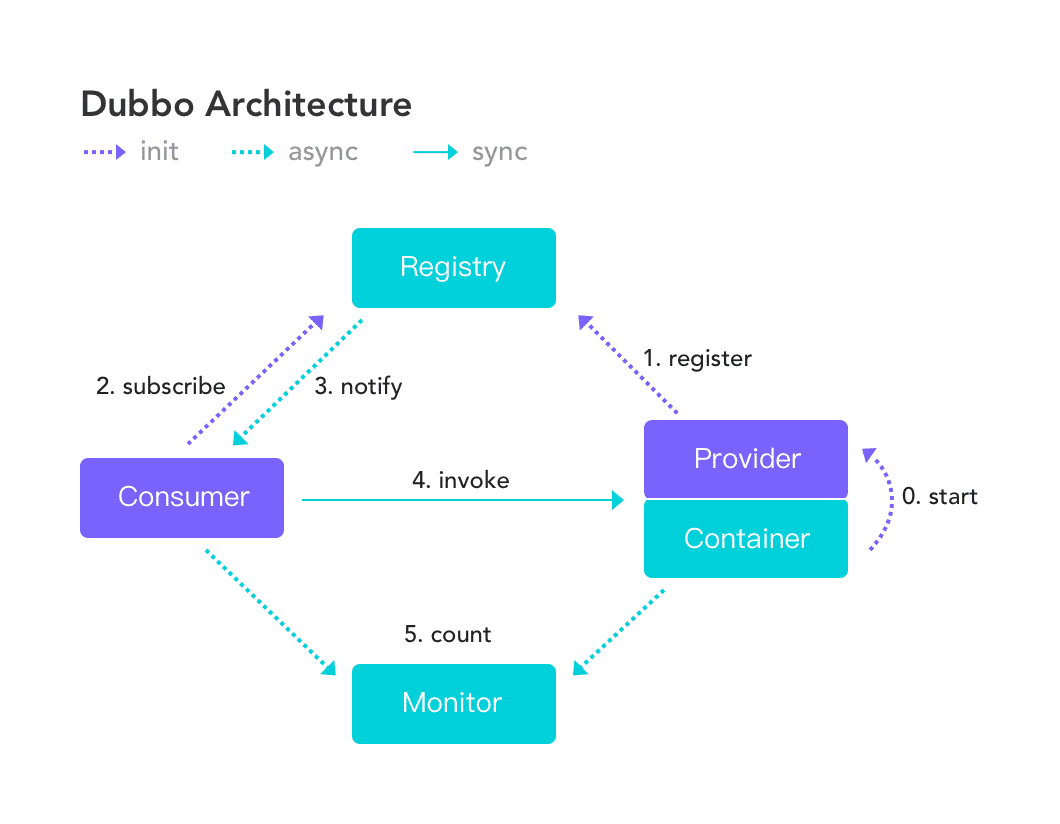
通过阅读dubbo源码,所有的rpc方法调用都会经过MonitorFilter进行拦截,
MonitorFilter.invoke()
public Result invoke(Invoker<?> invoker, Invocation invocation) throws RpcException {
        if (invoker.getUrl().hasParameter("monitor")) {
            RpcContext context = RpcContext.getContext();
            long start = System.currentTimeMillis();
            this.getConcurrent(invoker, invocation).incrementAndGet();

            Result var7;
            try {
                Result result = invoker.invoke(invocation);
            this.collect(invoker, invocation, result, context, start, false);
                var7 = result;
            } catch (RpcException var11) {
                this.collect(invoker, invocation, (Result)null, context, start, true);
                throw var11;
            } finally {
                this.getConcurrent(invoker, invocation).decrementAndGet();
            }

            return var7;
        } else {
            return invoker.invoke(invocation);
        }
    }
对于配置了监控的服务,会收集一些方法的基本统计信息。
MonitorFilter.collect()
private void collect(Invoker<?> invoker, Invocation invocation, Result result, RpcContext context, long start, boolean error) {
        try {
            long elapsed = System.currentTimeMillis() - start;
            int concurrent = this.getConcurrent(invoker, invocation).get();
            String application = invoker.getUrl().getParameter("application");
            String service = invoker.getInterface().getName();
            String method = RpcUtils.getMethodName(invocation);
            URL url = invoker.getUrl().getUrlParameter("monitor");
            Monitor monitor = this.monitorFactory.getMonitor(url);
            int localPort;
            String remoteKey;
            String remoteValue;
            if ("consumer".equals(invoker.getUrl().getParameter("side"))) {
                context = RpcContext.getContext();
                localPort = 0;
                remoteKey = "provider";
                remoteValue = invoker.getUrl().getAddress();
            } else {
                localPort = invoker.getUrl().getPort();
                remoteKey = "consumer";
                remoteValue = context.getRemoteHost();
            }

            String input = "";
            String output = "";
            if (invocation.getAttachment("input") != null) {
                input = invocation.getAttachment("input");
            }

            if (result != null && result.getAttachment("output") != null) {
                output = result.getAttachment("output");
            }

            monitor.collect(new URL("count", NetUtils.getLocalHost(), localPort, service + "/" + method, new String[]{"application", application, "interface", service, "method", method, remoteKey, remoteValue, error ? "failure" : "success", "1", "elapsed", String.valueOf(elapsed), "concurrent", String.valueOf(concurrent), "input", input, "output", output}));
        } catch (Throwable var21) {
            logger.error("Failed to monitor count service " + invoker.getUrl() + ", cause: " + var21.getMessage(), var21);
        }
    }
DubboMonitor对收集到的数据进行简单统计,诸如成功次数,失败次数,调用时间等,统计完后存储数据到本地。
DubboMonitor.collect()
public void collect(URL url) {
        int success = url.getParameter("success", 0);
        int failure = url.getParameter("failure", 0);
        int input = url.getParameter("input", 0);
        int output = url.getParameter("output", 0);
        int elapsed = url.getParameter("elapsed", 0);
        int concurrent = url.getParameter("concurrent", 0);
        Statistics statistics = new Statistics(url);
        AtomicReference<long[]> reference = (AtomicReference)this.statisticsMap.get(statistics);
        if (reference == null) {
            this.statisticsMap.putIfAbsent(statistics, new AtomicReference());
            reference = (AtomicReference)this.statisticsMap.get(statistics);
        }

        long[] update = new long[10];

        long[] current;
        do {
            current = (long[])reference.get();
            if (current == null) {
                update[0] = (long)success;
                update[1] = (long)failure;
                update[2] = (long)input;
                update[3] = (long)output;
                update[4] = (long)elapsed;
                update[5] = (long)concurrent;
                update[6] = (long)input;
                update[7] = (long)output;
                update[8] = (long)elapsed;
                update[9] = (long)concurrent;
            } else {
                update[0] = current[0] + (long)success;
                update[1] = current[1] + (long)failure;
                update[2] = current[2] + (long)input;
                update[3] = current[3] + (long)output;
                update[4] = current[4] + (long)elapsed;
                update[5] = (current[5] + (long)concurrent) / 2L;
                update[6] = current[6] > (long)input ? current[6] : (long)input;
                update[7] = current[7] > (long)output ? current[7] : (long)output;
                update[8] = current[8] > (long)elapsed ? current[8] : (long)elapsed;
                update[9] = current[9] > (long)concurrent ? current[9] : (long)concurrent;
            }
        } while(!reference.compareAndSet(current, update));

    }
DubboMonitor有异步线程定时(默认每分钟)将收集到数据发送到远端监控服务。
 public DubboMonitor(Invoker<MonitorService> monitorInvoker, MonitorService monitorService) {
        this.monitorInvoker = monitorInvoker;
        this.monitorService = monitorService;
        this.monitorInterval = (long)monitorInvoker.getUrl().getPositiveParameter("interval", 60000);
        this.sendFuture = this.scheduledExecutorService.scheduleWithFixedDelay(new Runnable() {
            public void run() {
                try {
                    DubboMonitor.this.send();
                } catch (Throwable var2) {
                    DubboMonitor.logger.error("Unexpected error occur at send statistic, cause: " + var2.getMessage(), var2);
                }

            }
        }, this.monitorInterval, this.monitorInterval, TimeUnit.MILLISECONDS);
    }
调用远端的MonitorService.collect方法,然后将本地缓存数据置置零。
DubboMonitor.send()
 public void send() {
        if (logger.isInfoEnabled()) {
            logger.info("Send statistics to monitor " + this.getUrl());
        }

        String timestamp = String.valueOf(System.currentTimeMillis());
        Iterator i$ = this.statisticsMap.entrySet().iterator();

        while(i$.hasNext()) {
            Entry<Statistics, AtomicReference<long[]>> entry = (Entry)i$.next();
            Statistics statistics = (Statistics)entry.getKey();
            AtomicReference<long[]> reference = (AtomicReference)entry.getValue();
            long[] numbers = (long[])reference.get();
            long success = numbers[0];
            long failure = numbers[1];
            long input = numbers[2];
            long output = numbers[3];
            long elapsed = numbers[4];
            long concurrent = numbers[5];
            long maxInput = numbers[6];
            long maxOutput = numbers[7];
            long maxElapsed = numbers[8];
            long maxConcurrent = numbers[9];
            URL url = statistics.getUrl().addParameters(new String[]{"timestamp", timestamp, "success", String.valueOf(success), "failure", String.valueOf(failure), "input", String.valueOf(input), "output", String.valueOf(output), "elapsed", String.valueOf(elapsed), "concurrent", String.valueOf(concurrent), "max.input", String.valueOf(maxInput), "max.output", String.valueOf(maxOutput), "max.elapsed", String.valueOf(maxElapsed), "max.concurrent", String.valueOf(maxConcurrent)});
            this.monitorService.collect(url);
            long[] update = new long[10];

            while(true) {
                long[] current = (long[])reference.get();
                if (current == null) {
                    update[0] = 0L;
                    update[1] = 0L;
                    update[2] = 0L;
                    update[3] = 0L;
                    update[4] = 0L;
                    update[5] = 0L;
                } else {
                    update[0] = current[0] - success;
                    update[1] = current[1] - failure;
                    update[2] = current[2] - input;
                    update[3] = current[3] - output;
                    update[4] = current[4] - elapsed;
                    update[5] = current[5] - concurrent;
                }

                if (reference.compareAndSet(current, update)) {
                    break;
                }
            }
        }

    }
dubbo监控的主流开源项目,都是实现了MonitorService接口来实现监控,区别无非就是数据存储,报表统计逻辑的差异,基本原理都大同小异。
public interface MonitorService {
    String APPLICATION = "application";
    String INTERFACE = "interface";
    String METHOD = "method";
    String GROUP = "group";
    String VERSION = "version";
    String CONSUMER = "consumer";
    String PROVIDER = "provider";
    String TIMESTAMP = "timestamp";
    String SUCCESS = "success";
    String FAILURE = "failure";
    String INPUT = "input";
    String OUTPUT = "output";
    String ELAPSED = "elapsed";
    String CONCURRENT = "concurrent";
    String MAX_INPUT = "max.input";
    String MAX_OUTPUT = "max.output";
    String MAX_ELAPSED = "max.elapsed";
    String MAX_CONCURRENT = "max.concurrent";

    void collect(URL var1);

    List<URL> lookup(URL var1);
}
1.2、监控选型
主流dubbo监控主要有:
- dubbo-monitor
- dubbo-d-monitor
- dubbokeeper
- dubbo-monitor-simple
下面进行简单的对比:
| 方案 | 支持版本 | 基础功能 | 开源作者 | 社区活跃度 | 数据存储 | 维护成本 |
|---|---|---|---|---|---|---|
| dubbo-monitor | 基于dubbox,理论上也支持dubbo | 一般,QPS、RT、服务状态等,缺乏报表功能 | 韩都衣舍 | 513星,两年前有提交 | mysql、mongodb | 无侵入、需要定期清理历史数据 |
| dubbo-d-monitor | dubbo | 一般,只有一些基础数据 | 个人 | 189星,一年前有提交 | mysql、redis(后续不再维护) | 无侵入、需要定期清理历史数据 |
| dubbokeeper | dubbo | 丰富,除了基础指标数据,有top200数据报表,还提供了类似dubbo-admin功能(限流、超时时间设置、消费客户端设置、容错等),同时支持zk节点可视化 | 个人组织 | 989星,一个月内有提交 | mysql、mongodb、lucene | 无侵入、需要定期清理历史记录 |
| dubbo-monitor-simple | dubbo | 简陋 | dubbo官方 | 330星,一个月内有提交 | 文件存储 | 无侵入、但目前线上使用发现数据量大了经常挂 |
对比以上几种,dubbokeeper>dubbo-monitor>dubbo-d-monitor,所以选取dubbokeeper最为dubbo服务监控方案。
1.3、部署
我们采用mongodb存储方案,采用单机部署。
环境:jdk1.8及以上(低版未测试),安装tomcat,安装zookeeper并启动,安装启动mongodb
1、获取源码 github.com/dubboclub/d…
2、解压下载下来的zip包dubbokeeper-master到任意目录,修改解压后的项目中dubbo及数据库的配置\dubbokeeper-master\conf\dubbo-mongodb.properties。
执行\dubbokeeper-master\install-mongodb.sh 执行完上一步后会生成一个target目录,目录下会存在以下三个文件夹及一个压缩包
 archive-tmp
 mongodb-dubbokeeper-server
 mongodb-dubbokeeper-ui
 mongodb-dubbokeeper-server.tar.gz
3、执行mongodb-dubbokeeper-server/bin/start-mongodb.sh启动存储端(数据存储和web端是分开独立部署的)
4、将mongodb-dubbokeeper-ui下的war包拷贝到tomcat的webapps目录下,启动tomcat。
5、最后,打开浏览器,输入http://localhost:8080/dubbokeeper-ui-1.0.1即可。
在业务代码中,只需要配置dubbo监控连接到注册中心,就能完成监控数据采集。
<dubbo:monitor protocol="registry"/>
主要的配置信息:
dubbo.application.name=mongodb-monitor
dubbo.application.owner=bieber
dubbo.registry.address=zookeeper://*.*.*.*:2181?backup=*.*.*.*:2181,*.*.*.*:2181
dubbo.protocol.name=dubbo
dubbo.protocol.port=20884
dubbo.protocol.dubbo.payload=20971520

#dubbo数据采集周期 单位毫秒
monitor.collect.interval=60000

#use netty4
dubbo.provider.transporter=netty4

#dubbokeeper写入mongodb周期 单位秒
monitor.write.interval=60

#mongdb配置
dubbo.monitor.mongodb.url=localhost
dubbo.monitor.mongodb.port=27017
dubbo.monitor.mongodb.dbname=dubbokeeper
dubbo.monitor.mongodb.username=
dubbo.monitor.mongodb.password=
dubbo.monitor.mongodb.storage.timeout=60000
1.4、主要功能介绍
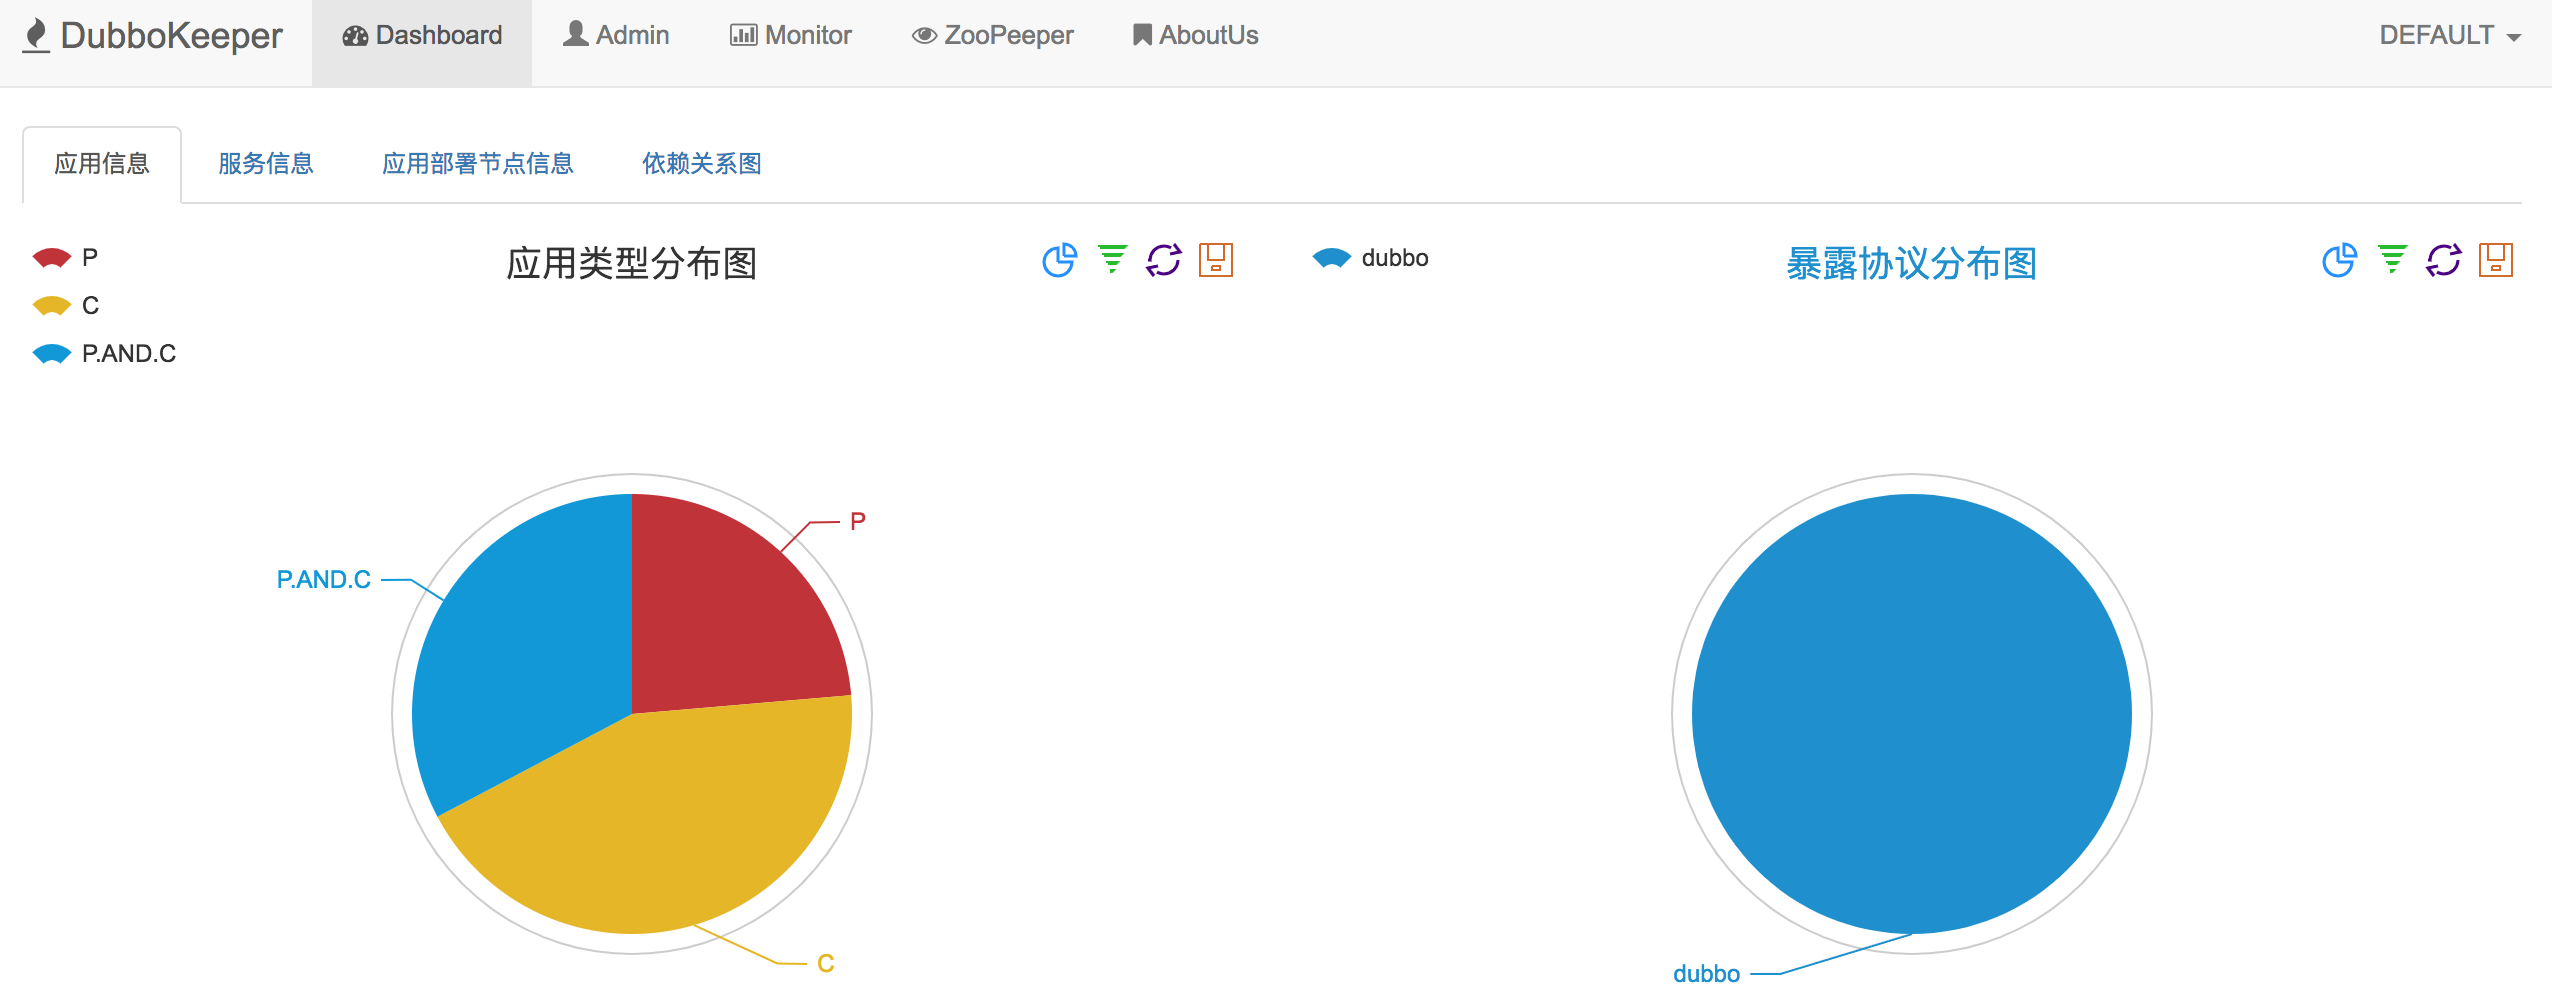
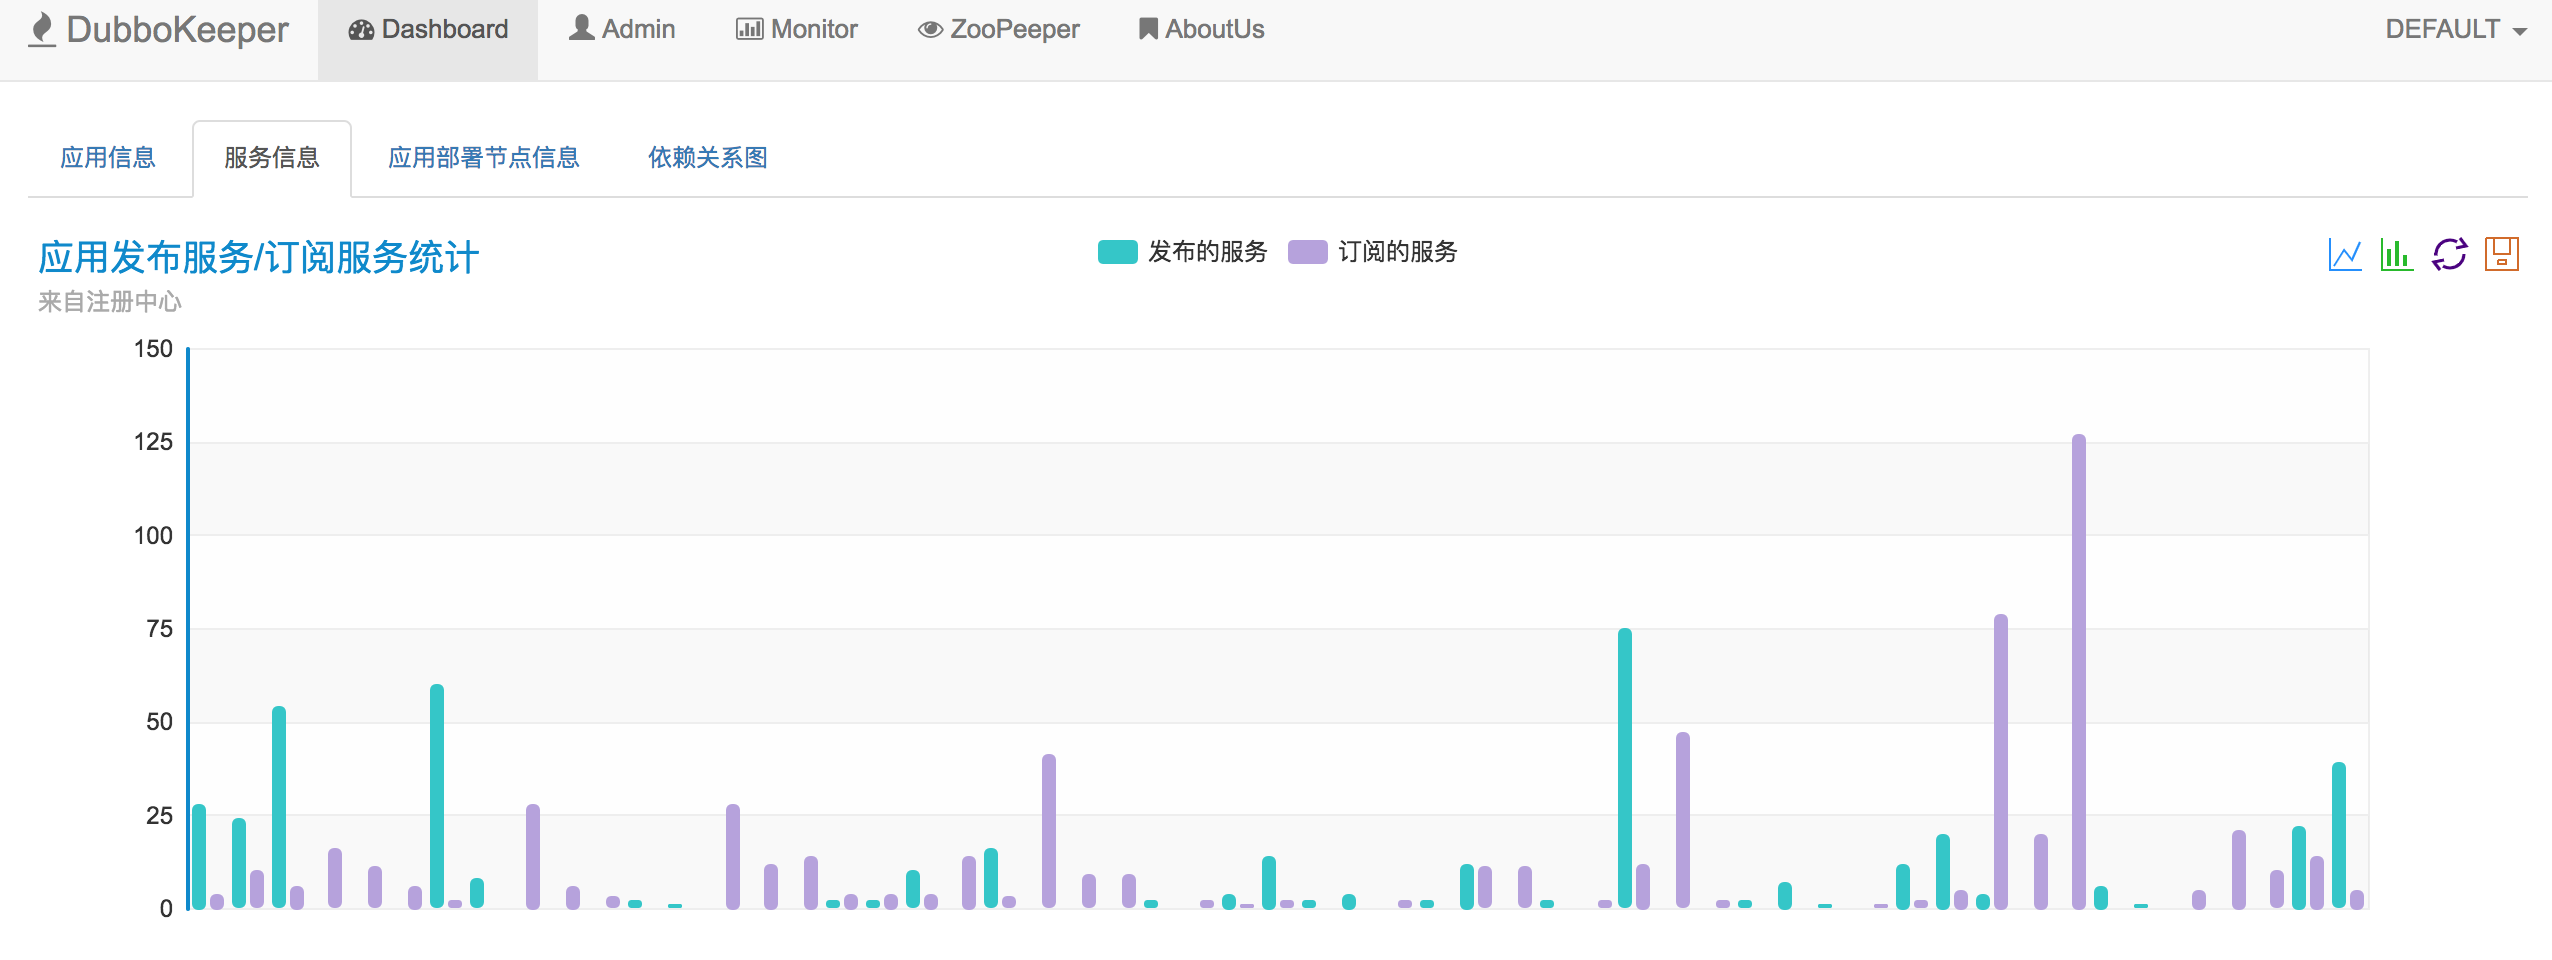
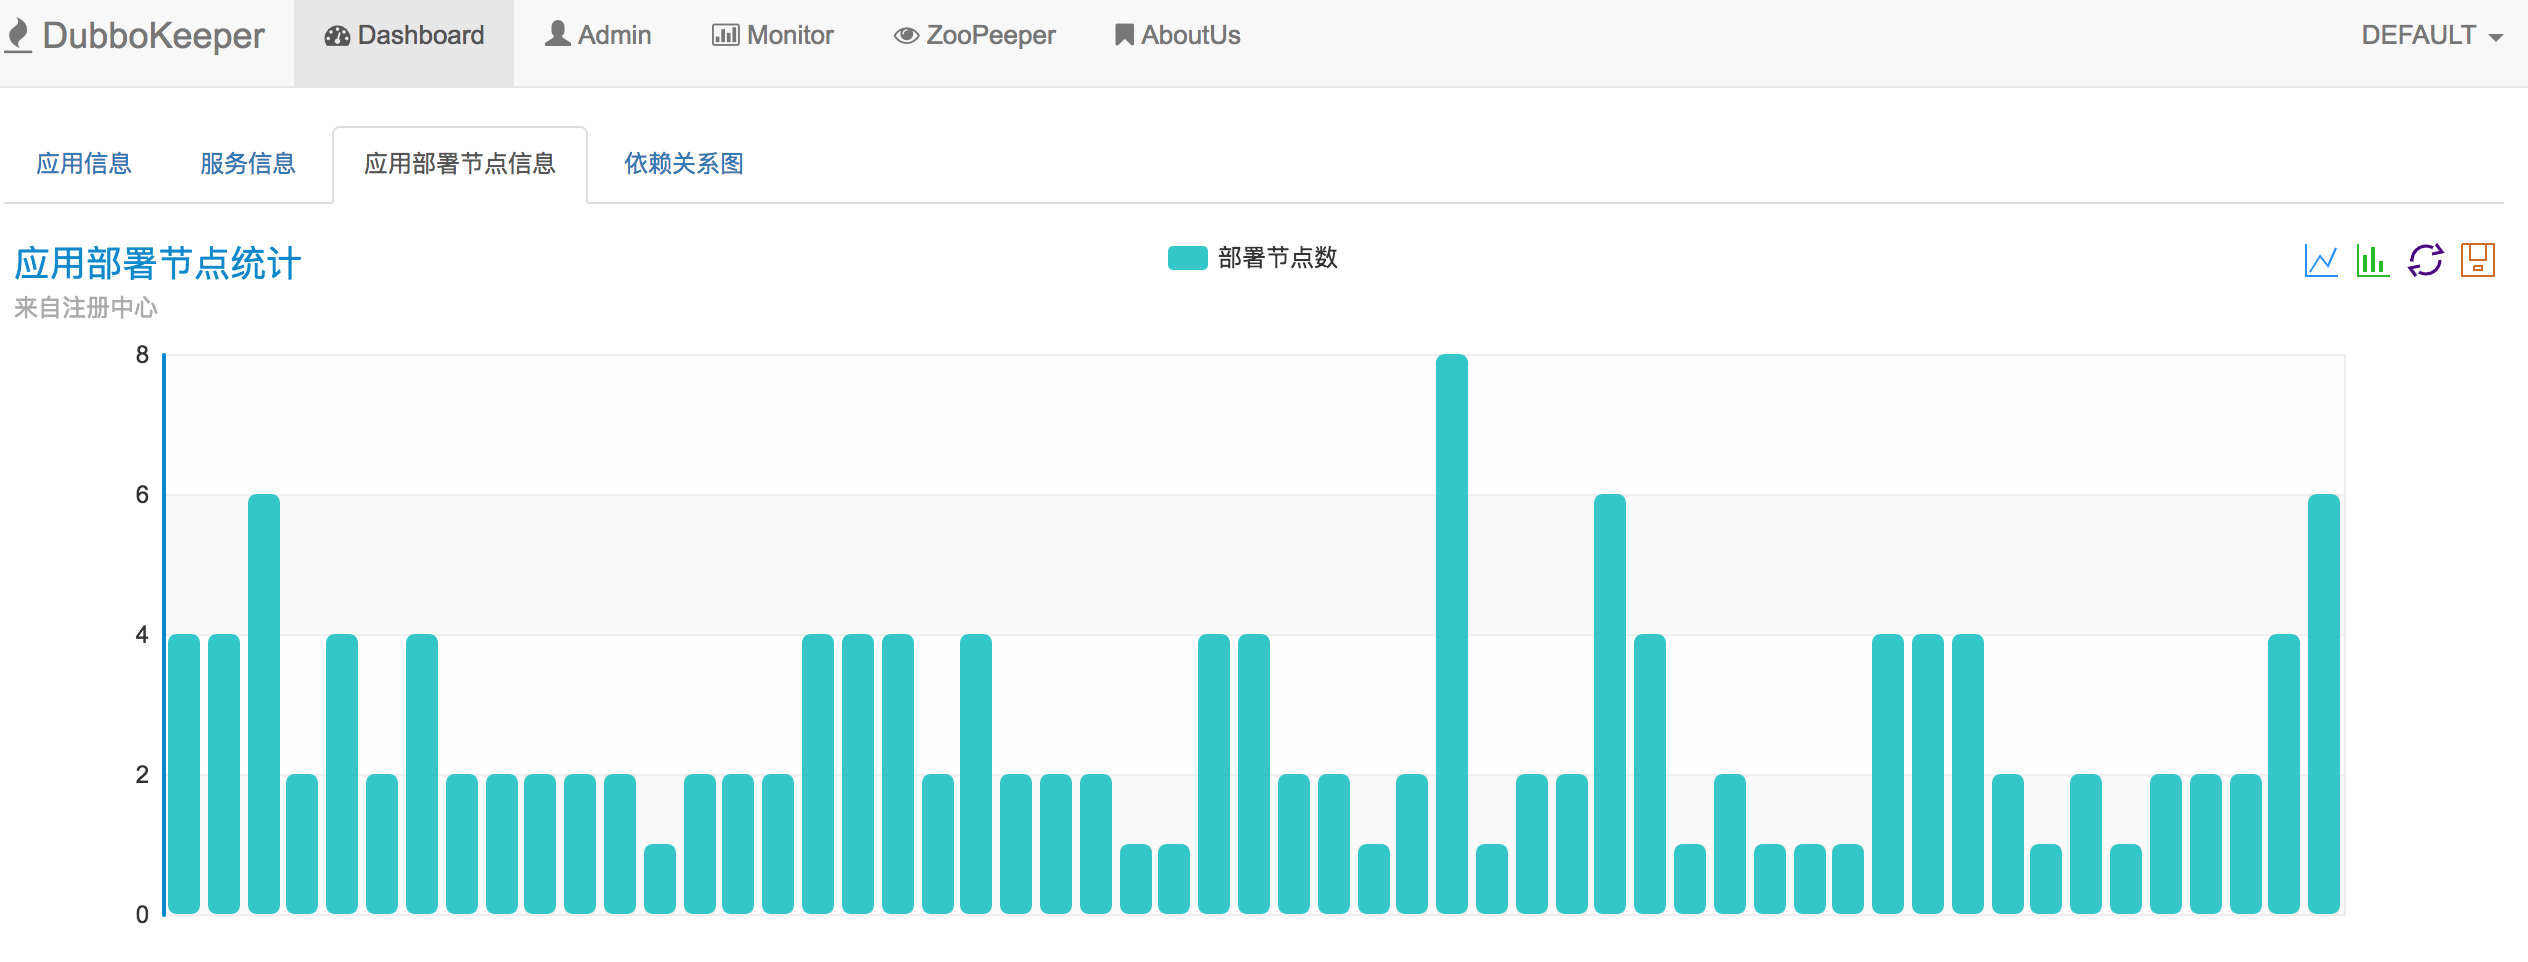
首页能看到应用总体信息(区分应用提供者和消费者),服务数量信息,节点部署信息及依赖关系图等。
Admin提供了所有原生dubbo-admin的绝大部分功能。
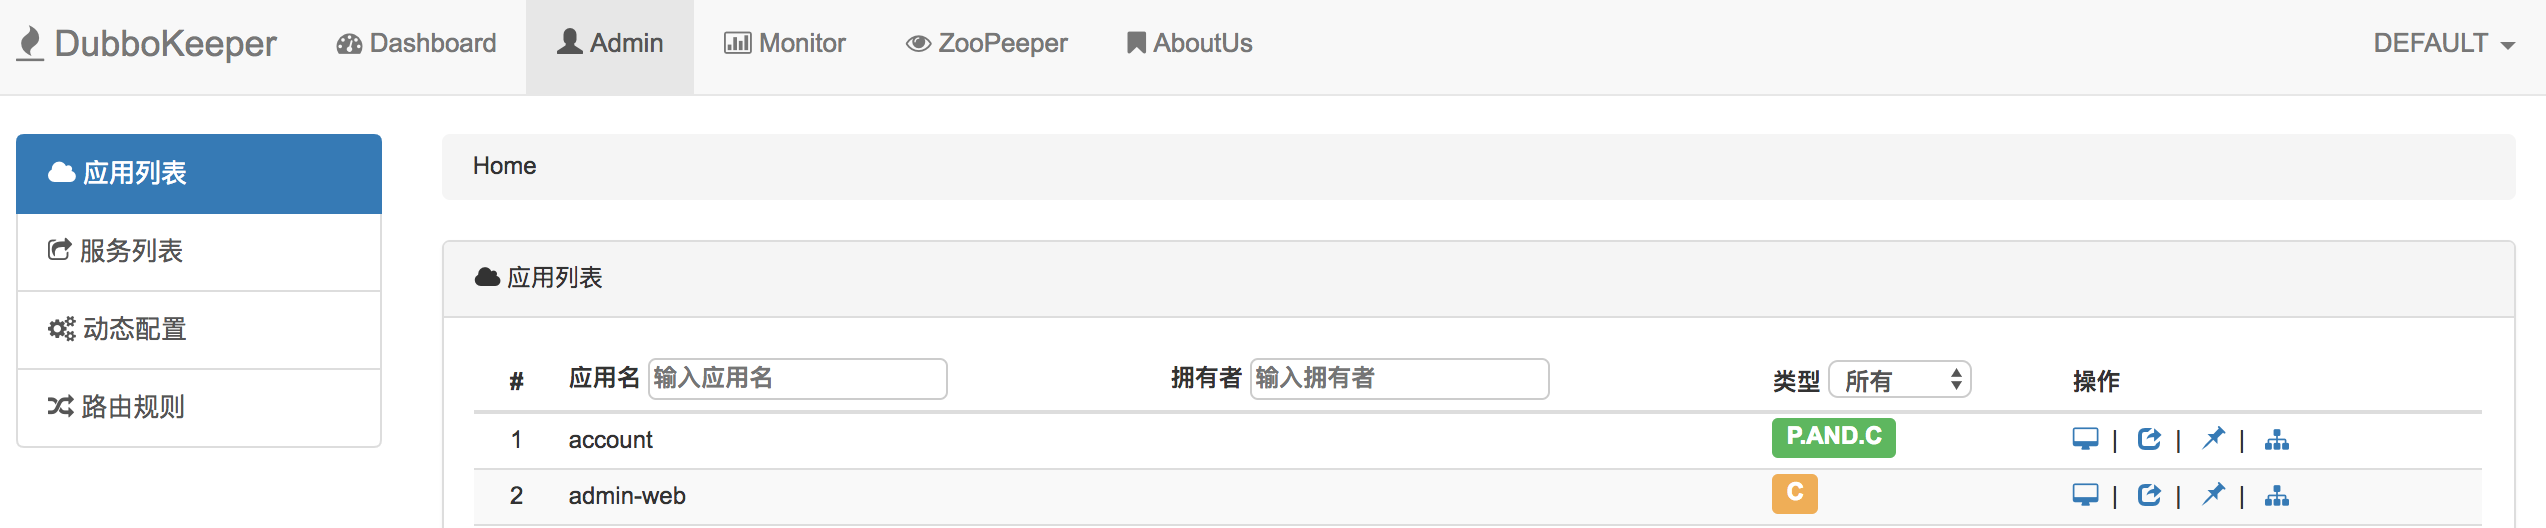
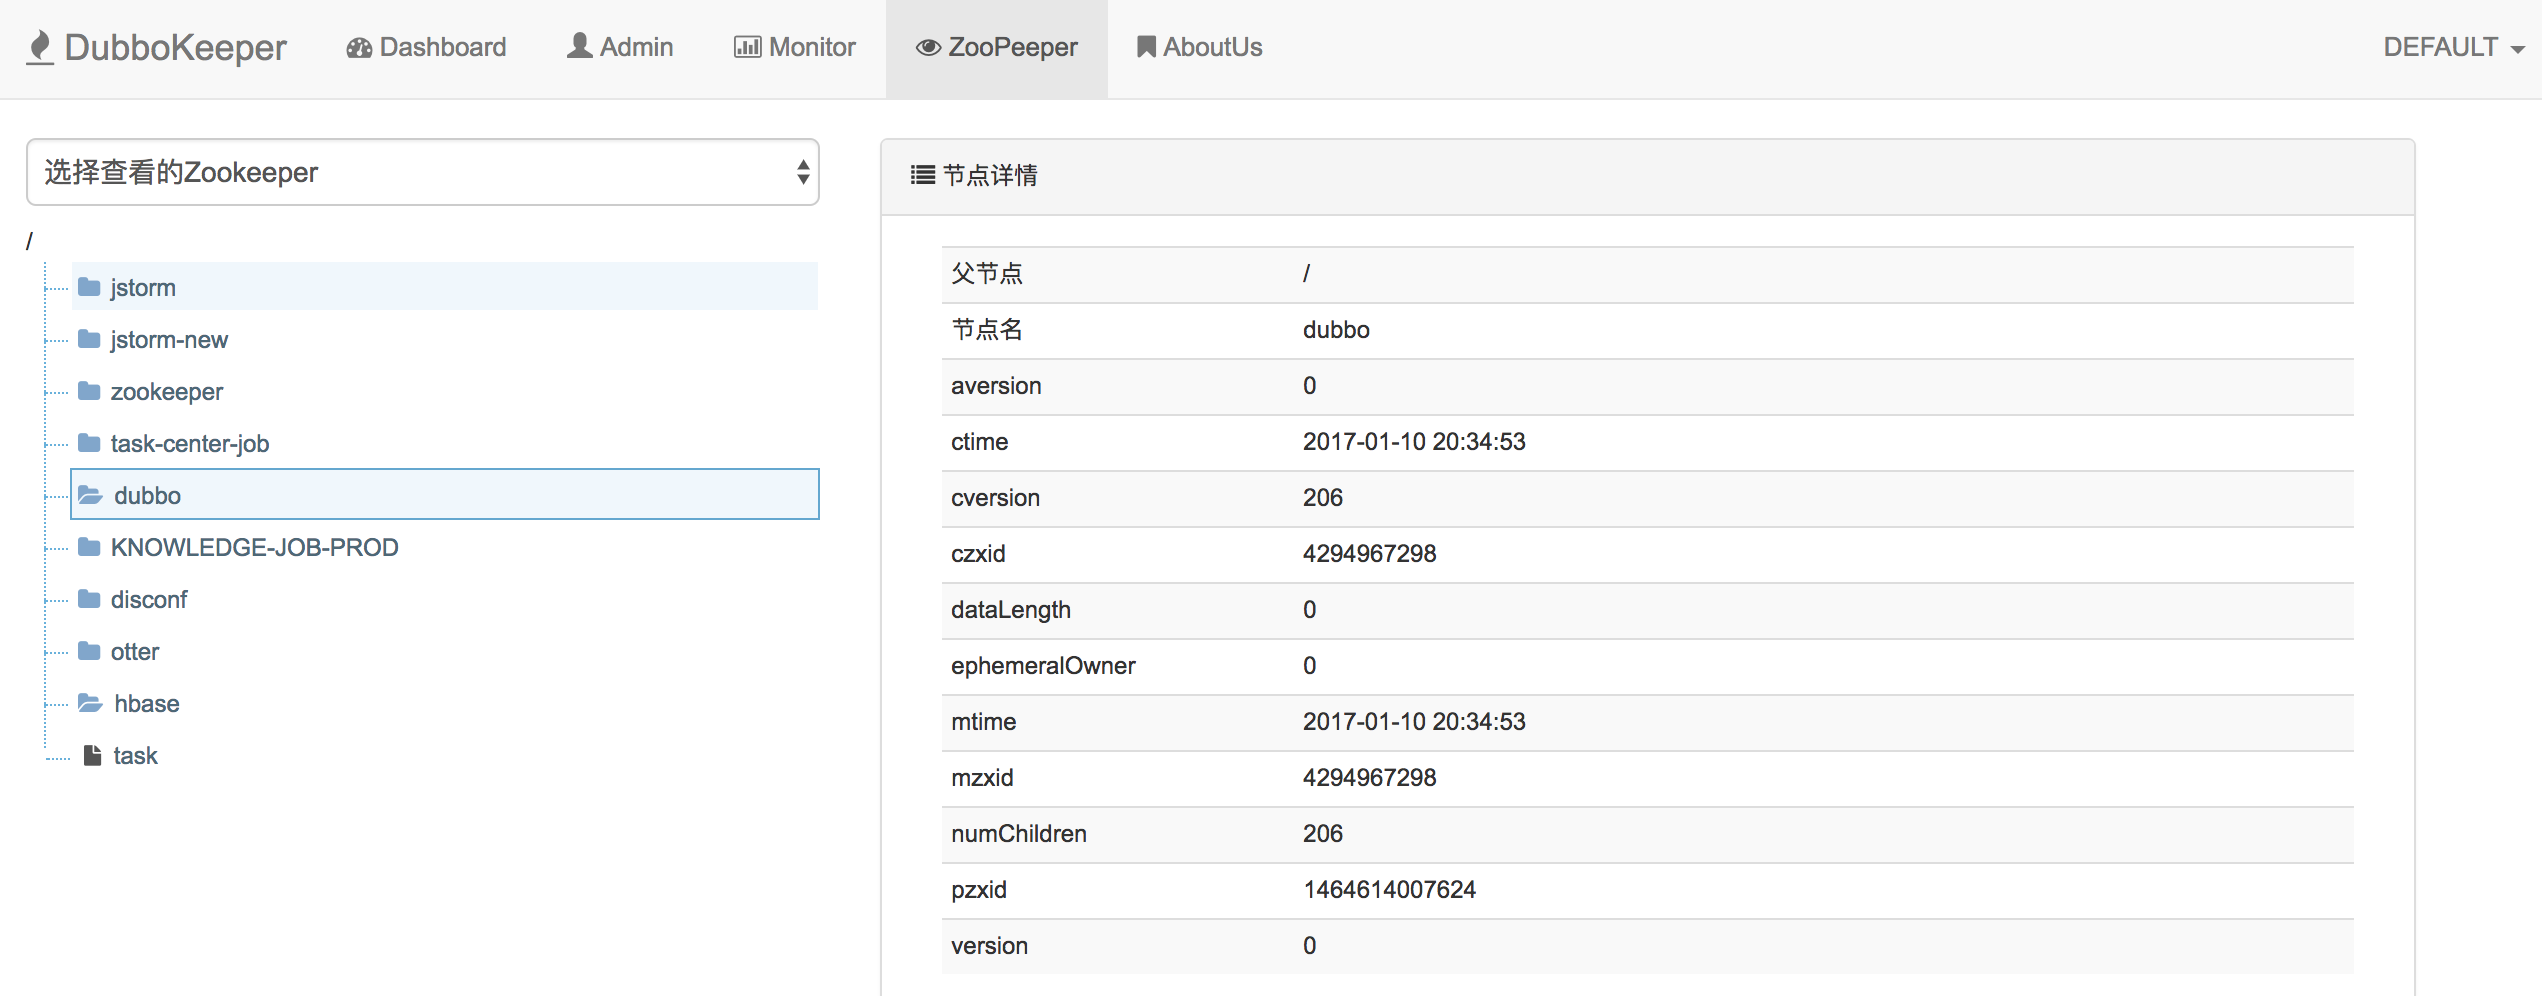
ZooPeeper可以查看zookeeper节点信息
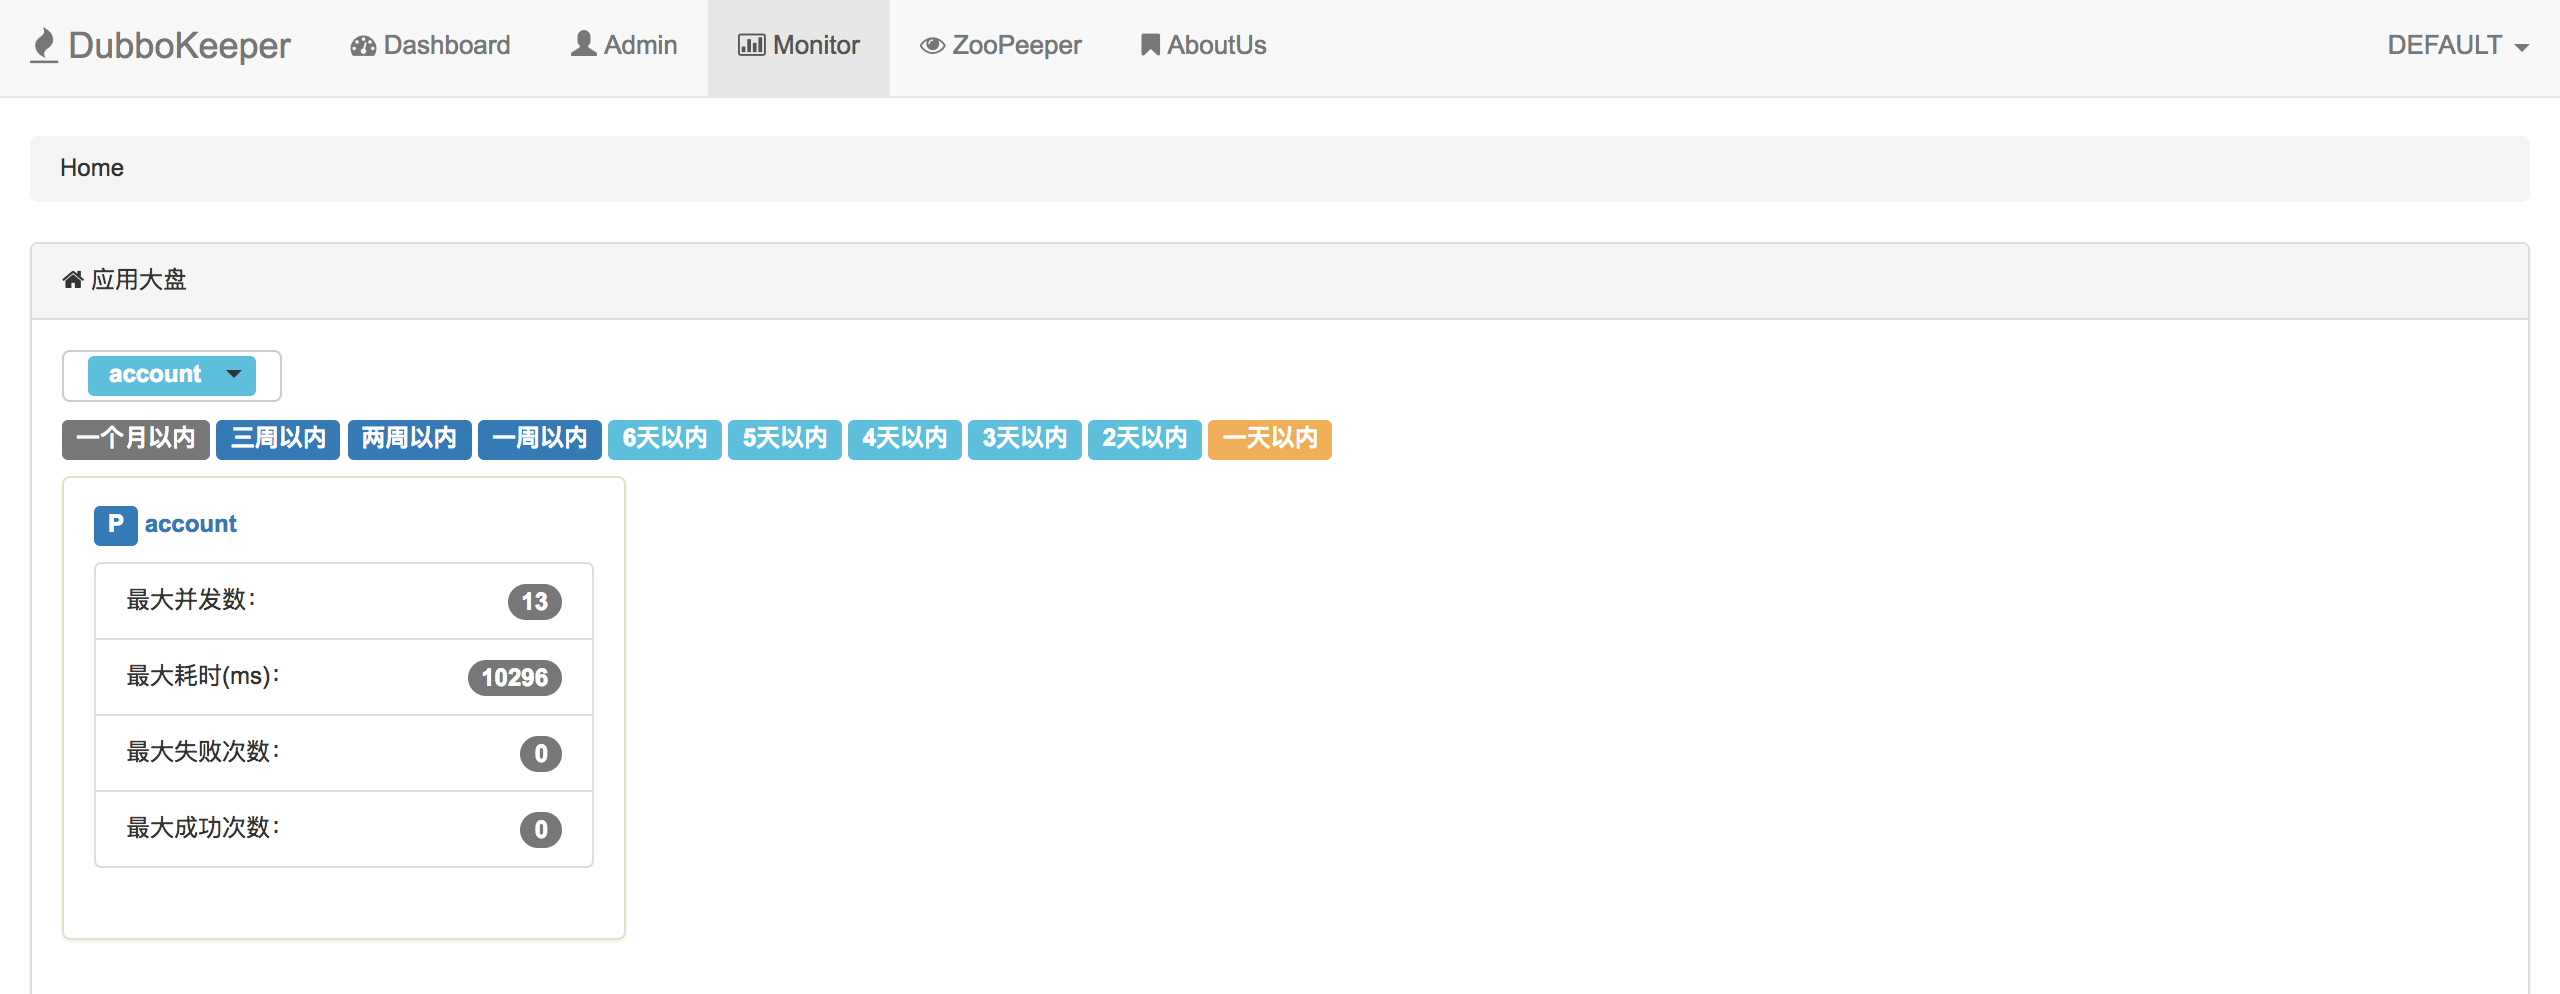
Monitor可以查看dubbo监控相关信息
应用总览信息,可根据时间筛选:
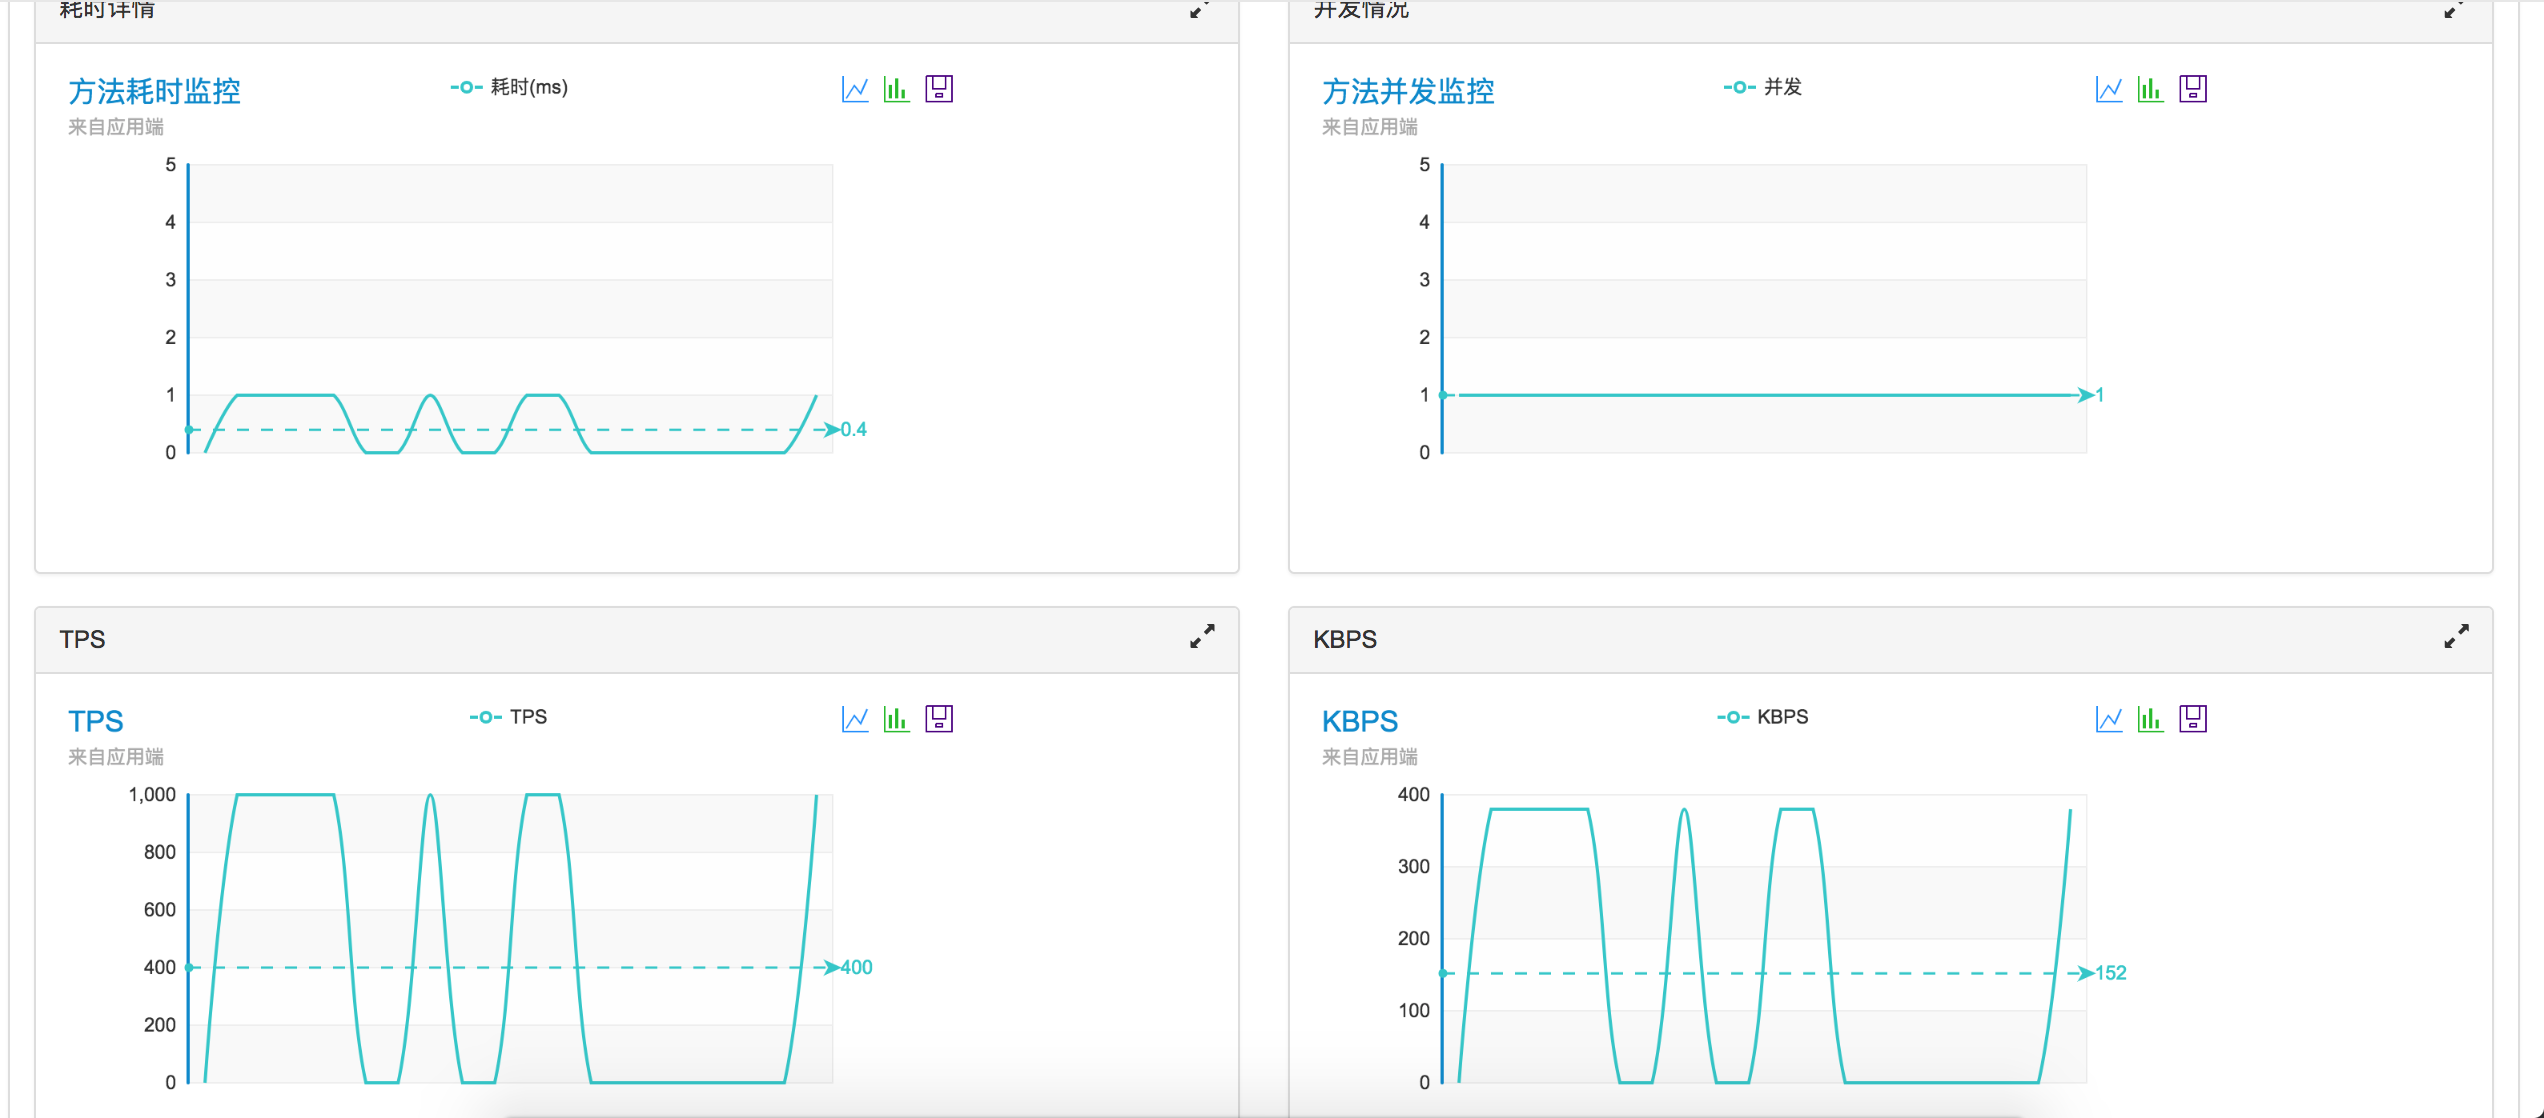
应用详细信息,有接口耗时、并发、失败、成功等数据:
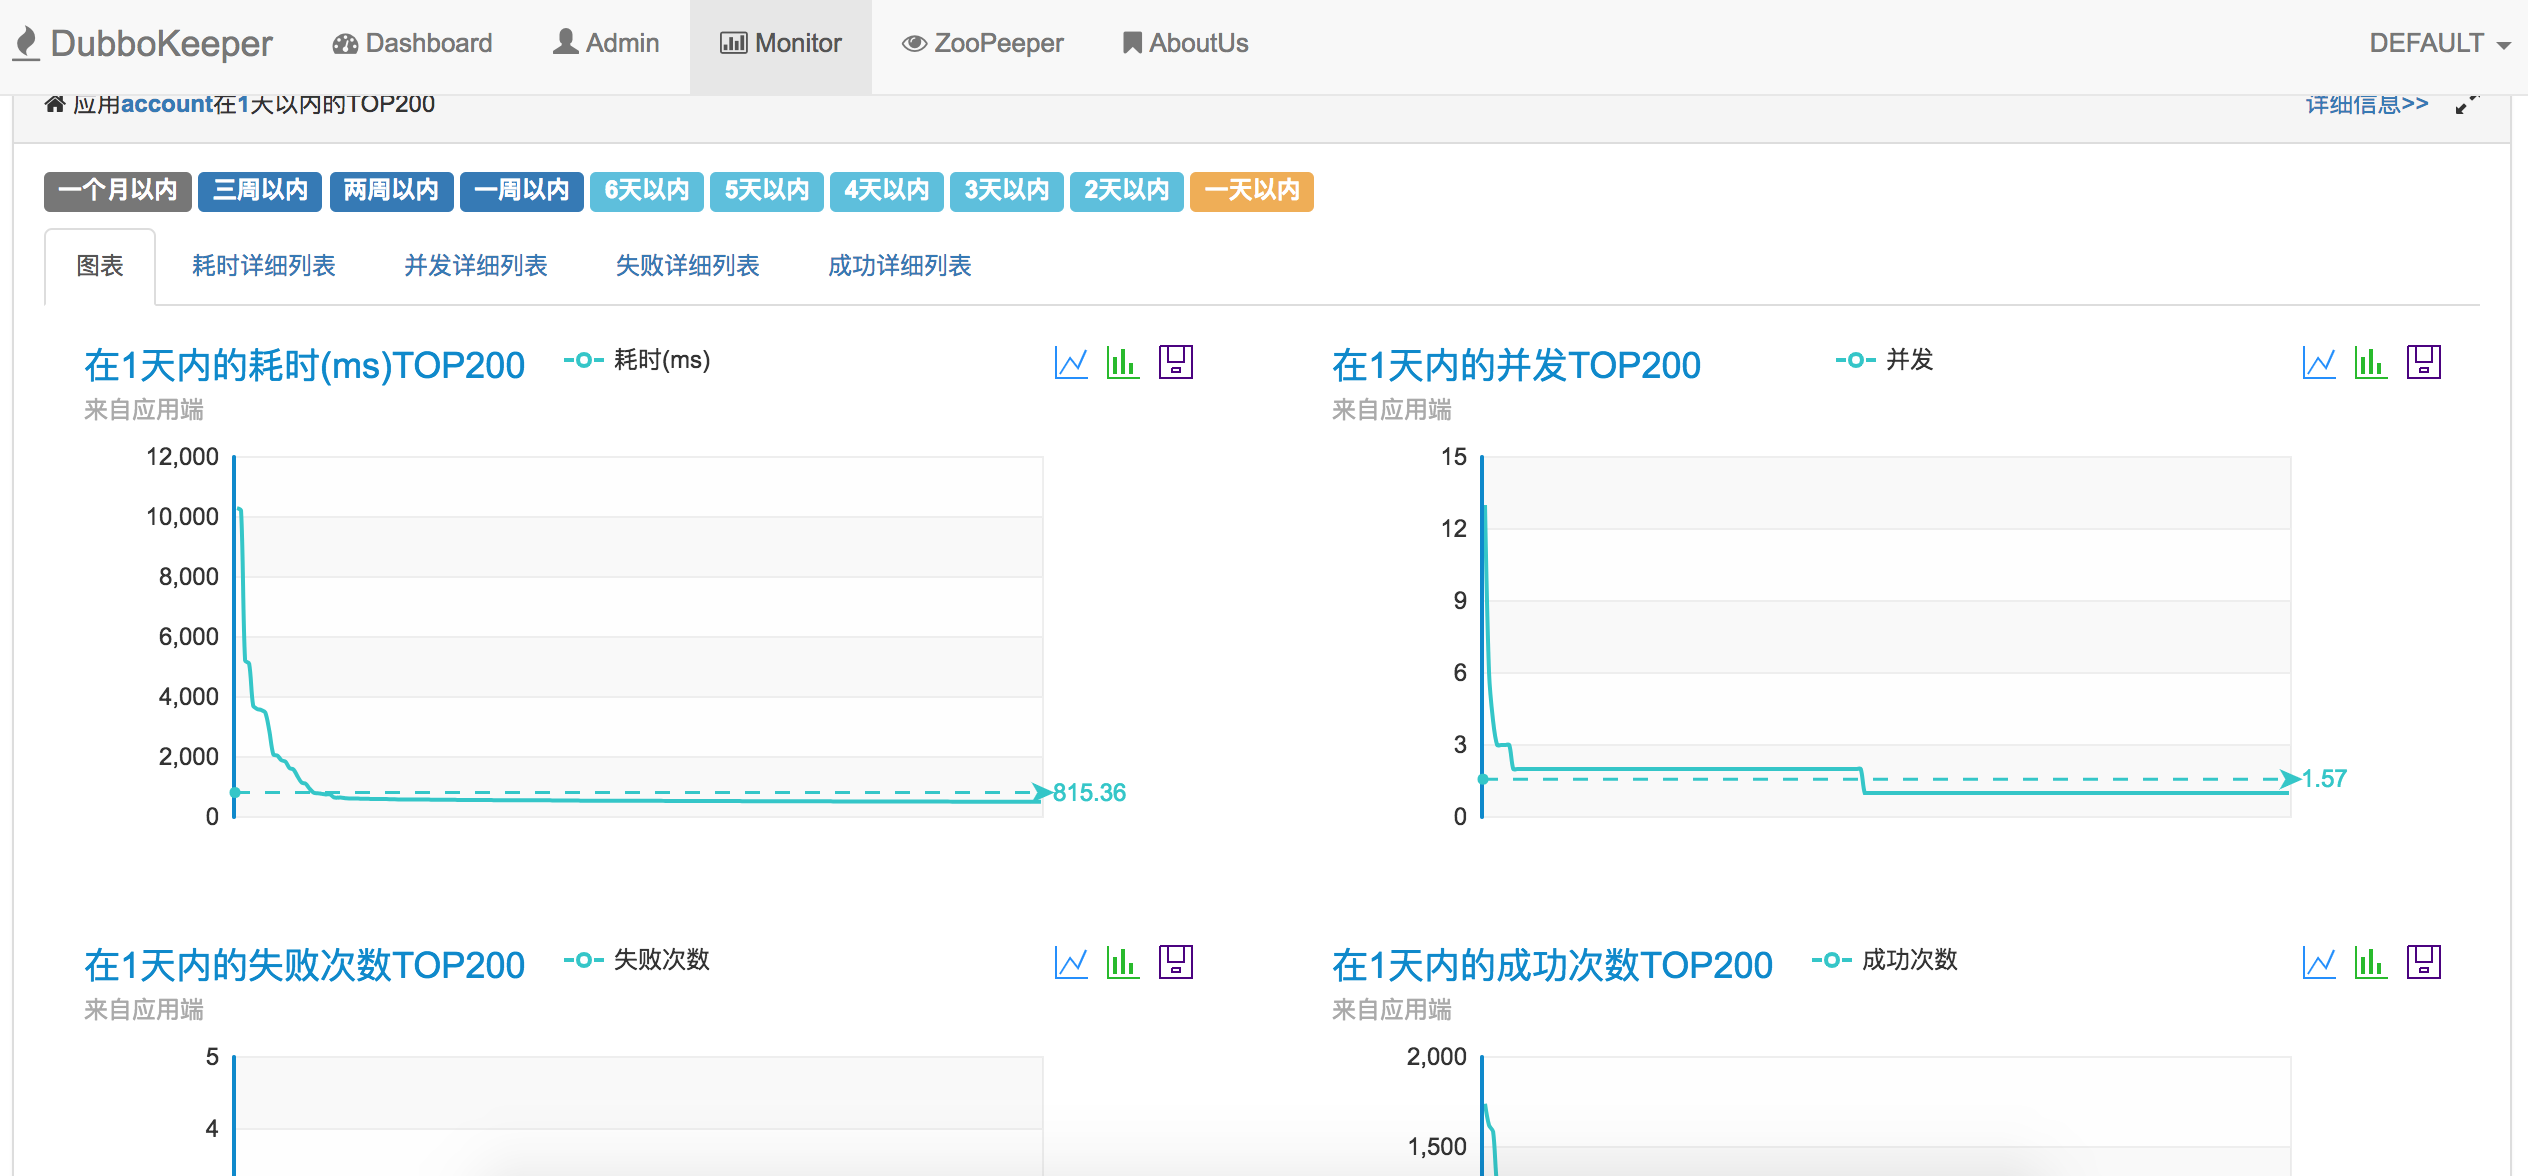
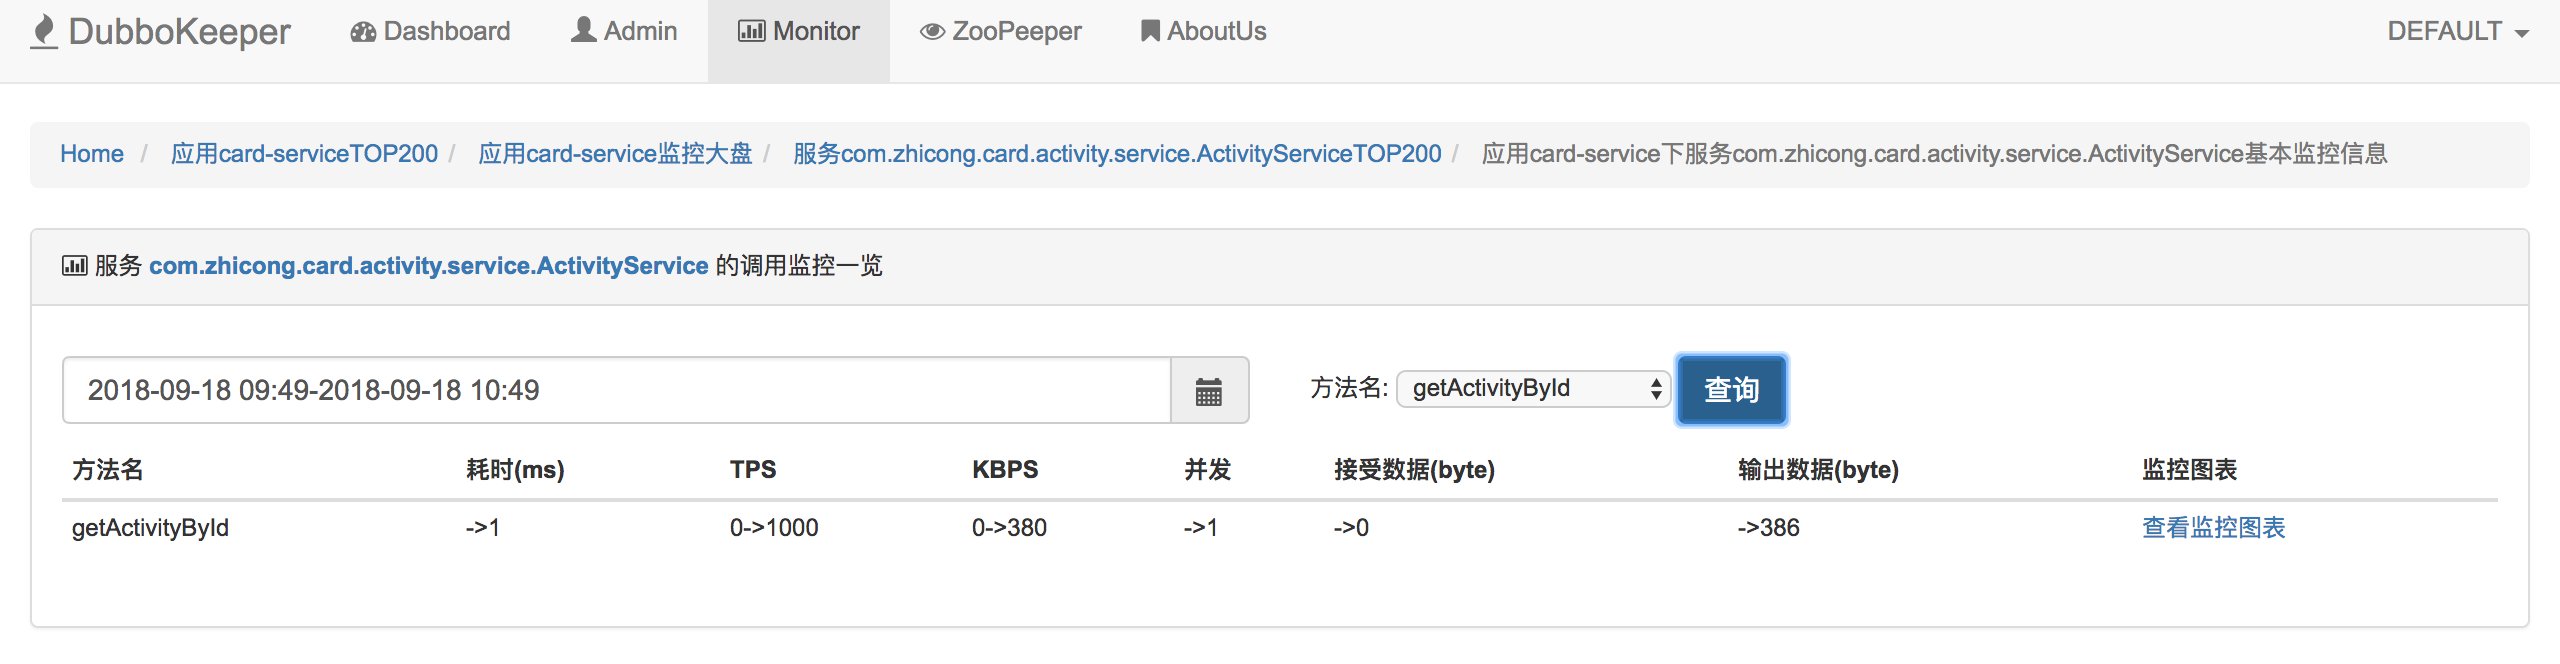
方法级别总览及详细信息:
1.5、遇到的坑
1、官方默认monitor.write.interval(存储周期)配置的是6000,阅读源码发现单位是秒,也就是默认配置100分钟才会写入mongodb,要把它改成60。
2、dubbokeeper默认没有对collections加索引,数据量大了之后打开会异常慢,所以需要自己通过脚本对collection加索引。
import pymongo
from pymongo import MongoClient
import time
import datetime
import sys
import os


client = MongoClient('127.0.0.1', 27017)
db = client['dubbokeeper']

collectionlist = db.collection_names()

for collection in collectionlist:
    if collection!='application':
        db[collection].ensure_index([("timestamp",pymongo.DESCENDING)])
        db[collection].ensure_index([("serviceInterface",pymongo.DESCENDING)])
        db[collection].ensure_index([("method",pymongo.DESCENDING)])
        db[collection].ensure_index([("serviceInterface",pymongo.DESCENDING),("method",pymongo.DESCENDING),("timestamp",pymongo.DESCENDING)])
        db[collection].ensure_index([("serviceInterface",pymongo.DESCENDING),("timestamp",pymongo.DESCENDING)])
        db[collection].ensure_index([("concurrent",pymongo.DESCENDING),("timestamp",pymongo.DESCENDING)])
        db[collection].ensure_index([("elapsed",pymongo.DESCENDING),("timestamp",pymongo.DESCENDING)])
        db[collection].ensure_index([("failureCount",pymongo.DESCENDING),("timestamp",pymongo.DESCENDING)])
        db[collection].ensure_index([("successCount",pymongo.DESCENDING),("timestamp",pymongo.DESCENDING)])
        db[collection].ensure_index([("serviceInterface",pymongo.DESCENDING),("elapsed",pymongo.DESCENDING),("timestamp",pymongo.DESCENDING)])
        db[collection].ensure_index([("serviceInterface",pymongo.DESCENDING),("concurrent",pymongo.DESCENDING),("timestamp",pymongo.DESCENDING)])
        db[collection].ensure_index([("serviceInterface",pymongo.DESCENDING),("failureCount",pymongo.DESCENDING),("timestamp",pymongo.DESCENDING)])
        db[collection].ensure_index([("serviceInterface",pymongo.DESCENDING),("successCount",pymongo.DESCENDING),("timestamp",pymongo.DESCENDING)])

print 'success'
3、一般历史数据基本不用保存太久,目前我们线上保留2周数据,提供了以下脚本定期删除数据。
import pymongo
from pymongo import MongoClient
import time
import datetime
import sys
import os

day=int(sys.argv[1])
print day
timestamp = time.time()*1000-1000*24*3600*day

print timestamp

client = MongoClient('127.0.0.1', 27017)
db = client['dubbokeeper']

collectionlist = db.collection_names()

for collection in collectionlist:
    if collection!='application':
        db[collection].remove({"timestamp": {"$lt": timestamp}})

print 'clean mongodb data success'
每天定时清理15天的数据
0 3 * * * python /home/monitor/shell/clean-mongodb.py 15
4、mongodb缓存比较吃内存,最好配置8G以上的服务器,或者量大可以考虑集群部署
5、dubbokeeper-ui原生交互有点坑,有些页面会遍历展示所有应用的数据,效率比较低下。如果应用过多可能会超时打不开,服务端团队对交互进行了简单优化,每次只能查看一个应用或一个接口,如果大家有需求可以留言,我们后续会开源出来。
2、应用性能监控(APM)
2.1、主要目标
考虑接入应用性能监控主要想解决以下问题:
- 分布式链路追踪
- 应用级别性能监控(jvm等)
- 低侵入
2.2、选型
| 方案 | cat | zipkin | pinpoint | skywalking |
|---|---|---|---|---|
| 依赖 | Java 6 7 8、Maven 3+ MySQL 5.6 5.7、Linux 2.6+ hadoop可选 | Java 6,7,8 Maven3.2+ rabbitMQ | Java 6,7,8 maven3+ Hbase0.94+ | Java 6,7,8 maven3.0+ nodejs zookeeper elasticsearch |
| 实现方式 | 代码埋点(拦截器,注解,过滤器等) | 拦截请求,发送(HTTP,mq)数据至zipkin服务 | java探针,字节码增强 | java探针,字节码增强 |
| 存储 | mysql , hdfs | in-memory , mysql , Cassandra , Elasticsearch | HBase | elasticsearch , H2 |
| jvm监控 | 不支持 | 不支持 | 支持 | 支持 |
| trace查询 | 支持 | 支持 | 需要二次开发 | 支持 |
| stars | 5.5k | 9.1k | 6.5k | 4k |
| 侵入 | 高,需要埋点 | 高,需要开发 | 低 | 低 |
| 部署成本 | 中 | 中 | 较高 | 低 |
基于对应用尽可能的低侵入考虑,以上方案选型优先级pinpoint>skywalking>zipkin>cat。
2.3、原理
基于我们的选型,重点关注pinpoint和skywalking。
2.3.1 google dapper 主流的分布式调用链跟踪技术大都和google dapper相似。简单介绍下dapper原理:
span 基本工作单元,一次链路调用(可以是RPC,DB等没有特定的限制)创建一个span,通过一个64位ID标识它,uuid较为方便,span中还有其他的数据,例如描述信息,时间戳,key-value对的(Annotation)tag信息,parent_id等,其中parent-id可以表示span调用链路来源。
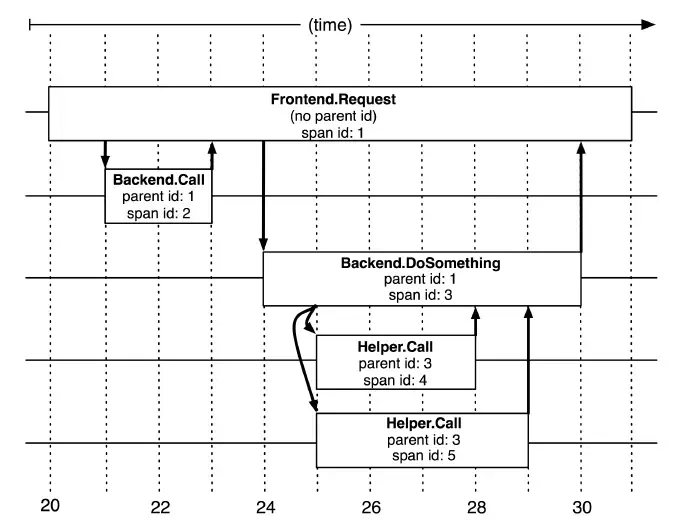
上图说明了span在一次大的跟踪过程中是什么样的。Dapper记录了span名称,以及每个span的ID和父ID,以重建在一次追踪过程中不同span之间的关系。如果一个span没有父ID被称为root span。所有span都挂在一个特定的跟踪上,也共用一个跟踪id。 trace 类似于 树结构的Span集合,表示一次完整的跟踪,从请求到服务器开始,服务器返回response结束,跟踪每次rpc调用的耗时,存在唯一标识trace_id。比如:你运行的分布式大数据存储一次Trace就由你的一次请求组成。
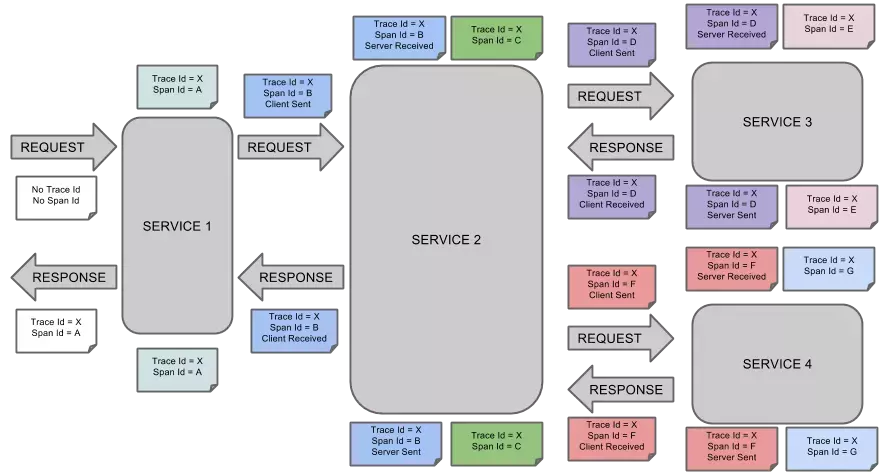
每种颜色的note标注了一个span,一条链路通过TraceId唯一标识,Span标识发起的请求信息。树节点是整个架构的基本单元,而每一个节点又是对span的引用。节点之间的连线表示的span和它的父span直接的关系。
整体部署结构:
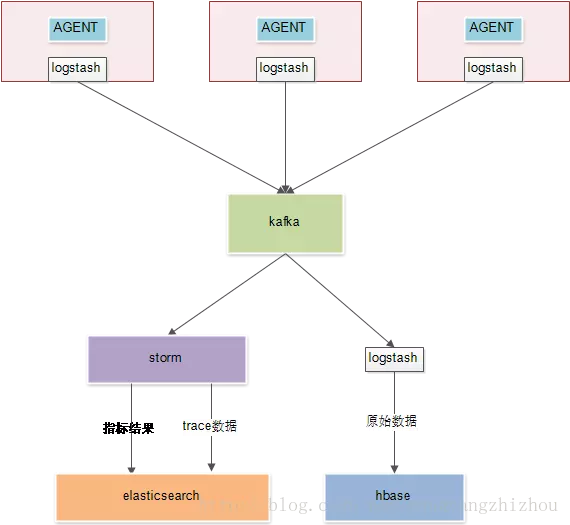
- 通过AGENT生成调用链日志。
- 通过logstash采集日志到kafka。
- kafka负责提供数据给下游消费。
- storm计算汇聚指标结果并落到es。
- storm抽取trace数据并落到es,这是为了提供比较复杂的查询。比如通过时间维度查询调用链,可以很快查询出所有符合的traceID,根据这些traceID再去 Hbase 查数据就快了。
- logstash将kafka原始数据拉取到hbase中。hbase的rowkey为traceID,根据traceID查询是很快的。
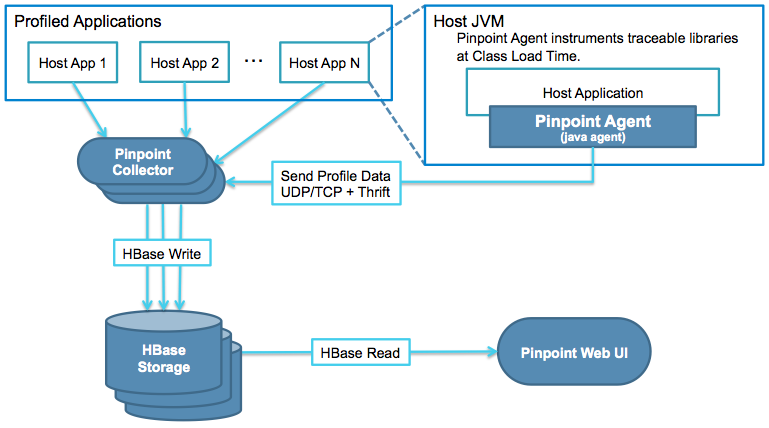
2.3.2 pinpoint
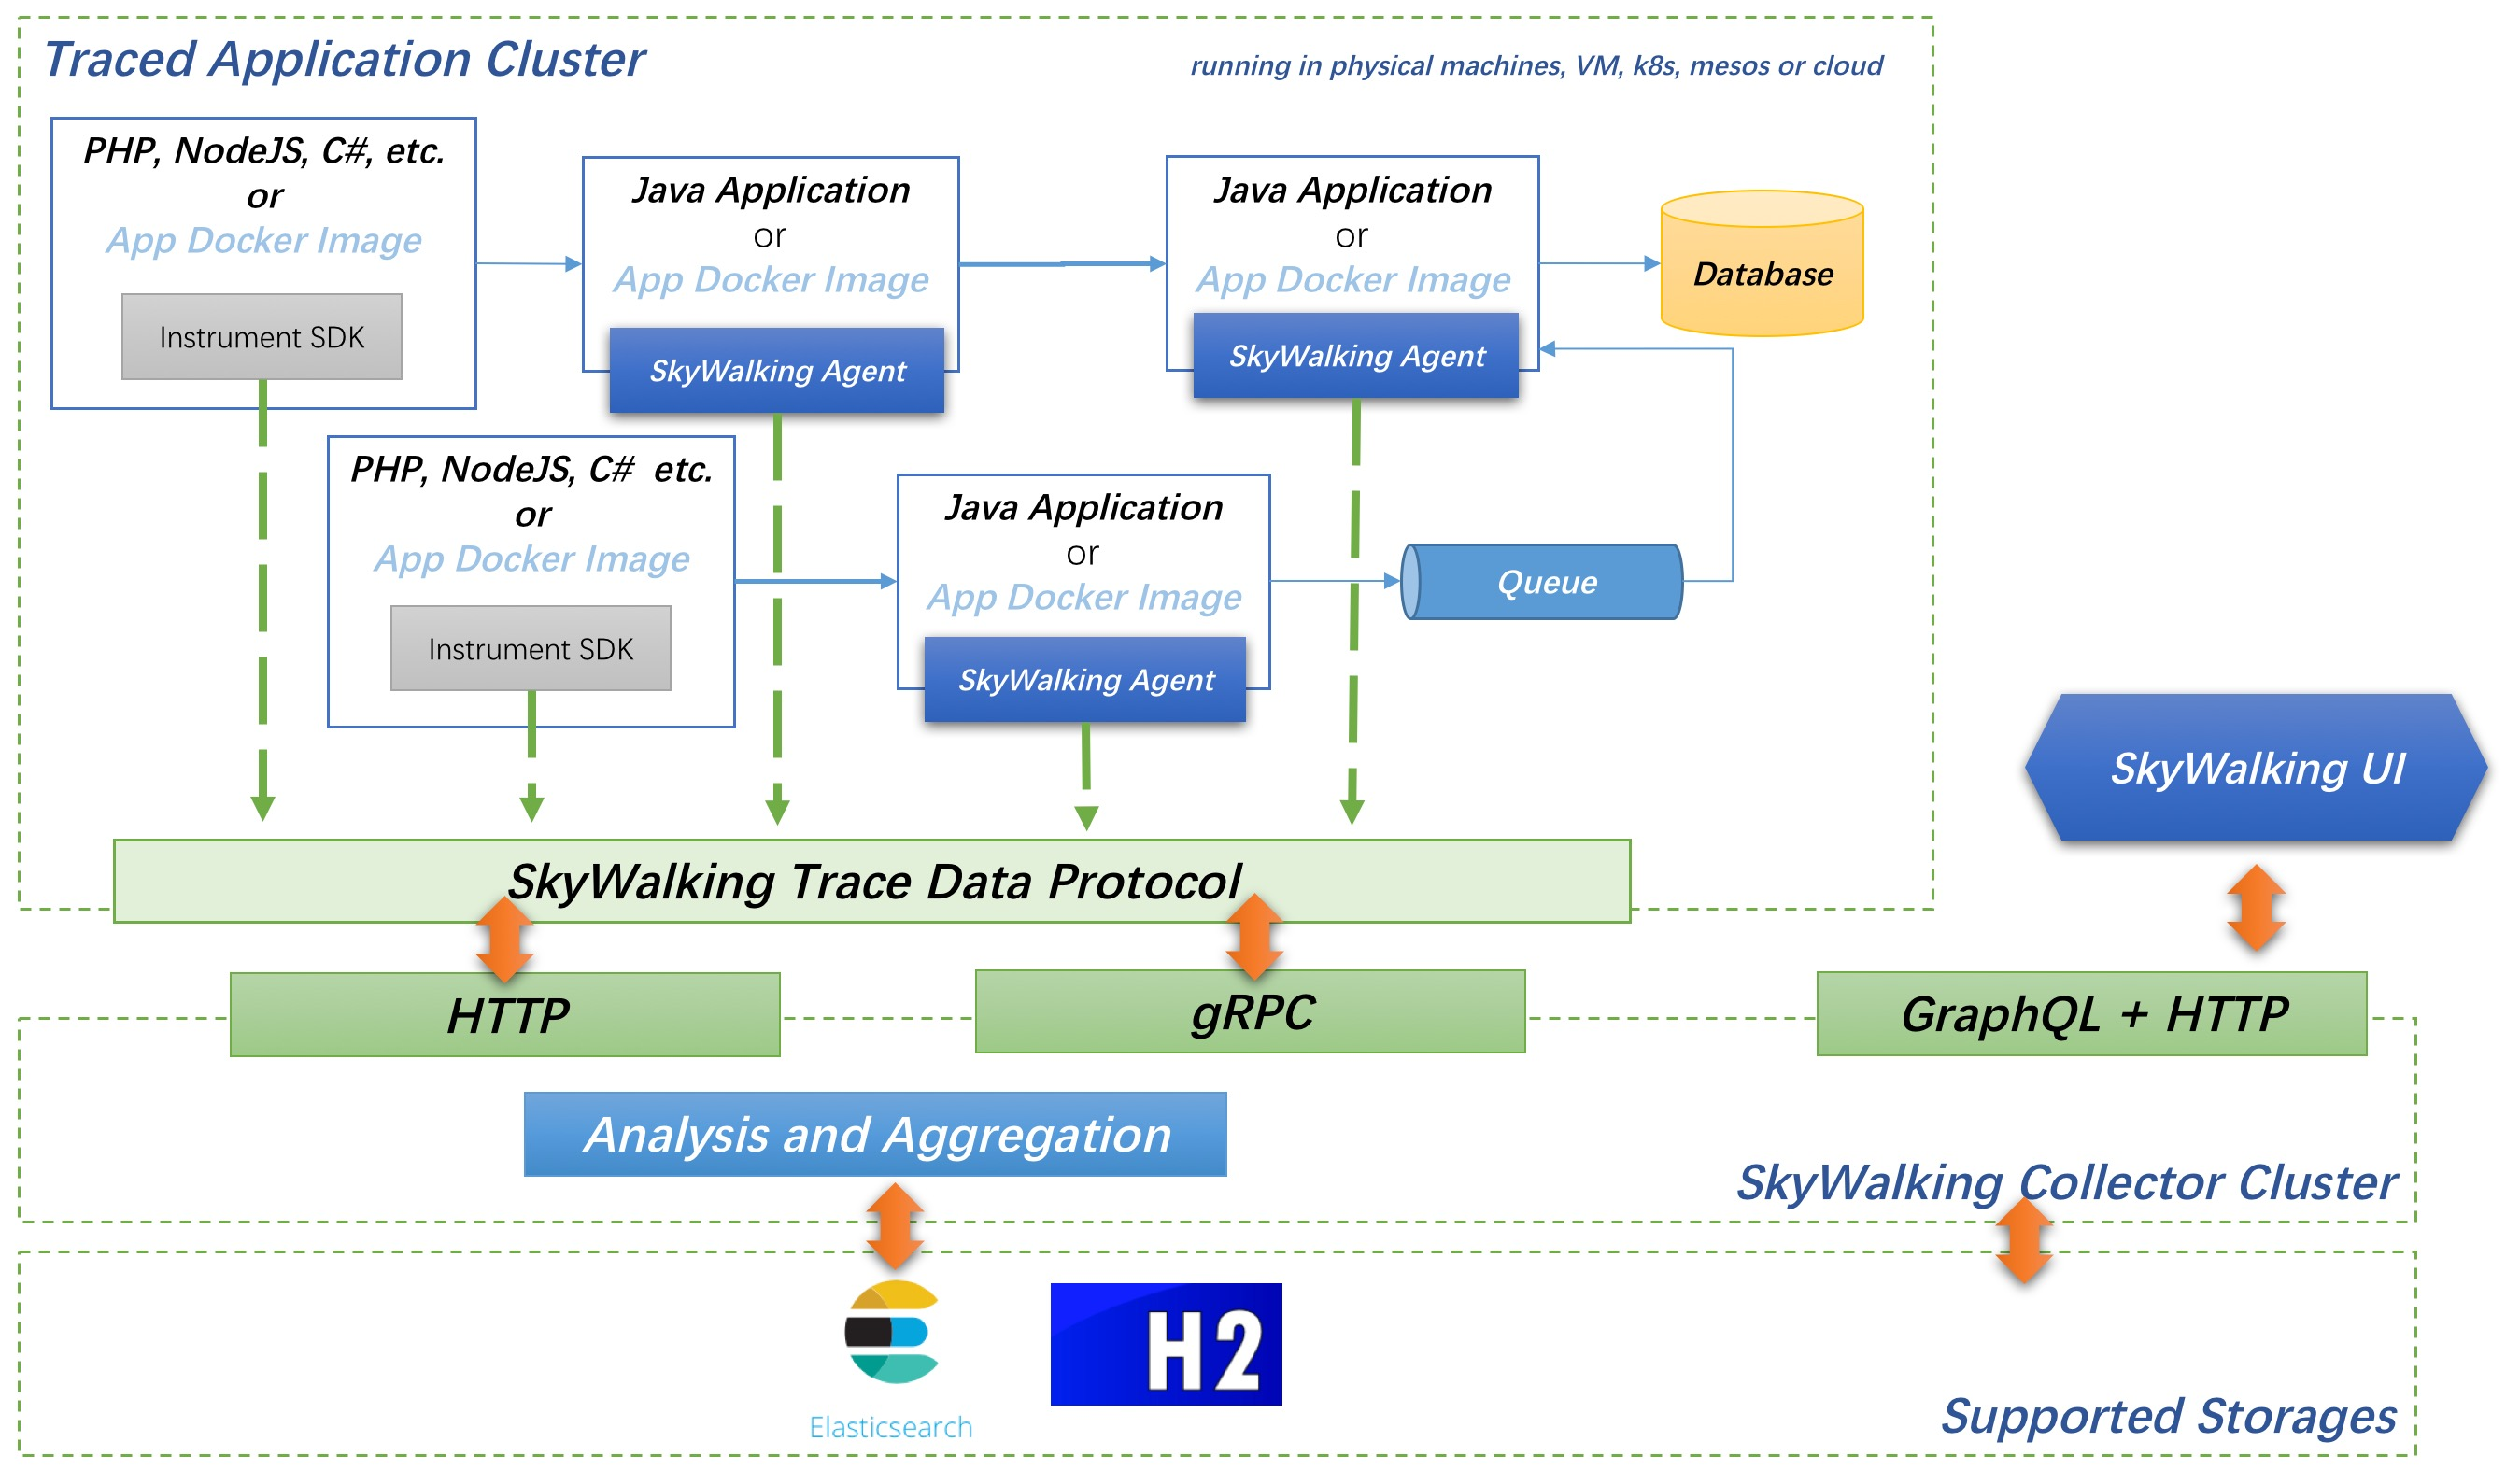
2.3.3 skywalking
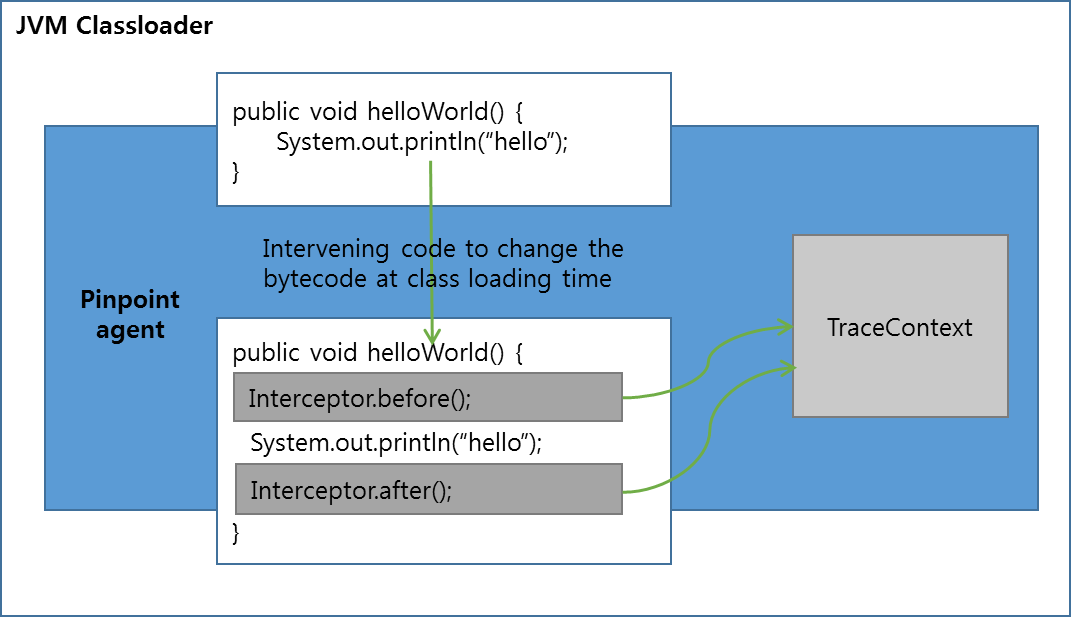
以上几种方案数据采集端都采用了字节码增强技术,原理如下:
2.4、部署
下面重点介绍pinpoint部署,目前我们线上是集群部署,整体架构如下:
| 机器 | 部署应用 |
|---|---|
| master | zookeeper,hadoop,hbase,pinpoint-collector |
| node1 | zookeeper,hadoop,hbase |
| node2 | zookeeper,nginx,hadoop,hbase,pinpoint-web,pinpoint-collector |
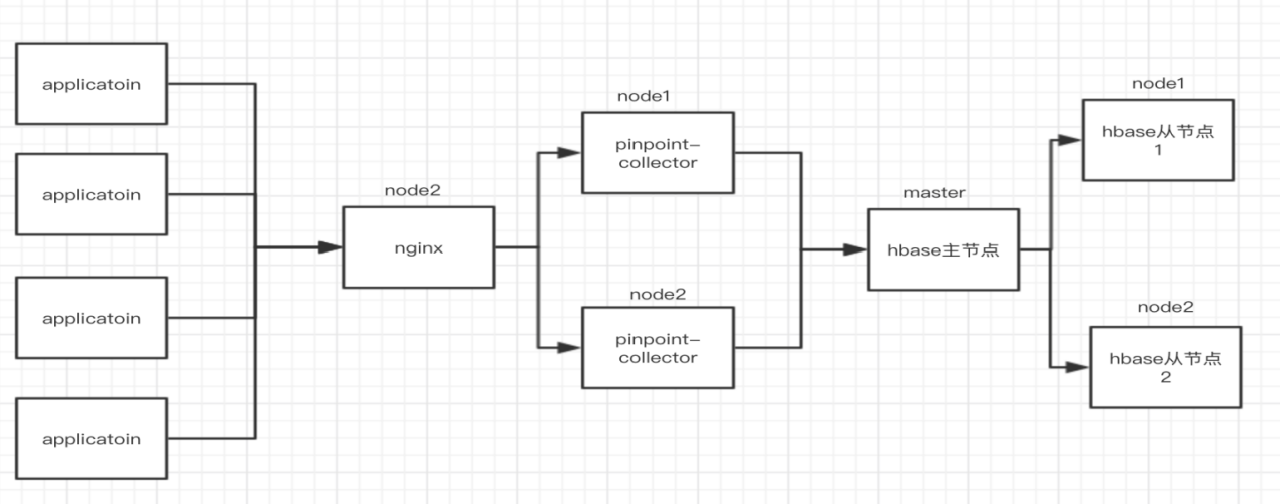
搭建pinpoint线上用了三台服务器,master、node1、node2。应用数据采集端agent-client将采集到的数据通过udp发送到部署在node2的nginx,通过负载均衡分流到两台pinpoint-collector服务器,落库通过hadoop集群master节点负载均衡到两台hbase服务器上。
2.4.1 编译
pinpoint编译条件比较苛刻,需要jdk6,7,8环境。
2.4.2 hbase
集群部署,需要先搭建hadoop集群,hbase集群。搭建完成后初始化表,执行 ./hbase shell /pinpoint-1.7.2/hbase/scripts/hbase-create.hbase,可以根据自己对历史数据的需求设置表的ttl时间。
2.4.3 pinpoint-web
/pinpoint-1.7.2/web/target/pinpoint-web-1.7.2.war拷贝到tomcat webapps目录下 修改tomcat目录/webapps/pinpoint-web-1.7.2/WEB-INF/classes/hbase.properties hbase配置启动
2.4.4 pinpoint-collector
/pinpoint-1.7.2/collector/target/pinpoint-collector-1.7.2.war拷贝到tomcat webapps目录下,修改tomcat目录/webapps/pinpoint-collector-1.7.2/WEB-INF/classes/hbase.properties和pinpoint-collector.properties配置并启动
2.4.5 agent
将/pinpoint-1.7.2/agent整个目录拷贝到应用服务器指定目录下修改/agent/target/pinpoint-agent-1.7.2/pinpoint.config配置业务应用启动时增加参数-javaagent:/root/agent/target/pinpoint-agent-1.7.2/pinpoint-bootstrap-1.7.2.jar -Dpinpoint.agentId=application01 -Dpinpoint.applicationName=application
具体集群部署可以参考: blog.csdn.net/yue530tomto…
需要注意: 默认配置的日志级别是DEBUG,会产生海量日志,要将其修改成INFO级别
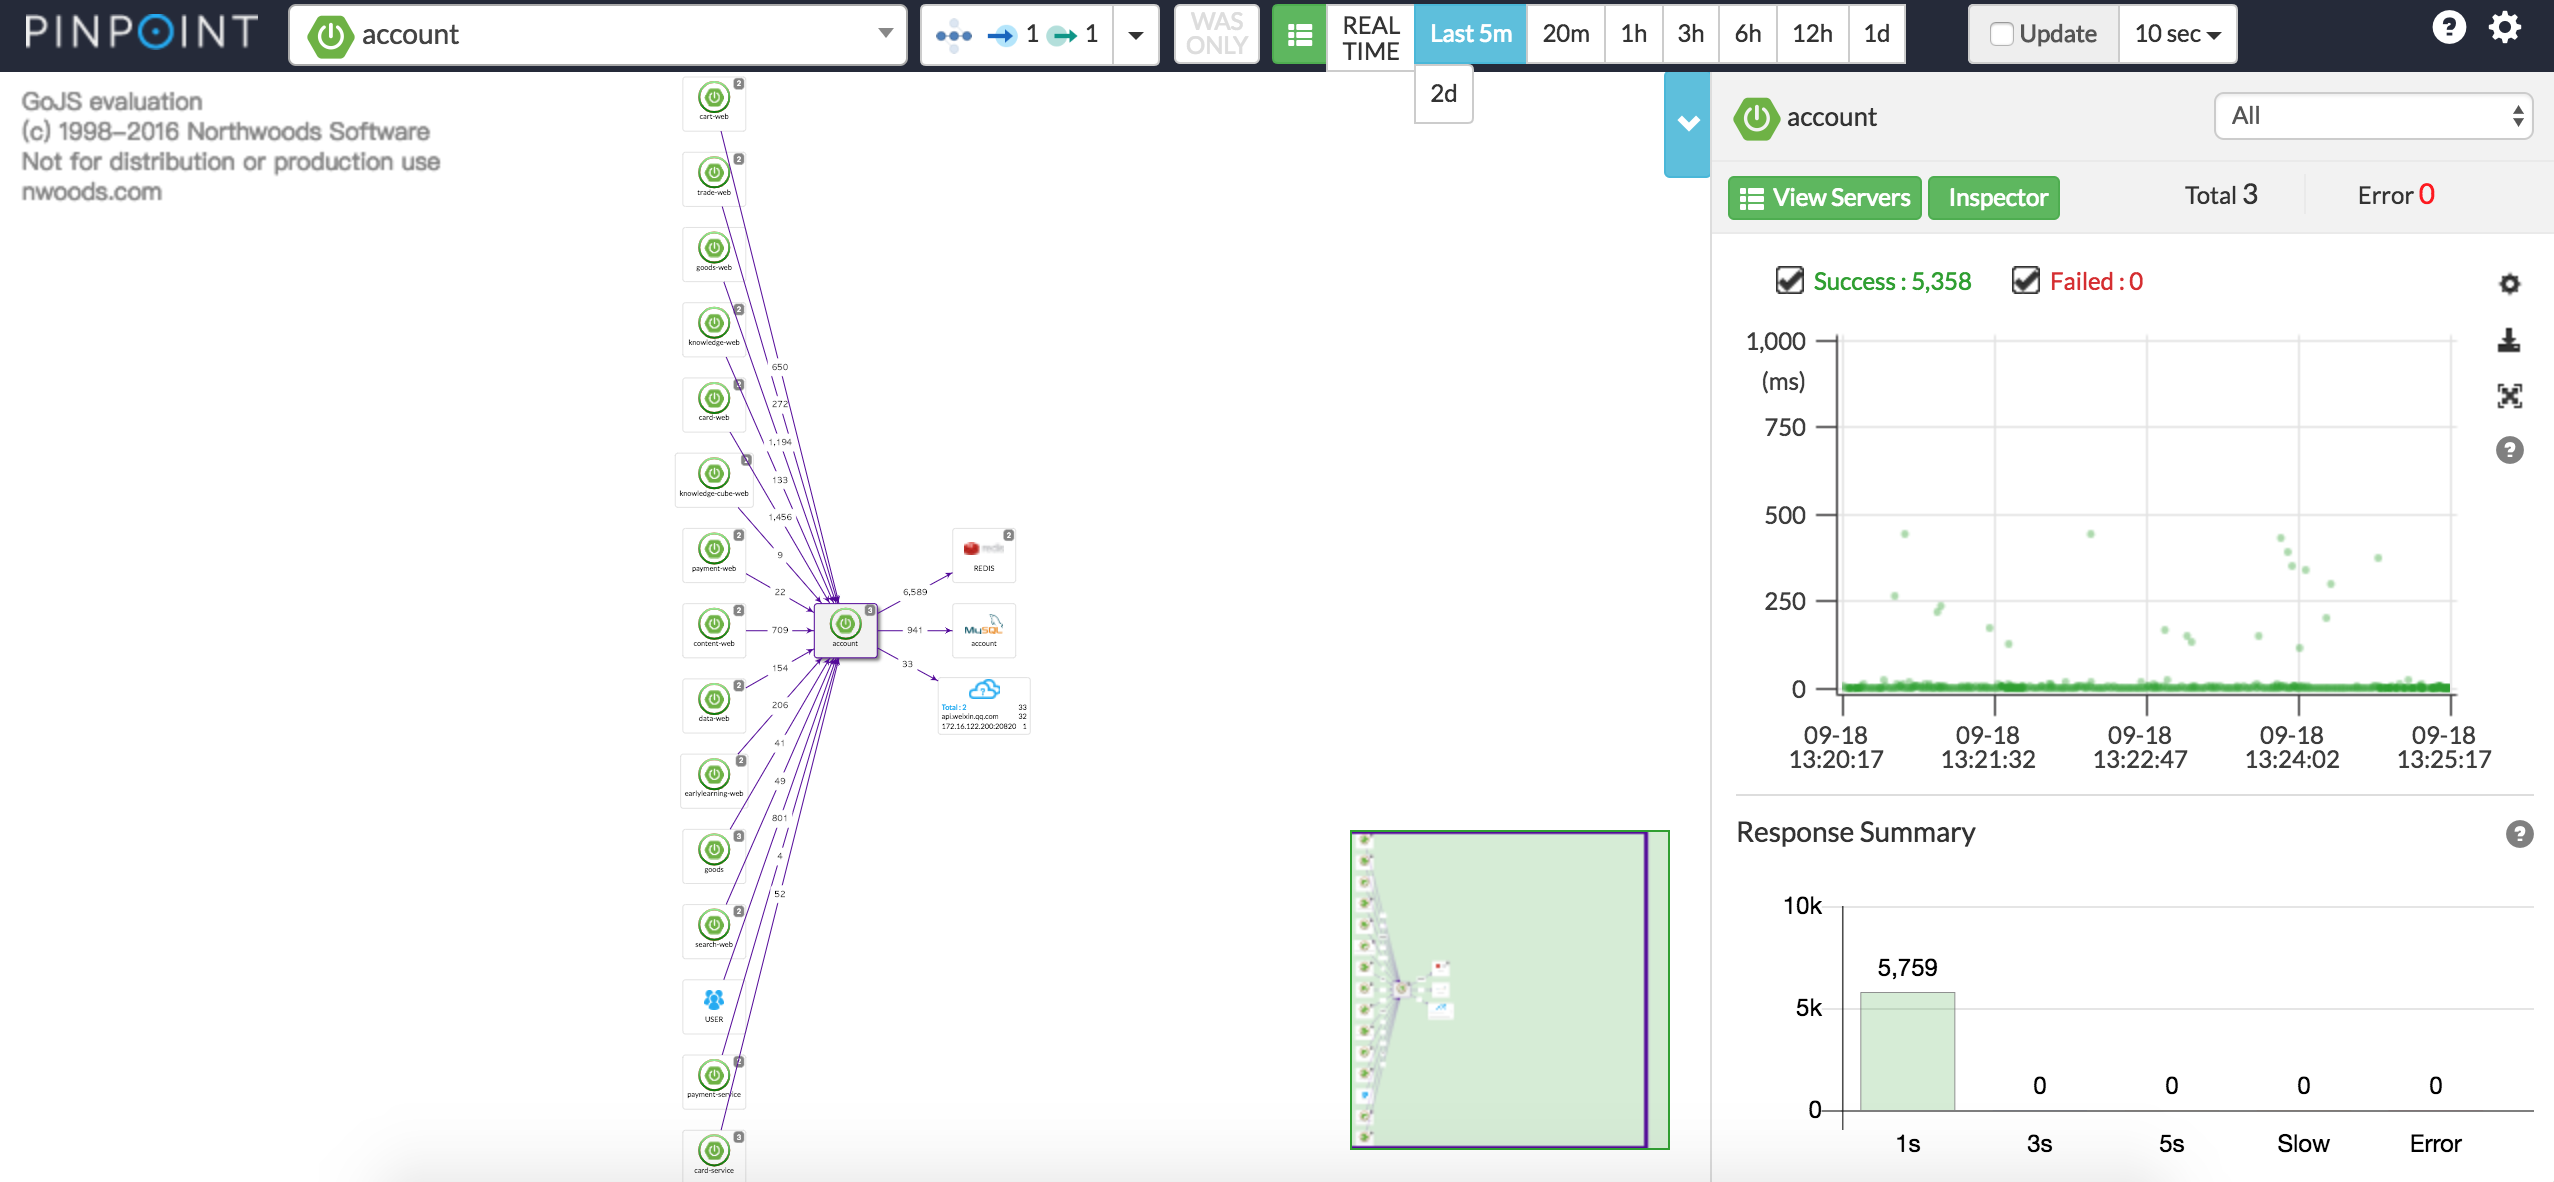
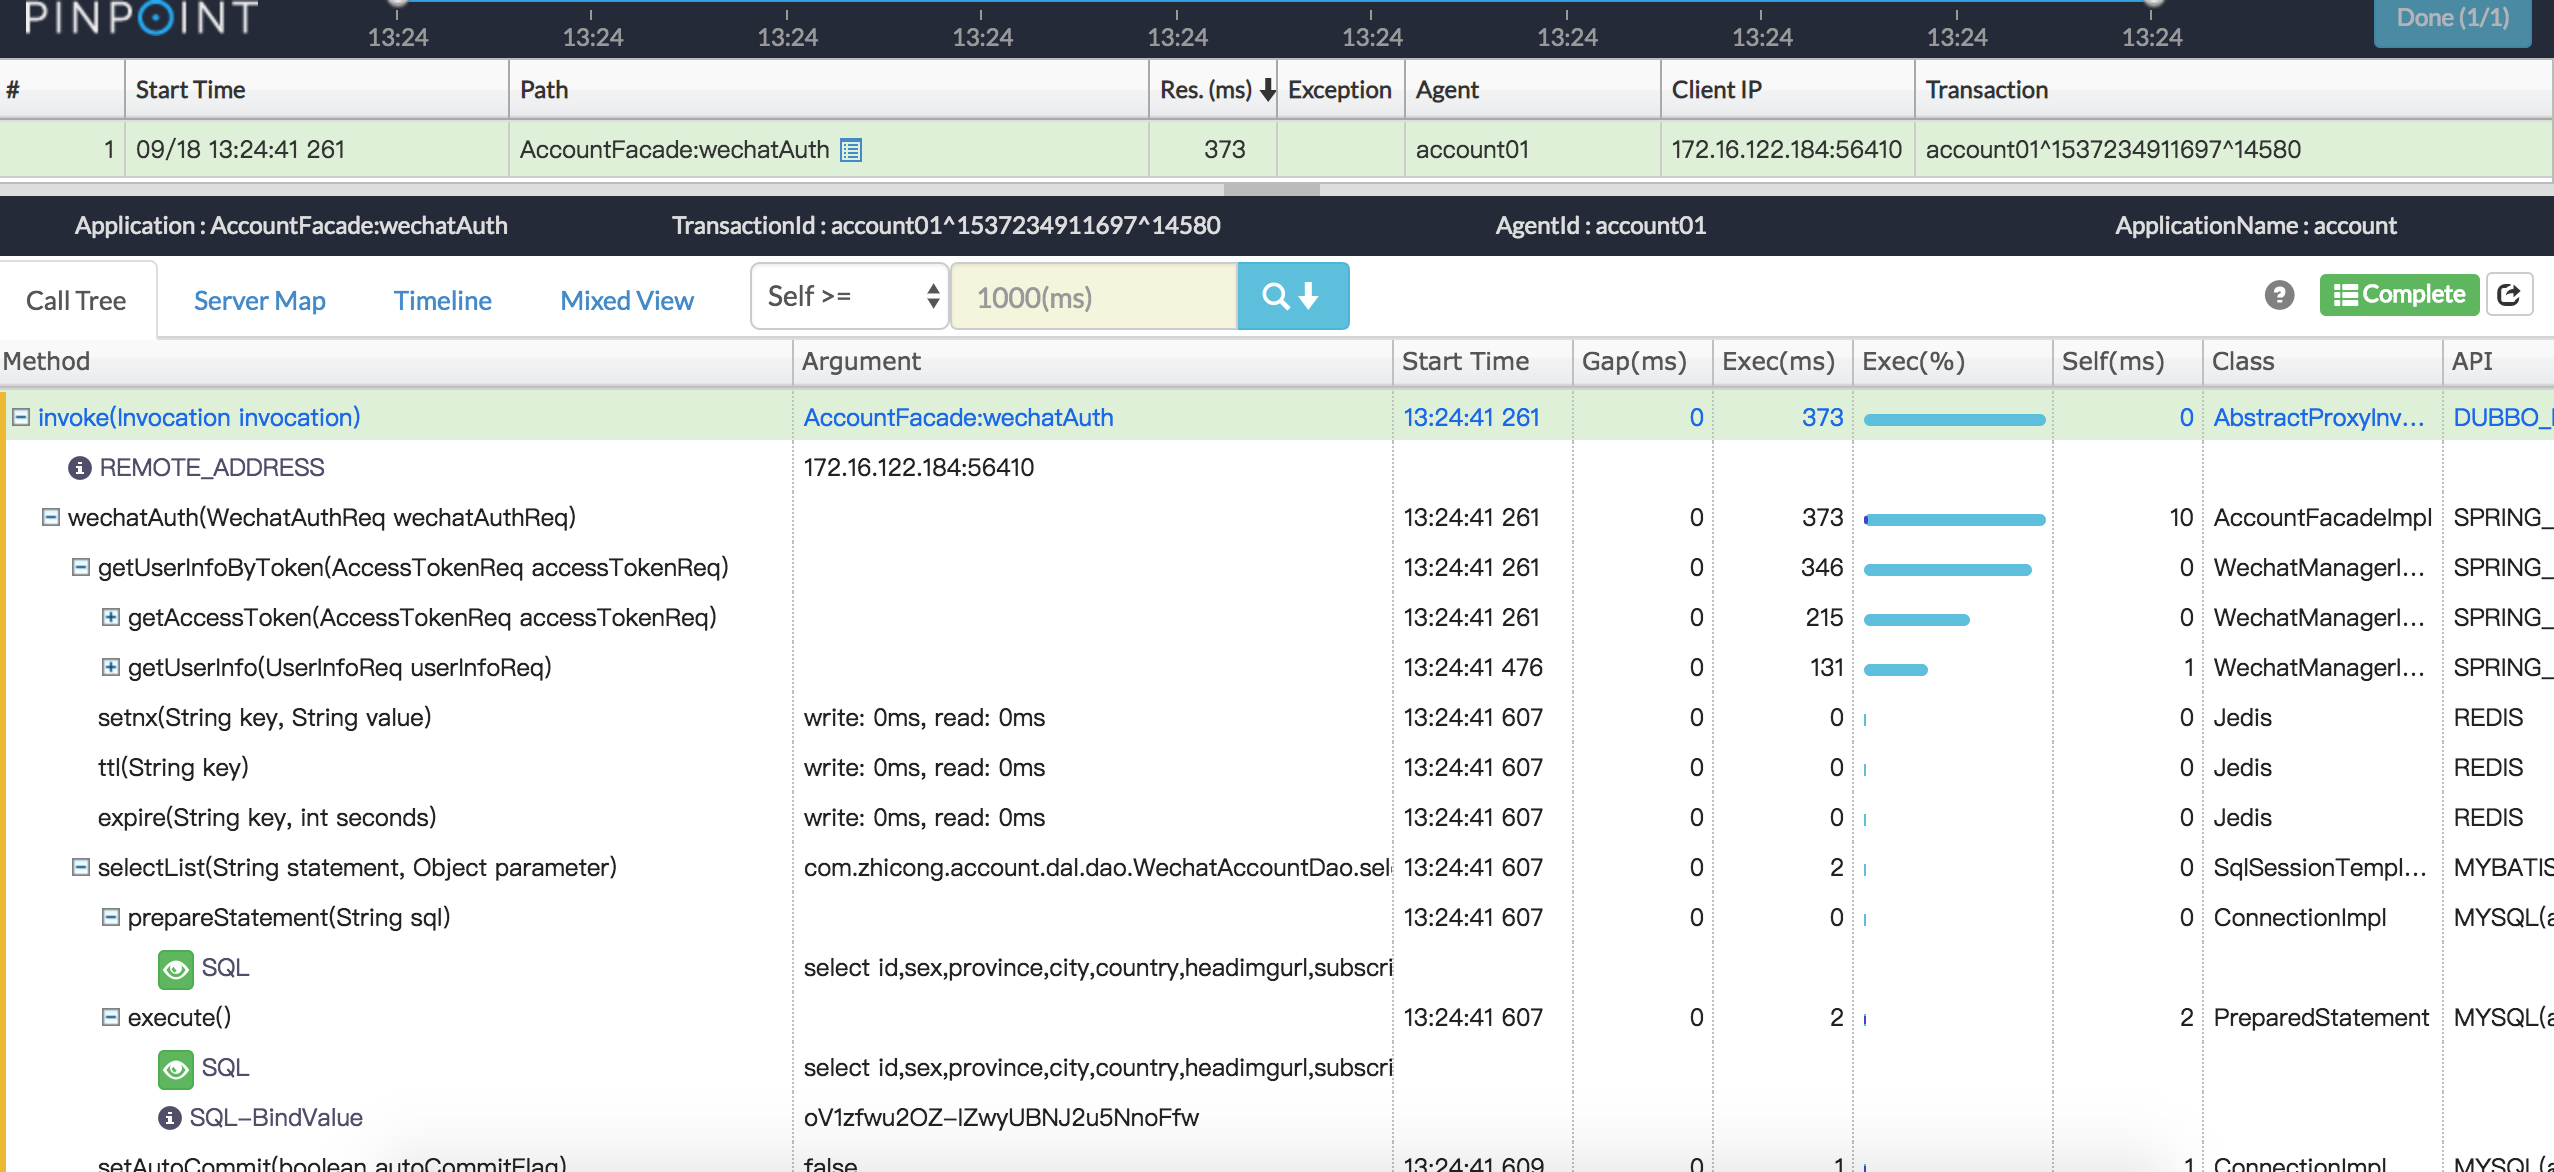
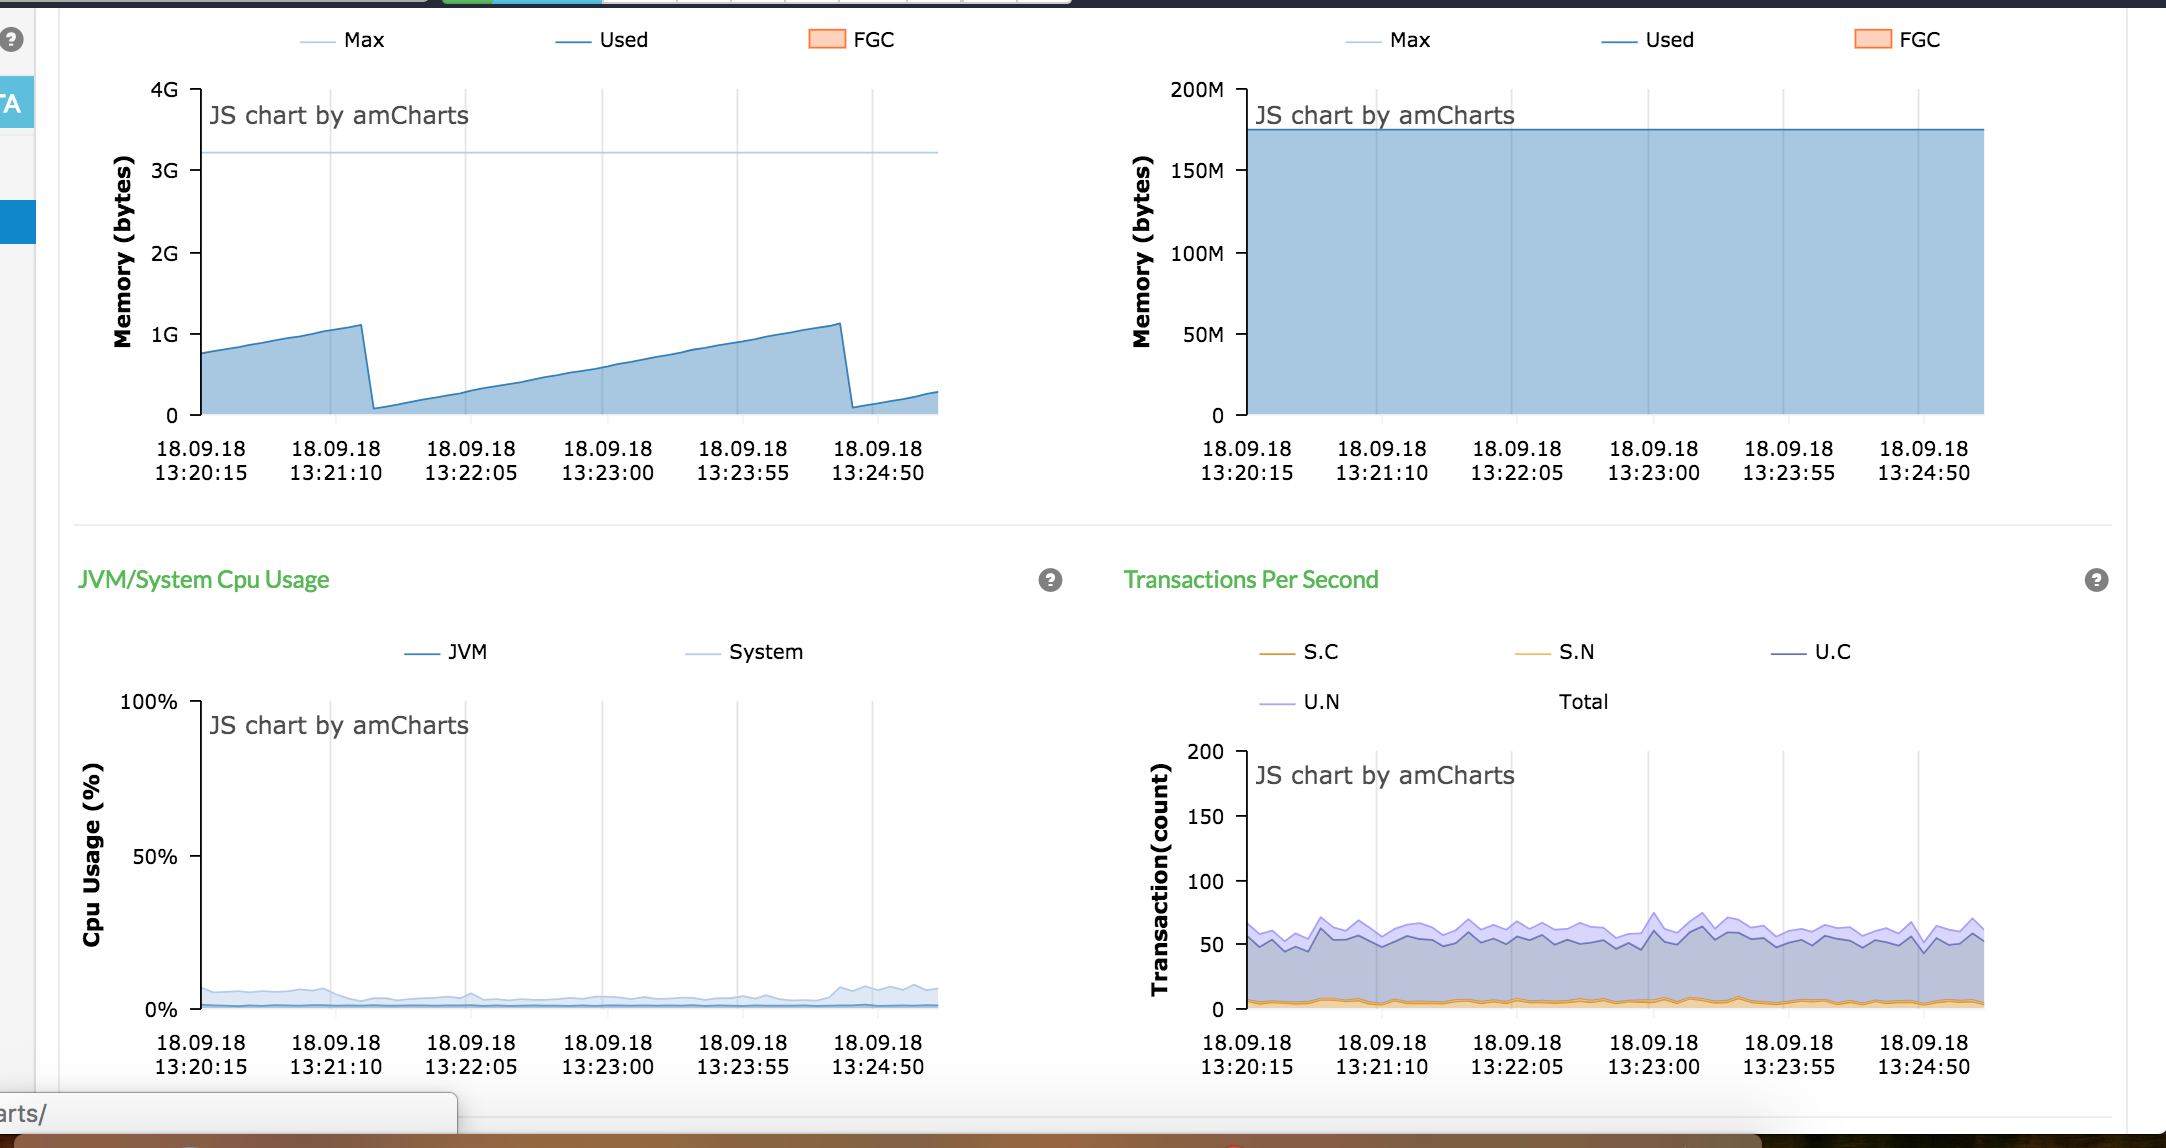
2.5、功能简介
首页能看到应用的拓扑信息,接口调用的成功失败数,响应时间等。
年糕妈妈--洛特
