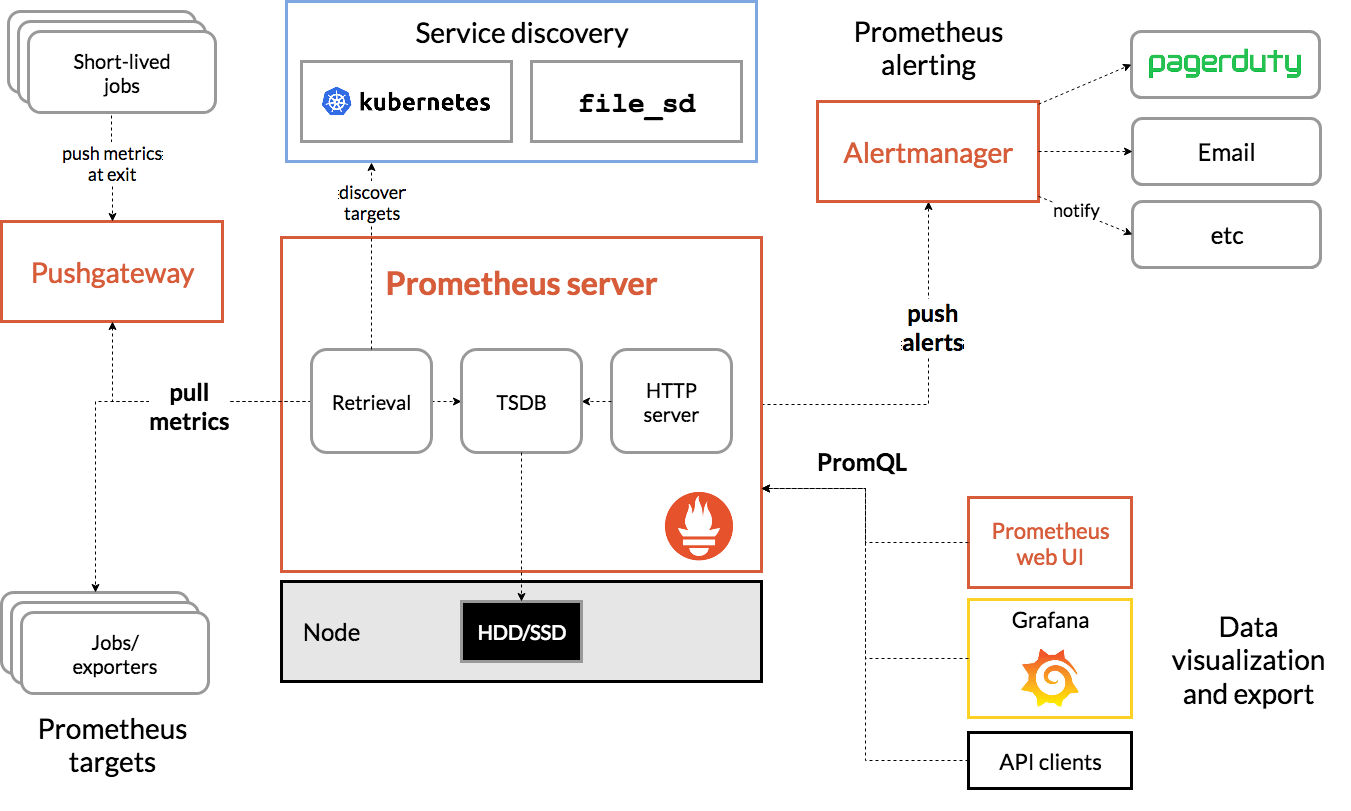
Prometheus is an open-source systems monitoring and alerting toolkit originally built at SoundCloud. Since its inception in 2012, many companies and organizations have adopted Prometheus, and the project has a very active developer and user community. It is now a standalone open source project and maintained independently of any company. To emphasize this, and to clarify the project's governance structure, Prometheus joined the Cloud Native Computing Foundation in 2016 as the second hosted project, after Kubernetes.
scrape_configs:
# The job name is added as a label `job=<job_name>` to any timeseries scraped from this config.
- job_name: 'prometheus'
# Override the global default and scrape targets from this job every 5 seconds.
scrape_interval: 5s
static_configs:
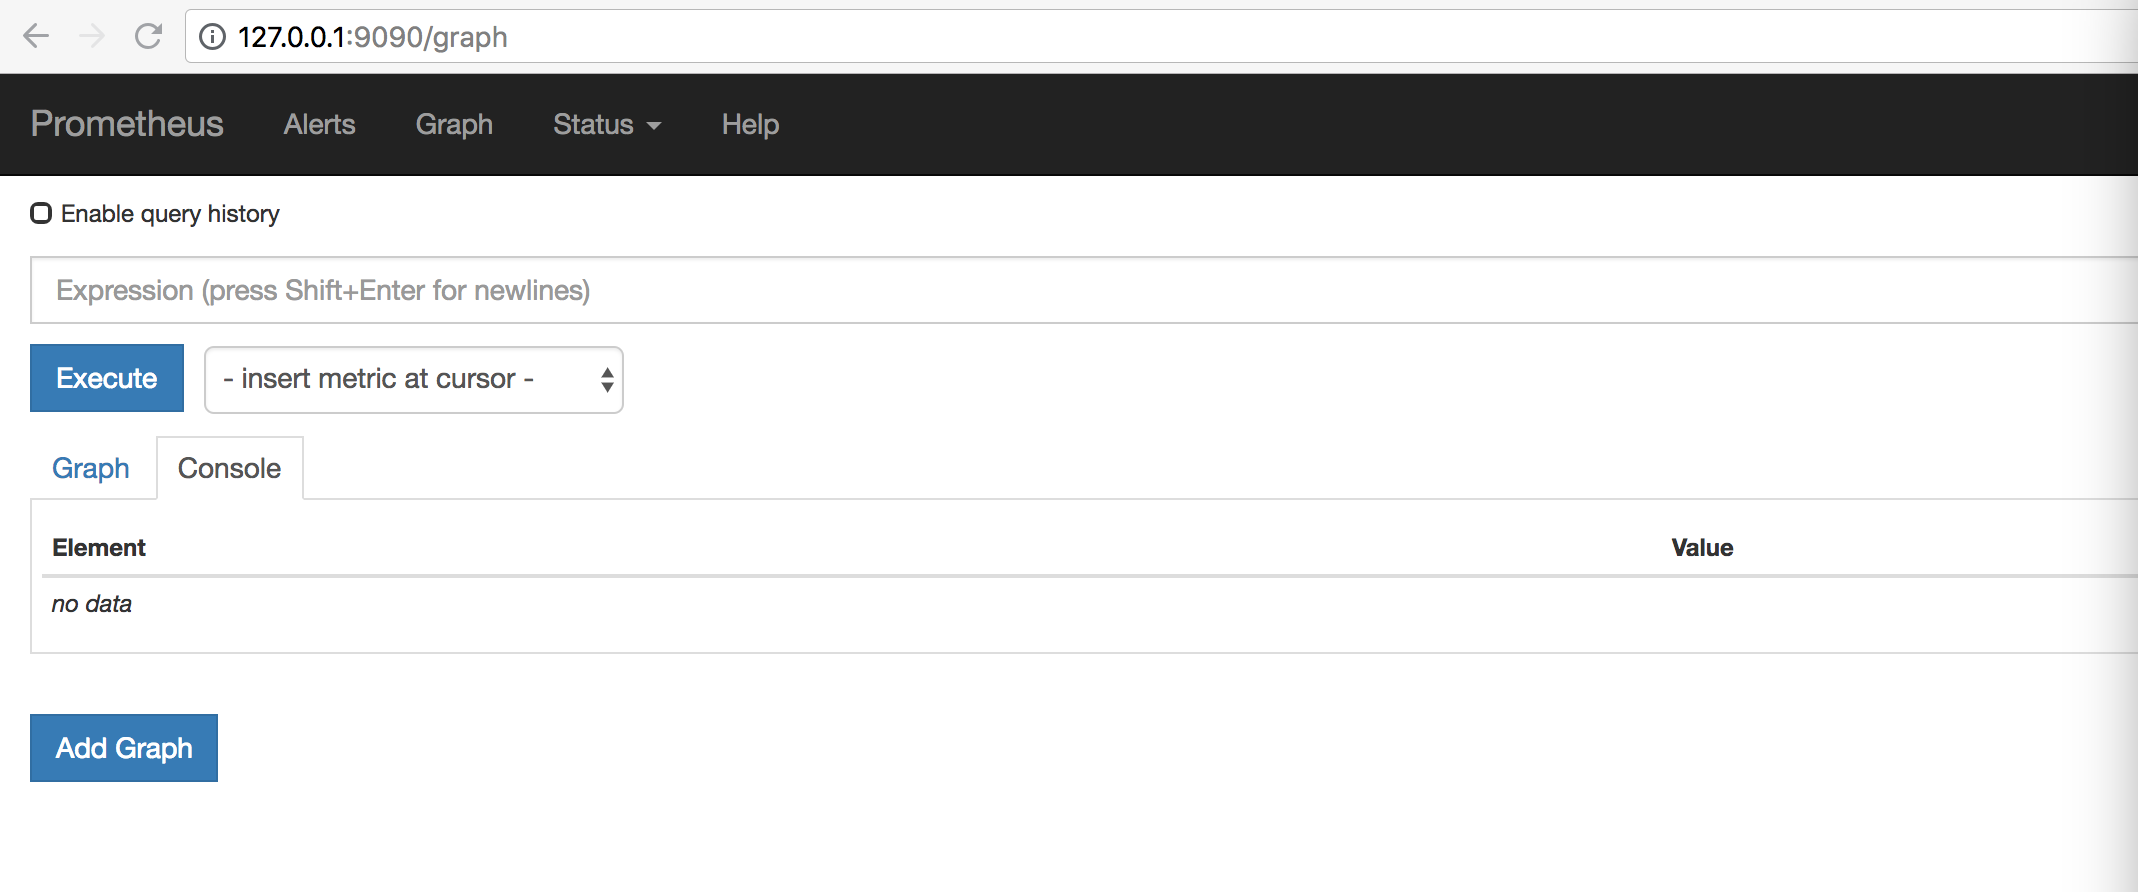
- targets: ['127.0.0.1:9090']
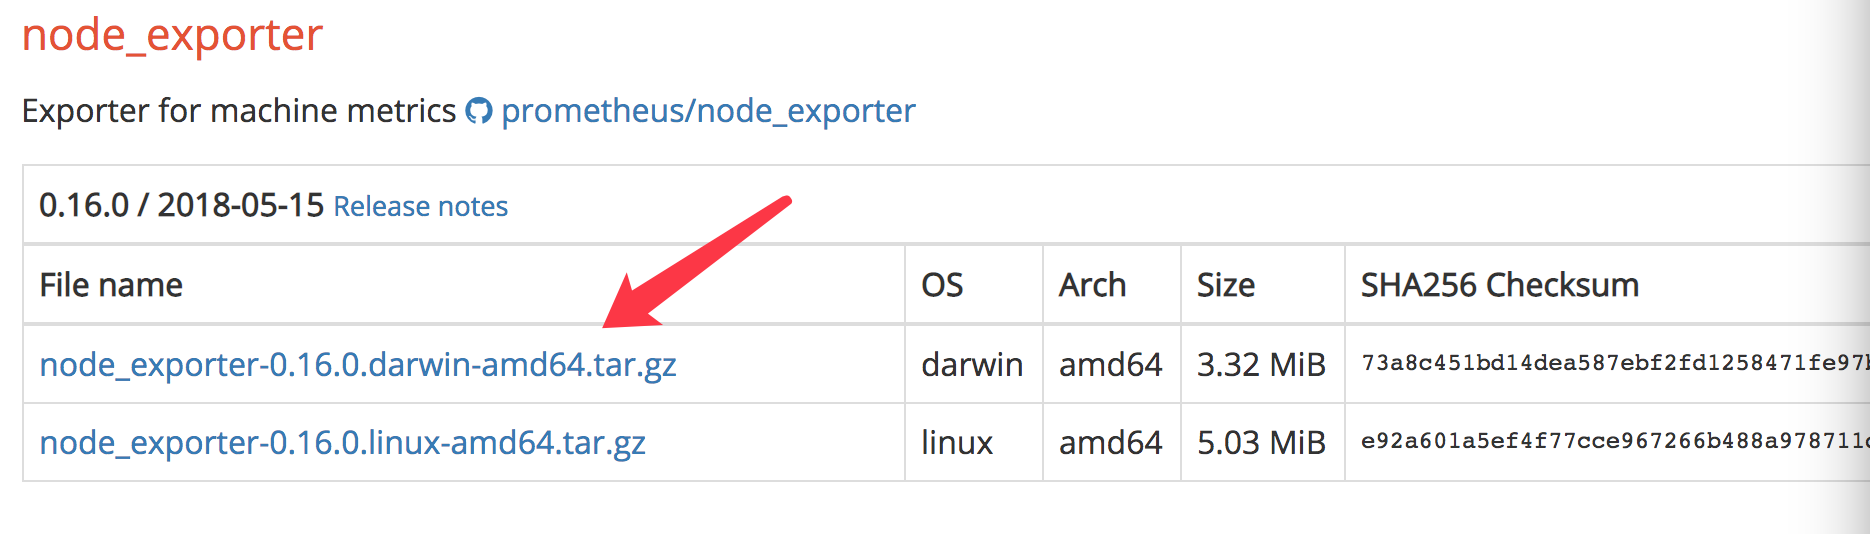
- job_name: 'node' # 将node添加到监控中
static_configs:
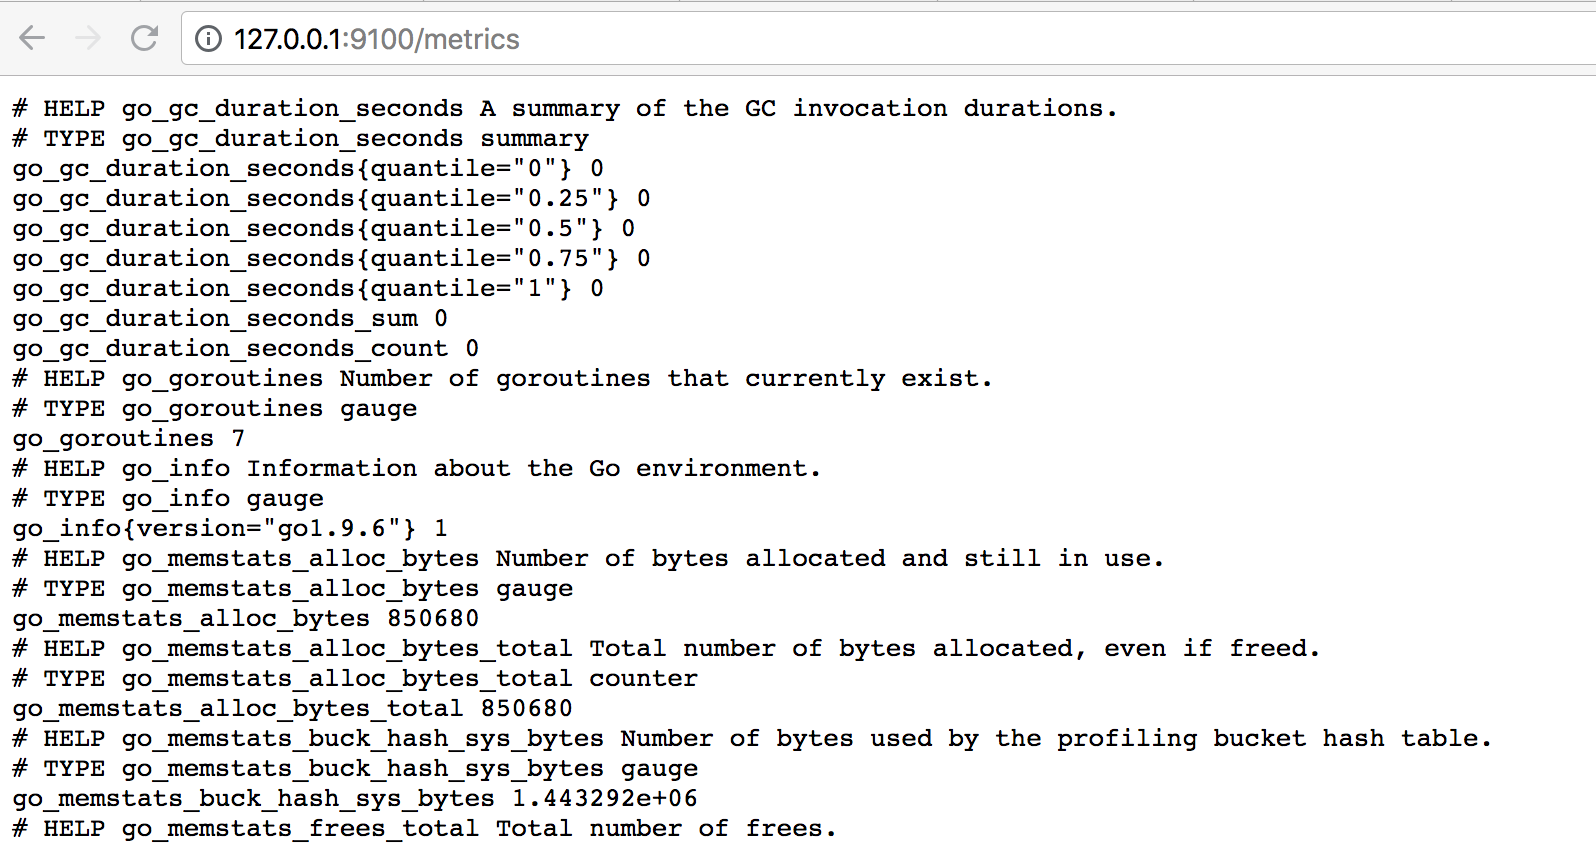
- targets: ['127.0.0.1:9100']
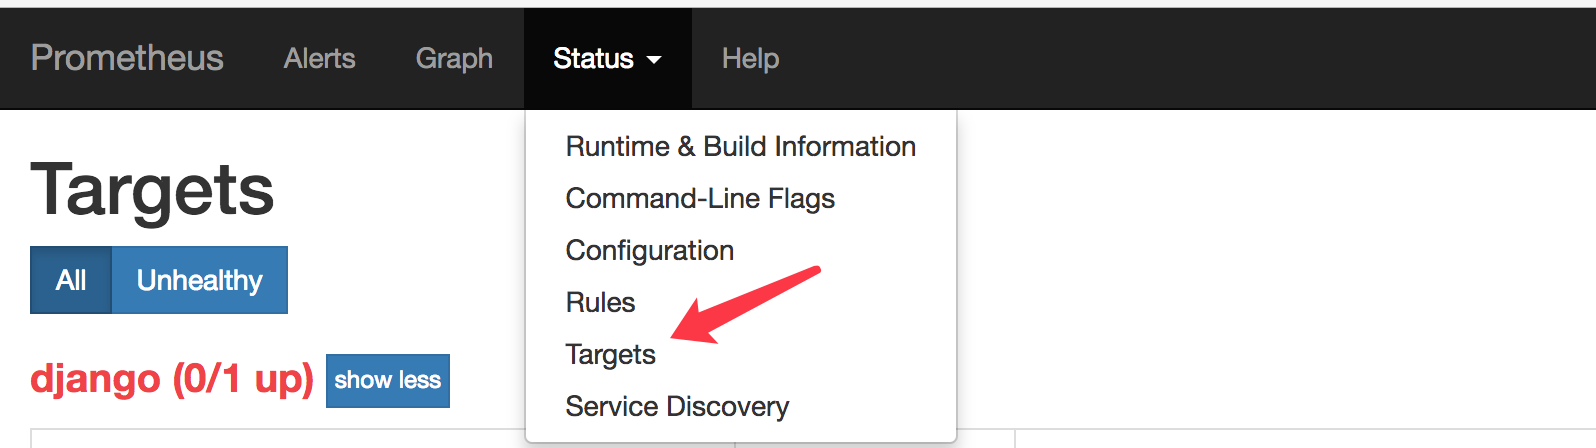
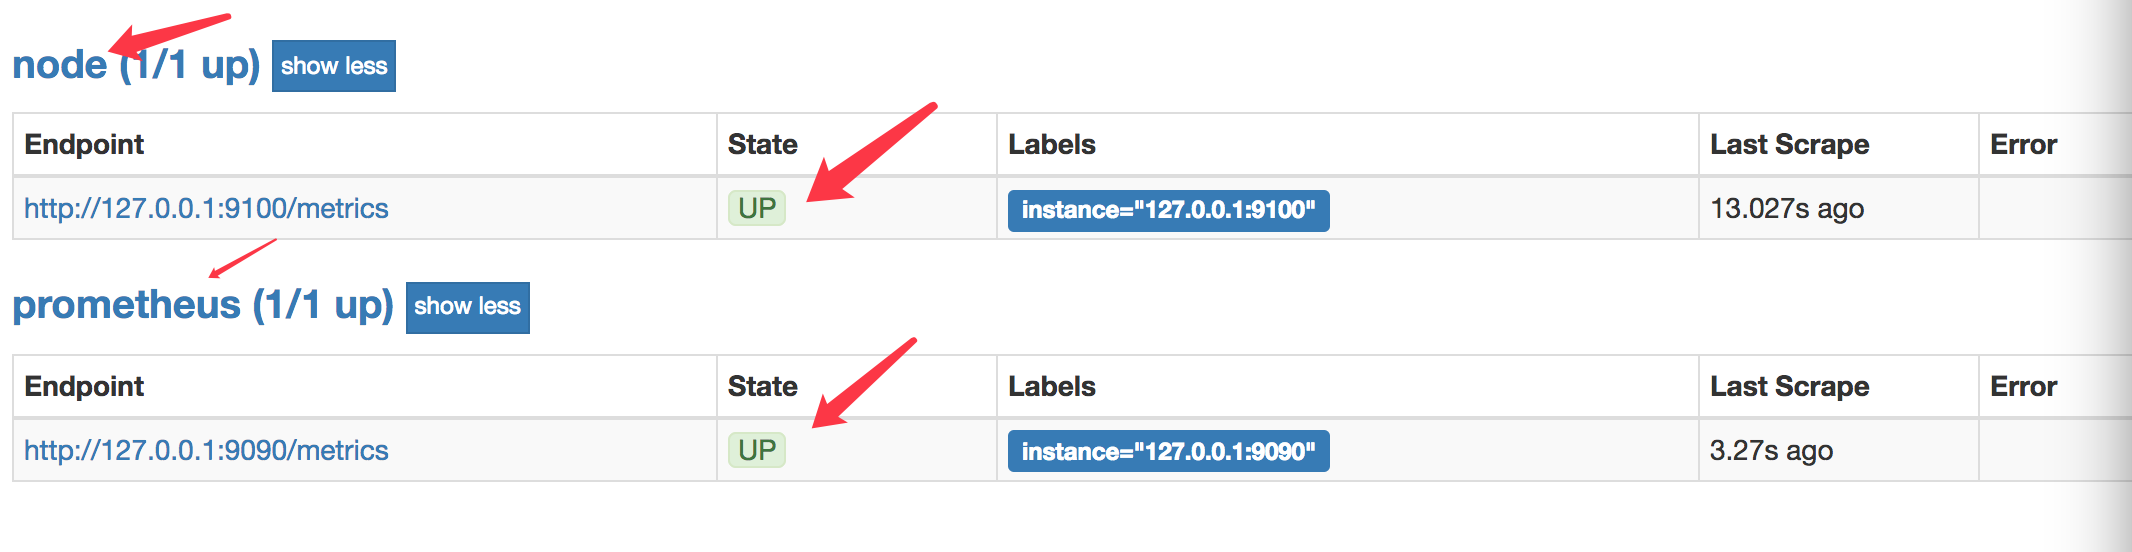
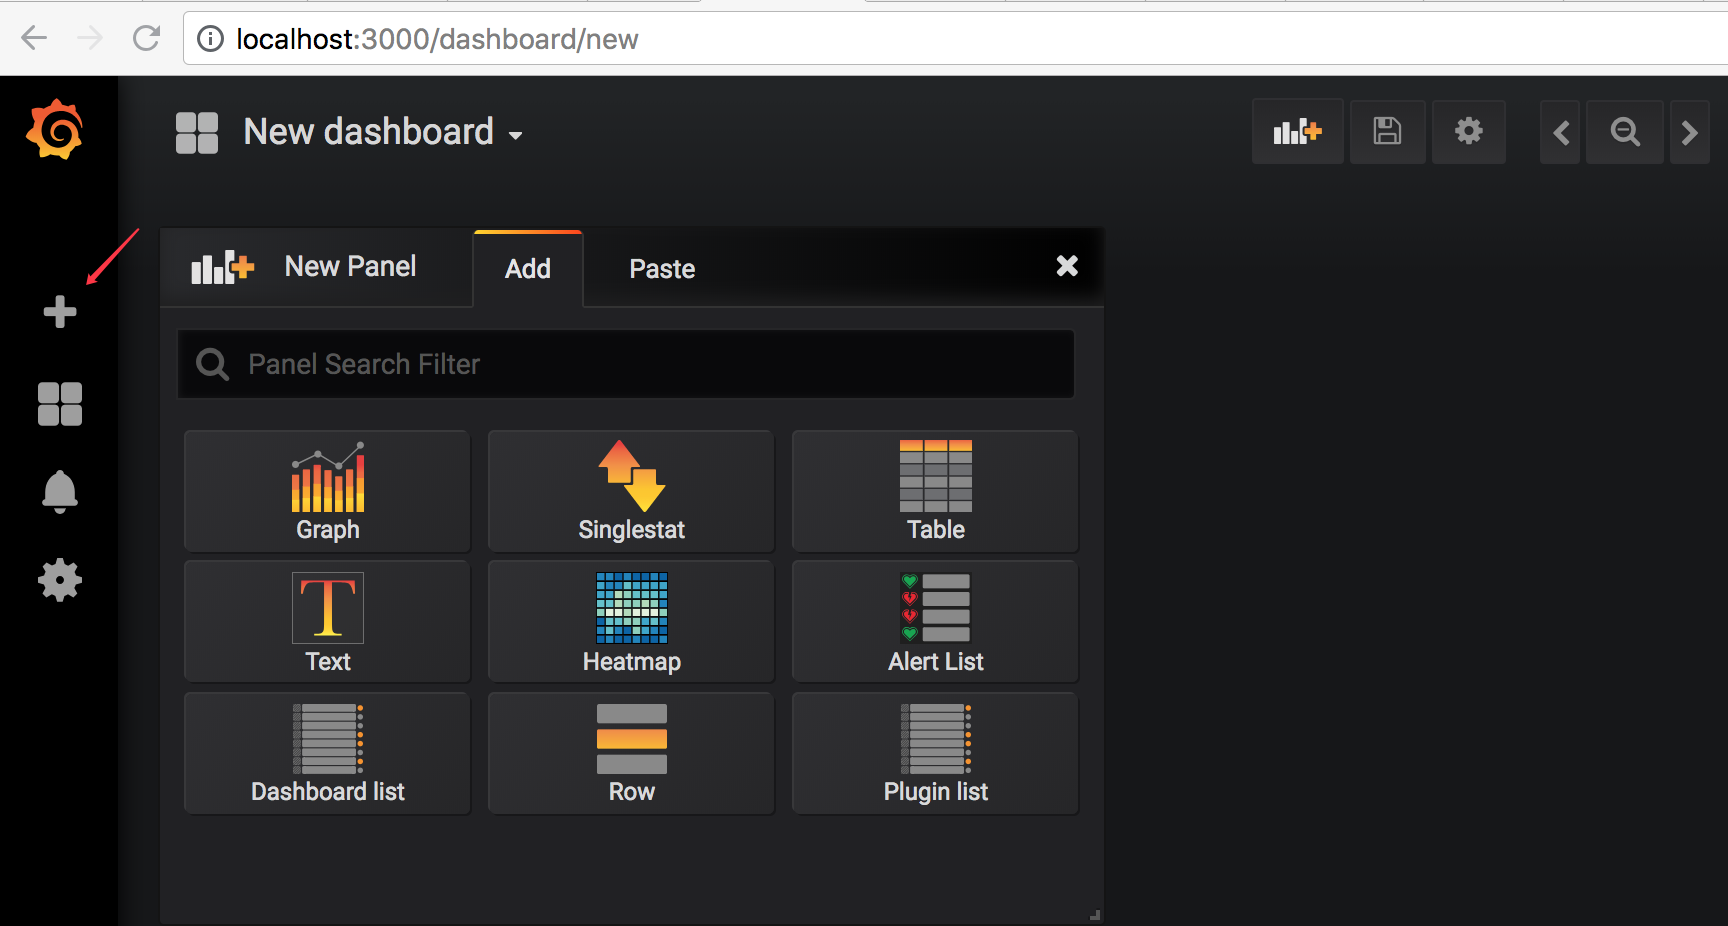
点击 Status -> Targets, 如果能看到当前有两个正在被监控的程序,且都处于UP状态,则配置成功
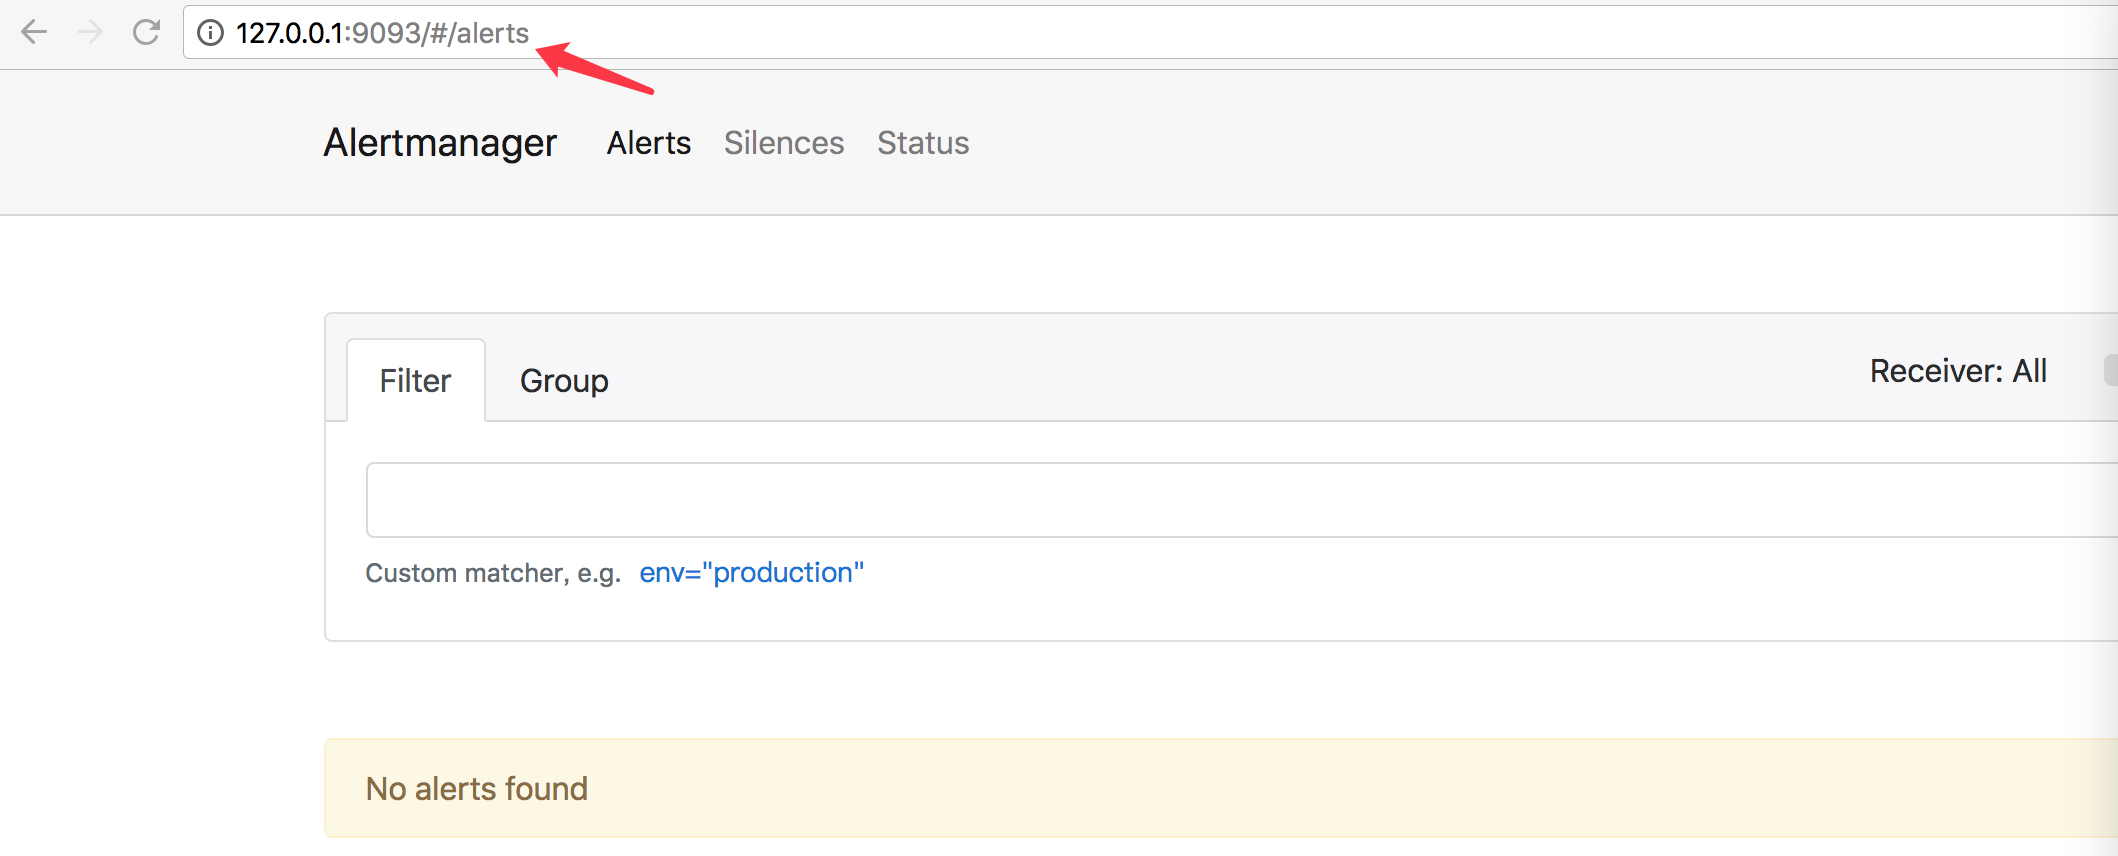
为 prometheus 添加报警
配置文件处理
到 alertmanager 解压目录下, vim alertmanager.yml 中加入:
global:
  # The smarthost and SMTP sender used for mail notifications.
  smtp_smarthost: 'you email host:587'
  smtp_from: 'email_name@qq.com'
  smtp_auth_username: 'email_name@qq.com'
  smtp_auth_password: 'email_password'
  resolve_timeout: 5m

route:
  group_by: ['alertname']
  group_wait: 10s
  group_interval: 10s
  repeat_interval: 1h
  receiver: 'web.hook'
receivers:
- name: 'web.hook'
  email_configs:
  - to: 'receive alert email account'
inhibit_rules:
  - source_match:
      severity: 'critical'
    target_match:
      severity: 'warning'
    equal: ['alertname', 'dev', 'instance']
到 prometheus 解压目录下, 新建文件 alert.rules
vim alert.rules 在文件中加入:
groups:
- name: example
  rules:

  # Alert for any instance that is unreachable for >5 minutes.
  - alert: InstanceDown
    expr: up == 0
    for: 5m
    labels:
      severity: page
    annotations:
      summary: "Instance {{ $labels.instance }} down"
      description: "{{ $labels.instance }} of job {{ $labels.job }} has been down for more than 5 minutes."

  # Alert for any instance that has a median request latency >1s.
  - alert: APIHighRequestLatency
    expr: api_http_request_latencies_second{quantile="0.5"} > 1
    for: 10m
    annotations:
      summary: "High request latency on {{ $labels.instance }}"
      description: "{{ $labels.instance }} has a median request latency above 1s (current value: {{ $value }}s)"
将报警规则和报警组件配置到 prometheus 中:
vim prometheus.yml,加入如下设置:
rule_files:
  - "test_alert.rules"

# Alerting specifies settings related to the Alertmanager.
alerting:
  alertmanagers:
    - static_configs:
      - targets: ['127.0.0.1:9093']