

Event
Events allow you to capture metrics on your application’s HTTP calls. Use events to monitor: The size and frequency of the HTTP calls your application makes. If you’re making too many calls, or your calls are too large, you should know about it! The performance of these calls on the underlying network. If the network’s performance isn’t sufficient, you need to either improve the network or use less of it.
Events允许你捕获你的应用Http请求的调用监控(也就是生命周期)。 使用Events可以展示:.应用Http请求发出的大小和频率, 如果你发出了太多请求, 或者你的请求太大, 你应该了解它。
.底层网络调用的性能。如果性能不足, 你应该提高网络或减少网络使用。
EventListener
Subclass EventListener and override methods for the events you are interested in. In a successful HTTP call with no redirects or retries the sequence of events is described by this flow.
继承EventListener, 重写你感兴趣的events方法。 在一次没有重定向 或 重试的Http成功请求中, 事件序列执行如下。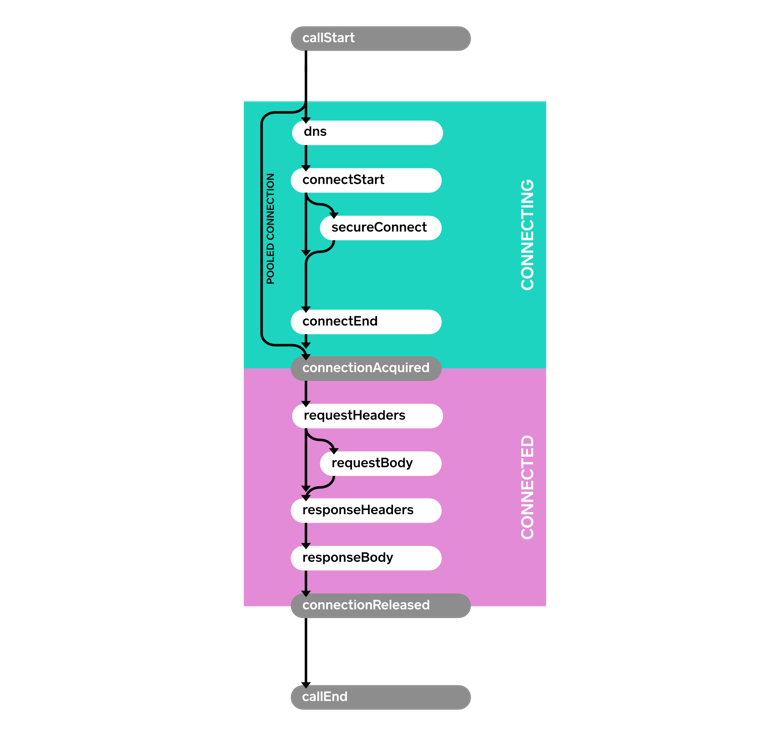
Here’s a sample event listener that prints each event with a timestamp.
这是一个打印每个事件的简单的eventListener。class PrintingEventListener extends EventListener {
private long callStartNanos;
private void printEvent(String name) {
long nowNanos = System.nanoTime();
if (name.equals("callStart")) {
callStartNanos = nowNanos;
}
long elapsedNanos = nowNanos - callStartNanos;
System.out.printf("%.3f %s%n", elapsedNanos / 1000000000d, name);
}
@Override public void callStart(Call call) {
printEvent("callStart");
}
@Override public void callEnd(Call call) {
printEvent("callEnd");
}
@Override public void dnsStart(Call call, String domainName) {
printEvent("dnsStart");
}
@Override public void dnsEnd(Call call, String domainName, List<InetAddress> inetAddressList) {
printEvent("dnsEnd");
}
...
}
Request request = new Request.Builder()
    .url("https://publicobject.com/helloworld.txt")
    .build();

System.out.println("REQUEST 1 (new connection)");
try (Response response = client.newCall(request).execute()) {
  // Consume and discard the response body.
  response.body().source().readByteString();
}

System.out.println("REQUEST 2 (pooled connection)");
try (Response response = client.newCall(request).execute()) {
  // Consume and discard the response body.
  response.body().source().readByteString();
}
REQUEST 1 (new connection)
0.000 callStart
0.010 dnsStart
0.017 dnsEnd
0.025 connectStart
0.117 secureConnectStart
0.586 secureConnectEnd
0.586 connectEnd
0.587 connectionAcquired
0.588 requestHeadersStart
0.590 requestHeadersEnd
0.591 responseHeadersStart
0.675 responseHeadersEnd
0.676 responseBodyStart
0.679 responseBodyEnd
0.679 connectionReleased
0.680 callEnd
REQUEST 2 (pooled connection)
0.000 callStart
0.001 connectionAcquired
0.001 requestHeadersStart
0.001 requestHeadersEnd
0.002 responseHeadersStart
0.082 responseHeadersEnd
0.082 responseBodyStart
0.082 responseBodyEnd
0.083 connectionReleased
0.083 callEnd
Notice how no connect events are fired for the second call. It reused the connection from the first request for dramatically better performance.
注意: 第二次调用没有触发连接事件。 它重用了第一次连接, 从而显著提高了性能。EventListener。Factory
In the preceding example we used a field, callStartNanos, to track the elapsed time of each event. This is handy, but it won’t work if multiple calls are executing concurrently. To accommodate this, use a Factory to create a new EventListener instance for each Call. This allows each listener to keep call-specific state. This sample factory creates a unique ID for each call and uses that ID to differentiate calls in log messages.
在前面的示例中,我们使用了一个字段callStartNanos来跟踪每个事件的已用时间。这很方便,但如果多个调用同时执行,它将无法工作。 为了适应这种情况,请使用Factory为每个Call创建一个新的EventListener实例。 这允许每个监听器保持特定于呼叫的状态。 此示例工厂为每个调用创建唯一ID,并使用该ID区分日志消息中的调用。class PrintingEventListener extends EventListener {
public static final Factory FACTORY = new Factory() {
final AtomicLong nextCallId = new AtomicLong(1L);
@Override public EventListener create(Call call) {
long callId = nextCallId.getAndIncrement();
System.out.printf("%04d %s%n", callId, call.request().url());
return new PrintingEventListener(callId, System.nanoTime());
}
};
final long callId;
final long callStartNanos;
public PrintingEventListener(long callId, long callStartNanos) {
this.callId = callId;
this.callStartNanos = callStartNanos;
}
private void printEvent(String name) {
long elapsedNanos = System.nanoTime() - callStartNanos;
System.out.printf("%04d %.3f %s%n", callId, elapsedNanos / 1000000000d, name);
}
@Override public void callStart(Call call) {
printEvent("callStart");
}
@Override public void callEnd(Call call) {
printEvent("callEnd");
}
...
}
We can use this listener to race a pair of concurrent HTTP requests
我们可以使用这个listener来同时追踪一对HTTP请求:Request washingtonPostRequest = new Request.Builder()
.url("https://www.washingtonpost.com/")
.build();
client.newCall(washingtonPostRequest).enqueue(new Callback() {
...
});
Request newYorkTimesRequest = new Request.Builder()
.url("https://www.nytimes.com/")
.build();
client.newCall(newYorkTimesRequest).enqueue(new Callback() {
...
});
Running this race over home WiFi shows the Times (0002) completes just slightly sooner than the Post (0001):
在WiFi上运行这次追踪显示, 0002的完成时间只比0001快一点。0001 https://www.washingtonpost.com/
0001 0.000 callStart
0002 https://www.nytimes.com/
0002 0.000 callStart
0002 0.010 dnsStart
0001 0.013 dnsStart
0001 0.022 dnsEnd
0002 0.019 dnsEnd
0001 0.028 connectStart
0002 0.025 connectStart
0002 0.072 secureConnectStart
0001 0.075 secureConnectStart
0001 0.386 secureConnectEnd
0002 0.390 secureConnectEnd
0002 0.400 connectEnd
0001 0.403 connectEnd
0002 0.401 connectionAcquired
0001 0.404 connectionAcquired
0001 0.406 requestHeadersStart
0002 0.403 requestHeadersStart
0001 0.414 requestHeadersEnd
0002 0.411 requestHeadersEnd
0002 0.412 responseHeadersStart
0001 0.415 responseHeadersStart
0002 0.474 responseHeadersEnd
0002 0.475 responseBodyStart
0001 0.554 responseHeadersEnd
0001 0.555 responseBodyStart
0002 0.554 responseBodyEnd
0002 0.554 connectionReleased
0002 0.554 callEnd
0001 0.624 responseBodyEnd
0001 0.624 connectionReleased
0001 0.624 callEnd
The EventListener.Factory also makes it possible to limit metrics to a subset of calls. This one captures metrics on a random 10%:
EventListener.Factory还可以限制一部分请求的指标。 这个随机捕获10%的指标:class MetricsEventListener extends EventListener {
private static final Factory FACTORY = new Factory() {
@Override public EventListener create(Call call) {
if (Math.random() < 0.10) {
return new MetricsEventListener(call);
} else {
return EventListener.NONE;
}
}
};
...
}
Events with Failures(有失败的事件)
When an operation fails, a failure method is called. This is connectFailed() for failures while building a connection to the server, and callFailed() when the HTTP call fails permanently. When a failure happens it is possible that a start event won’t have a corresponding end event.
当一个操作失败了, 失败的方法会被调用。 这是一个在创建服务器连接时的连接错误。 当失败发生时, 可能一个开始事件就不会有对应的结束事件了。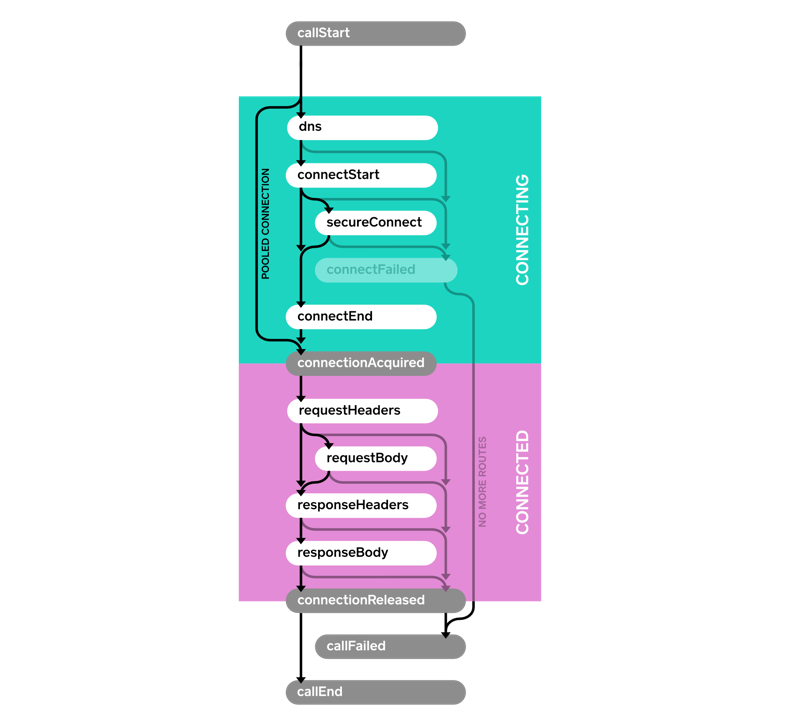
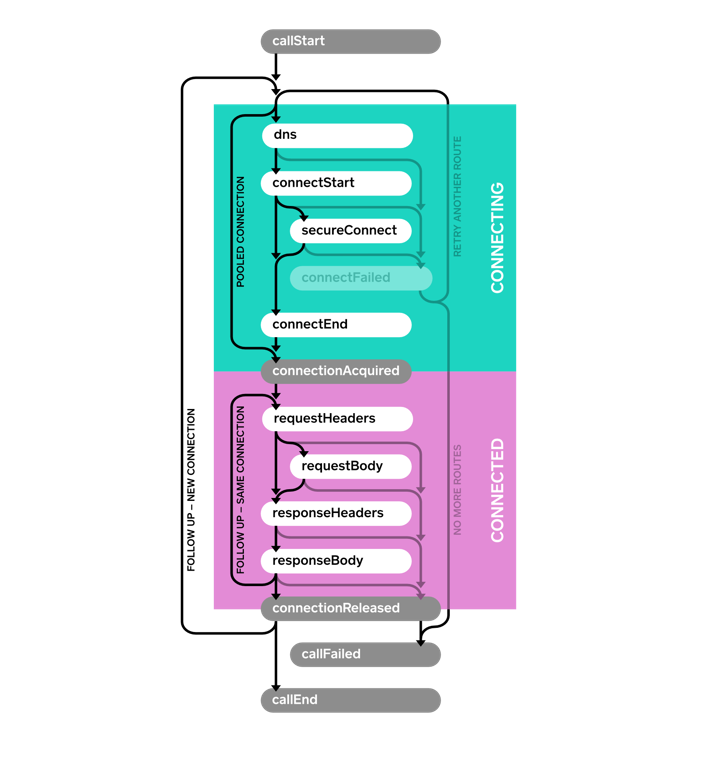
Events with Retries and Follow-Ups(带重试的事件和跟进)
OkHttp is resilient and can automatically recover from some connectivity failures. In this case, the connectFailed() event is not terminal and not followed by callFailed(). Event listeners will receive multiple events of the same type when retries are attempted. A single HTTP call may require follow-up requests to be made to handle authentication challenges, redirects, and HTTP-layer timeouts. In such cases multiple connections, requests, and responses may be attempted. Follow-ups are another reason a single call may trigger multiple events of the same type.
OkHttp具有弹性, 可以自动从连接故障中恢复。 这种情况下, connectFailed()不是终点, 且后面没有callFailed()。 在尝试重试时, EventListener将会接收多个同类型的事件。单个请求调用可能需要后序的请求来询问身份验证, 重定向, 和Http层面的超时。 在这种情况下, 多个连接请求和响应会发生。后序请求是可能会收到多个同类型事件的原因。
适用性
事件机制可以在OkHttp 3.11版本公开使用。 未来可能会引入新的事件类型, 你需要重写响应的方法来处理。