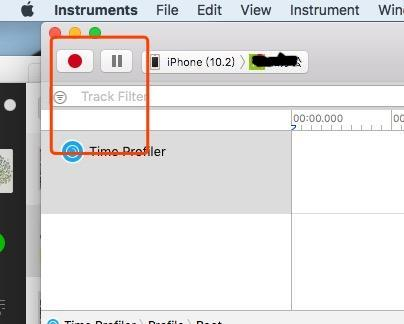
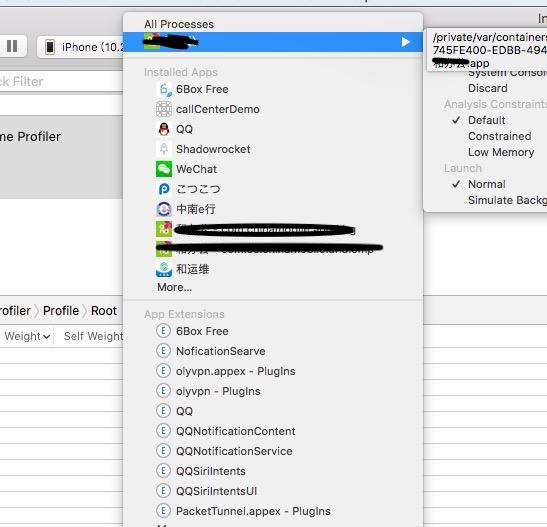
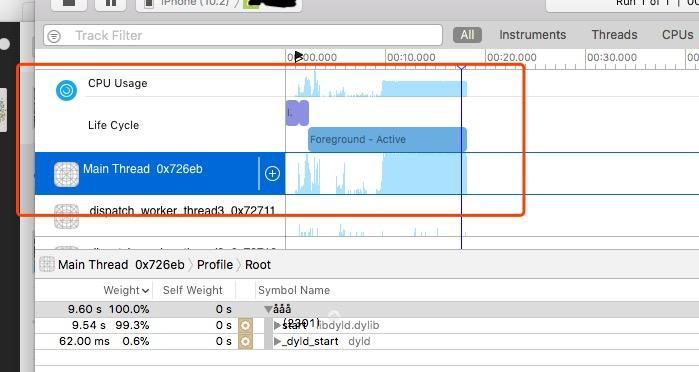
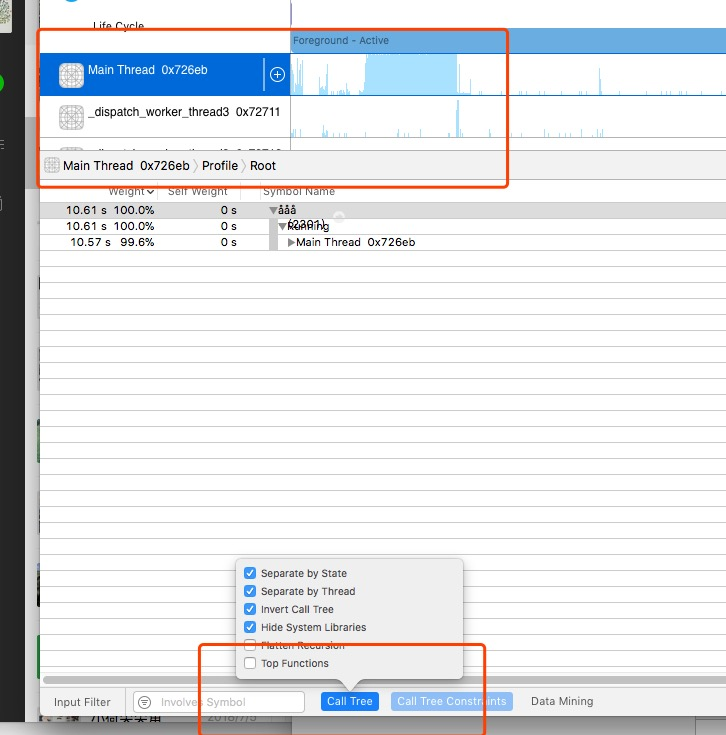
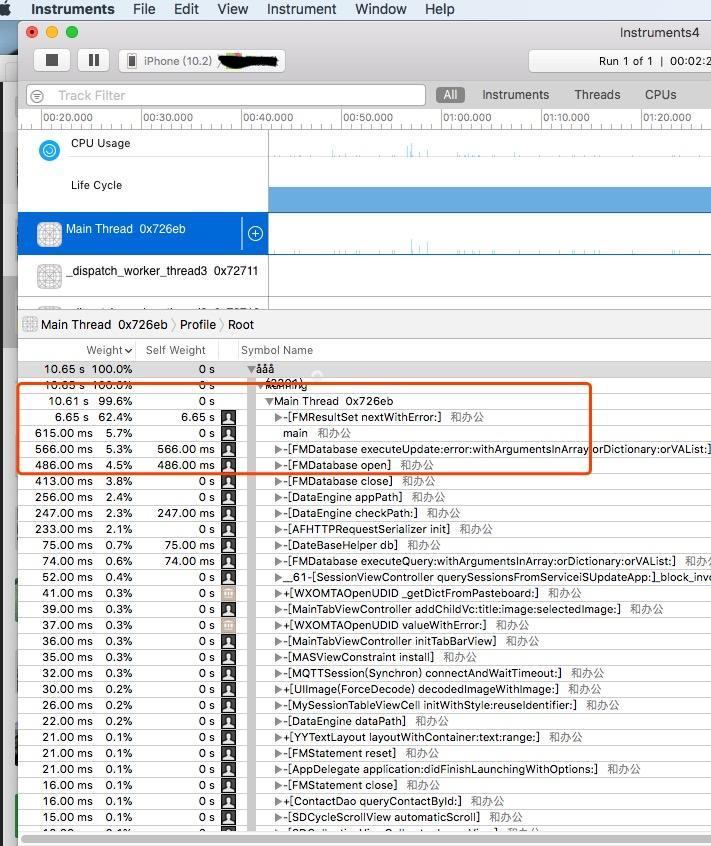
使用Instrument中的time profiler检测耗时函数 黑白小怪兽 2018-07-17 2,949 阅读1分钟 1.设置工程文件的配置选项,生成符号表 2.打开instrument 3.打开time profiler,并且启动调试程序 4.查看cpu 和 主线程使用率 5.设置 call tree 6.查看函数调用栈