

一.简单测试
文件hello.go,某个函数,比如:
package gotest

import (
    "errors"
)

func Division(a, b float64) (float64, error) {
    if b == 0 {
        return 0, errors.New("除数不能为0")
    }

    return a / b, nil
}
测试单元的文件名要写为hello_test.go
package gotest

import (
    "testing"
)

func Test_Division_1(t *testing.T) {
    if i, e := Division(6, 2); i != 3 || e != nil { //try a unit test on function
        t.Error("除法函数测试没通过") // 如果不是如预期的那么就报错
    } else {
        t.Log("第一个测试通过了") //记录一些你期望记录的信息
    }
}

func Test_Division_2(t *testing.T) {
    t.Error("就是不通过")
}
显示出,预期的结果与函数运算的结果是不是相同的.
func TestSubstr(t *testing.T) {
	tests := []struct {
		s   string
		ans int
	}{
		// Normal cases
		{"abcabcbb", 3},
		{"pwwkew", 3},

		// Edge cases
		{"", 0},
		{"b", 1},
		{"bbbbbbbbb", 1},
		{"abcabcabcd", 4},

		// Chinese support
		{"这里是慕课网", 6},
		{"一二三二一", 3},
		{"黑化肥挥发发灰会花飞灰化肥挥发发黑会飞花", 8},
	}

	for _, tt := range tests {
		actual := lengthOfNonRepeatingSubStr(tt.s)
		if actual != tt.ans {
			t.Errorf("got %d for input %s; "+
				"expected %d",
				actual, tt.s, tt.ans)
		}
	}
}
单元测试可以用这种表格的方式就可以将大量数据放到所写的函数里面去测试了.
覆盖率测试: go test -c -covermode=count -coverpkg ./... 来编译一个后缀为.test的可执行文件,执行后,它会执行所有的单元测试代码,然后输出覆盖率的报告。
二.性能调优
编写函数:
//计算输入的字符串有多少个不同字符,并输出
func lengthOfNonRepeatingSubStr(s string) int {
	lastOccurred := make(map[rune]int)
	start := 0
	maxLength := 0

	for i, ch := range []rune(s) {
		if lastI, ok := lastOccurred[ch]; ok && lastI >= start {
			start = lastI + 1
		}
		if i-start+1 > maxLength {
			maxLength = i - start + 1
		}
		lastOccurred[ch] = i
	}

	return maxLength
}
函数的测试单元:
使用bench : go test -bench .
func BenchmarkSubstr(b *testing.B) {
	s := "黑化肥挥发发灰会花飞灰化肥挥发发黑会飞花"
	for i := 0; i < 13; i++ {
		s = s + s
	}
	b.Logf("len(s) = %d", len(s))
	ans := 8
	b.ResetTimer()

	for i := 0; i < b.N; i++ {
		actual := lengthOfNonRepeatingSubStr(s)
		if actual != ans {
			b.Errorf("got %d for input %s; "+
				"expected %d",
				actual, s, ans)
		}
	}
}

//b.Logf(). 打印
//b.ResetTimer()  时间重新开始计算,之前的操作耗时清除
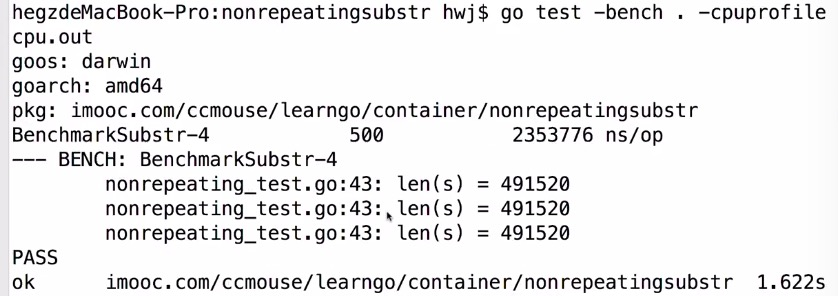
终端执行 : go test -bench .
不仅可以测试函数,还能得出函数执行的时间.在程序优化和算法优化上,会经常用到.
go test -bench . -cpuprofile cpu.out
查看耗时,并生成cpu的耗时表:
go tool pprof cpu.out 进入pprof工具
输入web 打开cpu耗时的图 (需要安装工具Graphviz www.graphviz.org)
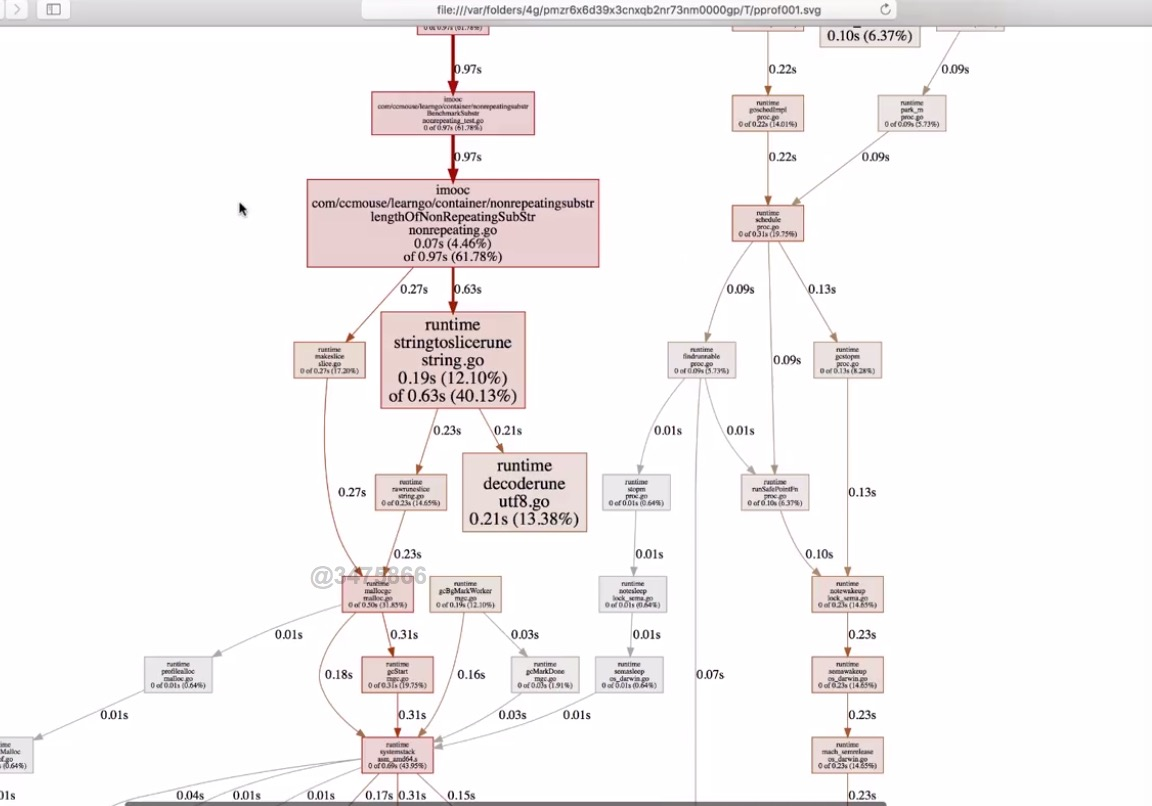
通过分析图就可以看出哪里消耗的时间多,就能进一步的优化代码!
(以上例子部分摘抄网上)
