

文章首发于本人微信公众号:WebGL Eearth台风监测web应用
前言
花了一天时间,开发了一个基于WebGL Eearth的台风监测系统,写这个web应用的目的有两个:
1、我在github上创建了@viseye组织已经一段时间,但是迟迟没有项目,于是近期打算写一个
2、另一个原因是我再知乎开了可视化编程专栏,文章偶尔需要继续更新,就得找些东西来写
相关地址:
台风监测web应用webglearth-typhoon
运行截图
下图GIF格式,有动画,点击图片即可播放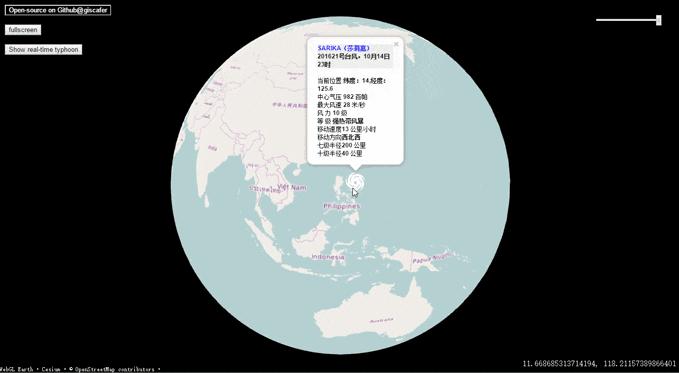
Demo Url
在线demo:Website by viseye
建议使用支持WebGL HTML5的浏览器打开,IE10+或新版Google Chrome等
iPhone 浏览器和微信(IOS)内置浏览器测试可打开
实现
1、服务端
服务端使用nodejs搭建服务器,提供前端数据请求的api接口,目前部署于BAE
app.js代码如下,主要是使用express搭建一个简单的server
/**
 * app entry
 */
'use strict'

const path=require('path');
const express=require('express');
const bodyParser=require('body-parser');
const Typhoon=require('node-typhoon');
const app=express();

app.set('port',(process.env.PORT || 3000));

app.use('',express.static(path.join(__dirname,'public')));
app.use(bodyParser.json());
app.use(bodyParser.urlencoded({extended:true}));

// Additional middleware which will set headers that we need on each request.
app.use((req, res, next)=>{
    res.setHeader('Access-Control-Allow-Origin', '*');
    // Disable caching so we'll always get the latest comments.
    res.setHeader('Cache-Control', 'no-cache');
    next();
});
//get real-time typhoon information
app.get('/api/typhoonActivity',(req,res)=>{
    Typhoon.typhoonActivity().then(info=>{
        res.send(info);
    }).catch(err=>{
        res.send(err);
    });
});
//get historical typhoon information
app.get('/api/typhoonList',(req,res)=>{
    let year=new Date().getFullYear();
    Typhoon.typhoonList(year).then(info=>{
        res.send(info);
    }).catch(err=>{
         res.send(err);
    });
});

app.listen(app.get('port'),()=>{
    console.log('Server started: http://localhost:'+app.get('port')+'/');
});
中间件说的是nodejs的middlemodule,webglearth-typhoon使用了个人自己封装的node-typhoon(已发布到npm),提供了获取实时台风的接口,以及历史台风信息的接口,目前版本是v1.0.0,后期会更新。
如下数据结果是今天(2016年10月15日11:53:33)获取的台风信息,两个台风从太平洋方向过来
[
  {
    "enname": "SARIKA",
    "lat": "14.40",
    "lng": "124.30",
    "movedirection": "西北西",
    "movespeed": "22",
    "name": "莎莉嘉",
    "power": "12",
    "pressure": "970",
    "radius10": "100",
    "radius7": "220",
    "speed": "35",
    "strong": "台风",
    "tfid": "201621",
    "time": "2016-10-15 11:00:00",
    "timeformate": "10月15日11时"
  },
  {
    "enname": "HAIMA",
    "lat": "8.20",
    "lng": "143.90",
    "movedirection": "北西",
    "movespeed": "22",
    "name": "海马",
    "power": "8",
    "pressure": "998",
    "radius10": null,
    "radius7": "200",
    "speed": "18",
    "strong": "热带风暴",
    "tfid": "201622",
    "time": "2016-10-15 08:00:00",
    "timeformate": "10月15日8时"
  }
]
更多见:node-typhoon
3、前端 webglearth2
官方介绍:
webglearth2 - WebGL Earth 2 - the source code of the project,There is an extremely easy to use JavaScript API - fully mimicking LeafletJS.
webglearth2是一个开源虚拟地球web应用程序,可以运行在任何支持HTML5 WebGL标准的web浏览器上,以及移动设备,如iPhone,iPad或基于Android的手机也会支持。此外提供LeafletJS封装的地图API。
传送门:GitHub - webglearth/webglearth2: WebGL Earth 2
webglearth-typhoon实现整个思路:
前端加载虚拟三维球+地图后,通过调用nodejs服务器中node-typhoon提供的Api获取台风信息,数据返回前端后,组装好,通过marker和气泡弹窗展示信息的方式加载到地图。This is all~
TODO
1、加上历史台风查询展示;
2、实时台风路径情况
(感兴趣的同学可以一起开发)
总结
总结一下用到的技术
- JavaScript+HTML5+CSS 网页必须的,不多说
- JavaScript新标准ES6,源码可能用了一些ES6的新特性书写
- WebGL
- LeafletJS 一个地图JavaScript库
- Nodejs 服务端
好像都是JavaScript~~~
源码
Github:GitHub - viseye/webglearth-typhoon: A typhoon web application base on WebGL Earth
爱学习、爱分享的同学,可关注个人微信公众号(id:giscafer)
