

November 17, 2015
A growing number of graphing tools and libraries allow anyone to make beautiful, interactive web-based graphs. By interactively visualizing our data online, we share complex ideas in an exploratory, visual, open, and collaborative way.
Today, Plotly is announcing that we have open-sourced plotly.js, the core technology and JavaScript graphing library behind Plotly’s products (MIT license). It's all out there and free. Any developer can now integrate Plotly’s library into their own applications unencumbered. Plotly.js supports 20 chart types, including 3D plots, geographic maps, and statistical charts like density plots, histograms, box plots, and contour plots.
We’re big fans of collaboration, freedom, and perpetual motion. Open-source has become the de facto distribution for gold-standard scientific and business intelligence software. We want to support, participate in, and amplify this trend. By open-sourcing Plotly's core technology, everyone benefits from peer-review and Plotly's products will continue to be the most cutting-edge offering for exploratory visualization. Plotly.js has the quality, accessibility, and scope to be the charting standard for the Web, but we can only achieve this breadth by working across communities and making the distribution truly unencumbered, portable, and free.
Despite the possibilities that the web offers, the core plotting libraries in scientific software like MATLAB, R, and Python still create static image files rather than dynamic, interactive charts. Many technical and scientific projects still don't embrace web technology because of JavaScript libraries being commercially developed, expensive, narrow in scope, or difficult to learn and use. By open-sourcing Plotly’s easy-to-use, comprehensive library, Plotly hopes to bring the power of interactive plotting to every developer, team, data scientist, and analyst.
Plotly.js was instigated by Dr. Alex Johnson and has been in development for over 3 years.
Access the GitHub repository here.
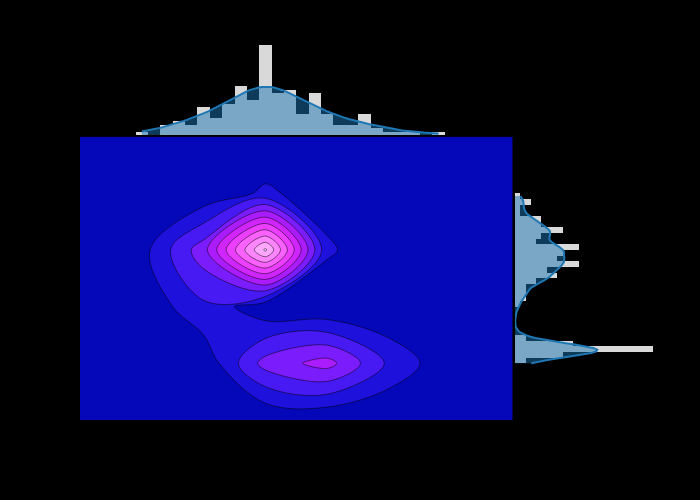
A contour density plot drawn with plotly.js. Visit the plotly.js documentation to to get started.
Plotly.js Highlights
Seven details that make the project unique
Scientific grade. Plotly.js is comparable in scope and features to MATLAB or Python’s matplotlib, but written in JavaScript, the language of the Web.
SVG & WebGL backends. Plotly.js uses both D3.js (SVG) and WebGL for graphics rendering. WebGL allows interactive rendering of hundreds of thousands to millions of x-y points, while D3.js is more practical for up to tens of thousands of points and vector-quality image export.
Testing framework. For code contributors, the plotly.js image testing framework makes it the most stable JavaScript charting library available.
User documentation. The plotly.js documentation is hosted on GitHub pages and is open-source under a Creative Commons license.
No dependencies. Plotly.js is an “all-in-one bundle” with d3.js and stack.gl modules baked-in.
No jQuery. jQuery has been removed from plotly.js for significantly better performance and improved browser compatibility.
Powered by a JSON schema Plotly.js is based on a new open-source JSON schema for creating, saving, and sharing scientific charts.
A new JSON schema for data visualization
Plotly.js is based on a declarative, open-source JSON schema that attempts to describe every physical aspect of any scientific chart. With this approach, the role of plotly.js is simple: plotly.js takes the JSON specification of a chart and produces it as an interactive visualization.
The JSON schema makes Plotly charts language agnostic - They can be easily translated from one format to another:
Browse Plotly’s community-created chart feed and append “.json” to the URL of any chart to see its JSON specification.
Distinction from vega and vega-lite
The plotly.js JSON schema and API is more like MATLAB or Python’s matplotlib than most JavaScript charting libraries available. It focuses on the chart’s physical attributes and attempts to leave the chart data separate (a workflow that scientists and engineers are accustomed to). For chart types that require binning (contour plots, histograms) or min-max decimation (line plots with >100k lines), some precomputation in JavaScript has been unavoidable.
The vega and vega-lite schemas are more opinionated in prescribing how the chart data is grouped, sliced, or statistically processed before graphical display. This allows for complicated chart display with a concise JSON description, but leaves less control to the user. Neither approach is more “correct”—they’re just different.
Implications for developers
JavaScript Developers
The latest full version of plotly.js is available for free, unlimited use in any project. Plotly.js code uses the MIT open-source license, the same license used by Bootstrap.js. The MIT open-source license puts no restrictions on how the code is used. Licensees who have previously purchased a plotly.js commercial license will no longer be charged the annual license fee and are encouraged to update to the latest plotly.js version under the MIT license.
The latest version of plotly.js can be downloaded from GitHub or the documentation home.
