

I decided to spend a few hours on Stetho[1].
Stetho is a sophisticated debug bridge for Android applications.
How to enable it
It is very simple to enable Stetho.
Just add these lines to your
Now the last step: Run the application and just open Chrome on your pc (where the device is plugged).
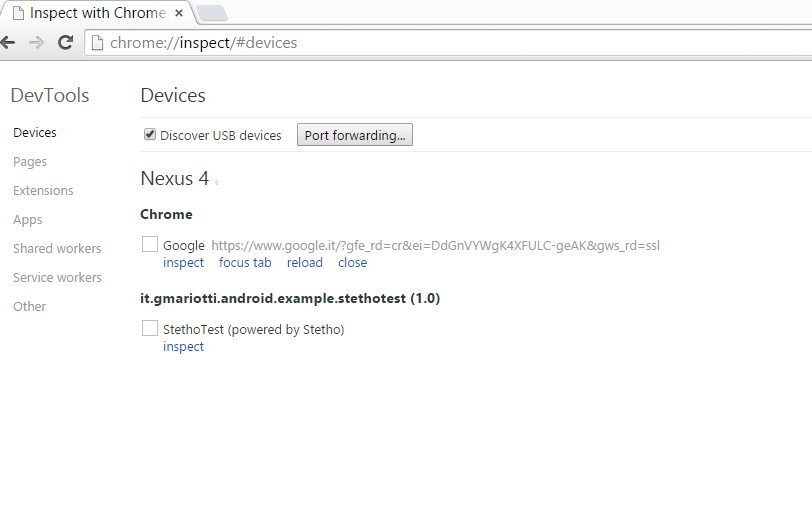
In your chrome just navigate on chrome://inspect
 [2]
[2]
As you can see in the image you can see 2 apps running in my device (I love Nexus4 for this kind of tests....)
Here you can open a magical world...clicking the inspect link.
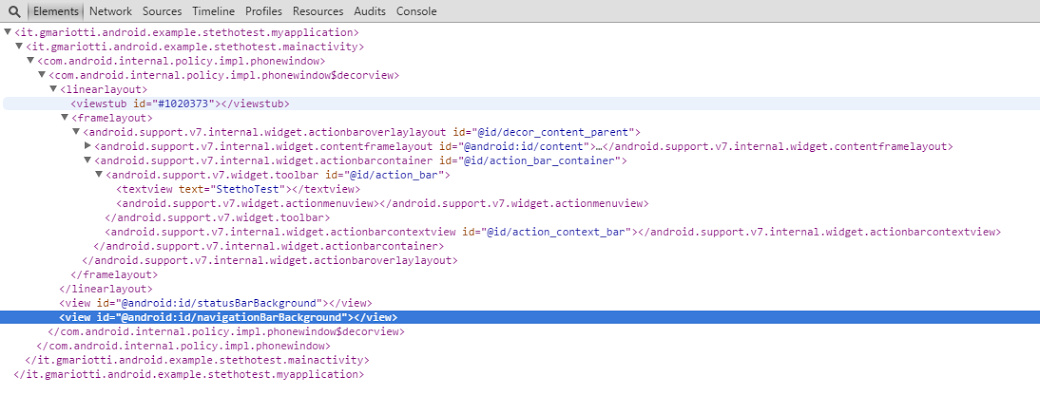
First of all you can see the elements tab.
 [3]
[3]
Here you can navigate in the elements inside your Activity......
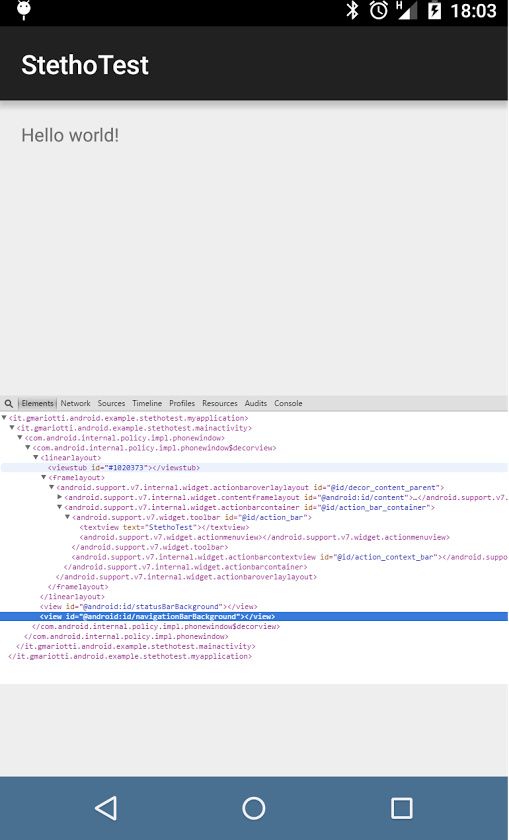
Here a first surprise...clicking on the entry on the tab, the element is highlighted on the device !
 [4]
[4]
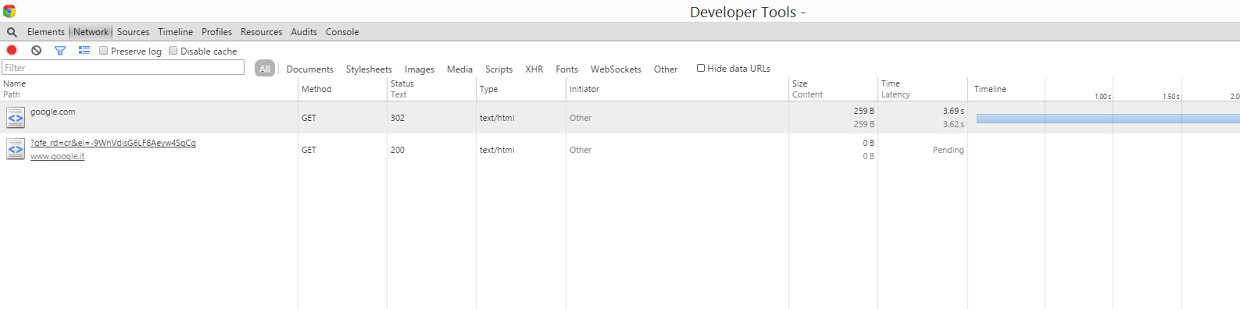
The network tab.
If you work with the Chrome Developer Tools, you know it very well. Here you can see the network calls with their data.
In my app I do a simple call with okhttp
 [5]
[5]
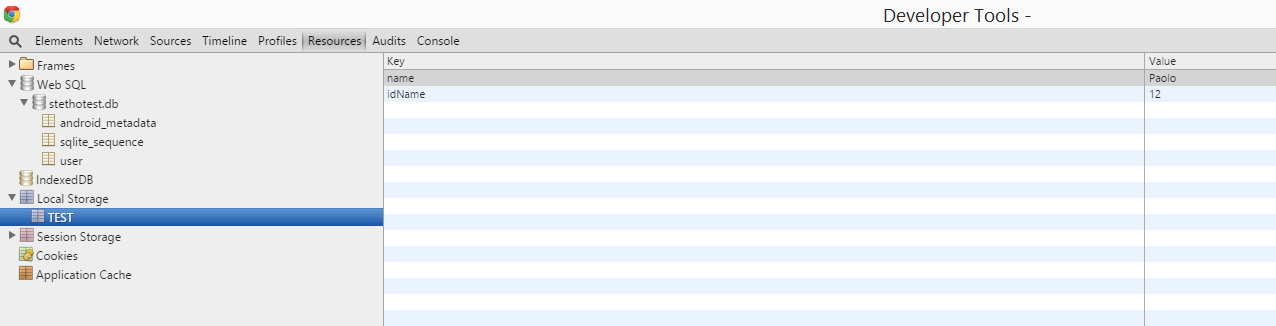
The Resources tab.
In my sample app I am setting a simple value in the SharedPreferences.
 [6]
[6]
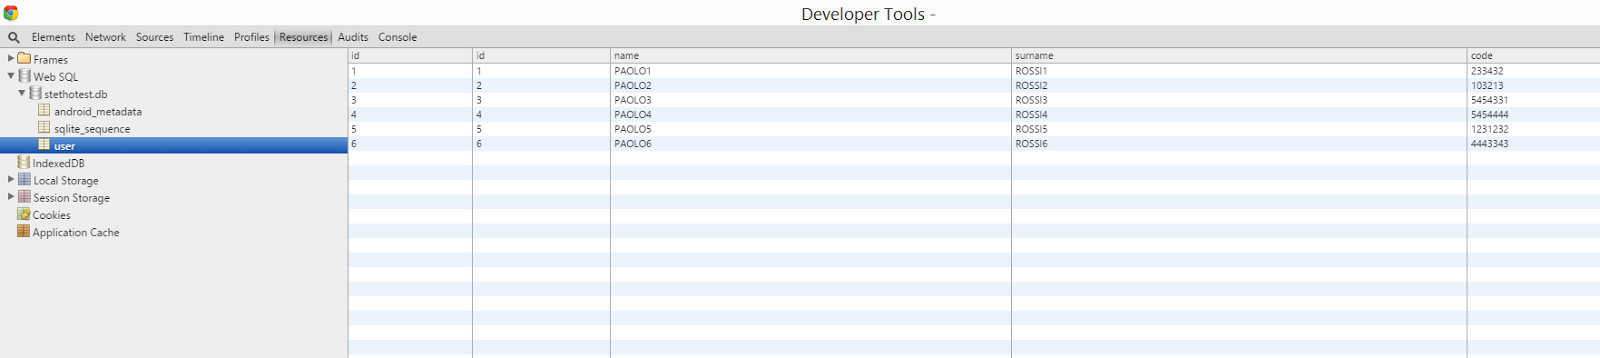
Also I use a simple SQLiteOpenHelper to manage a very small database with just a table.
 [7]
[7]
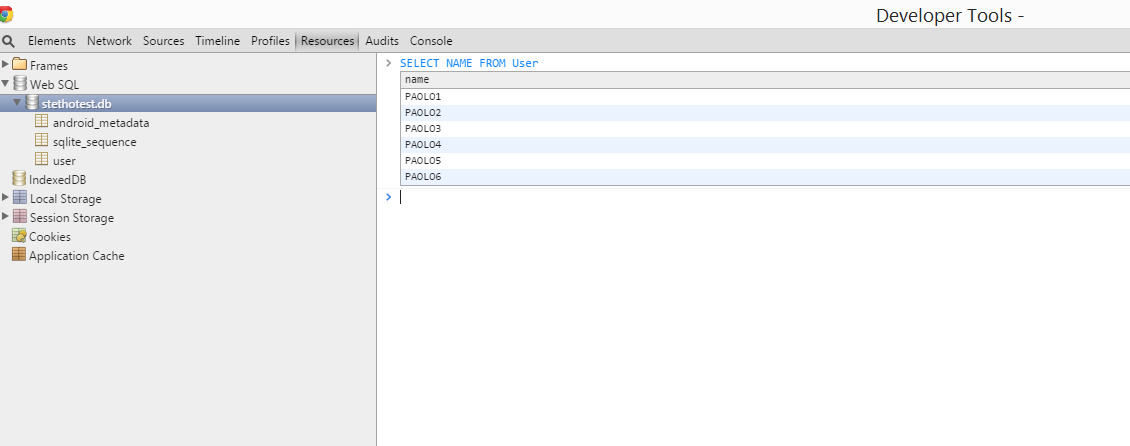
And you can run queries on your db...(!)
 [8]
[8]
Of course it is only a first glance at this tool but it is enough to check the power of this debug tool.
You can get code from GitHub[9]
Stetho is a sophisticated debug bridge for Android applications.
How to enable it
It is very simple to enable Stetho.
Just add these lines to your
buildgradle:
dependencies // Stetho core
    compile 'com.facebook.stetho:stetho:1.1.1'//If you want to add a network helper
    compile 'com.facebook.stetho:stetho-okhttp:1.1.1'
Then
in your Application you can enable the tool just adding: StethoinitializeStethonewInitializerBuilderenableDumpappStethodefaultDumperPluginsProviderenableWebKitInspectorStethodefaultInspectorModulesProviderbuildIn my simple application, I have a network call with okhttp-client , a simple value in the shared preferences, and a small db with one table.
Now the last step: Run the application and just open Chrome on your pc (where the device is plugged).
In your chrome just navigate on chrome://inspect

As you can see in the image you can see 2 apps running in my device (I love Nexus4 for this kind of tests....)
- Chrome
- My Stetho Test App
Here you can open a magical world...clicking the inspect link.
First of all you can see the elements tab.

Here you can navigate in the elements inside your Activity......
Here a first surprise...clicking on the entry on the tab, the element is highlighted on the device !

The network tab.
If you work with the Chrome Developer Tools, you know it very well. Here you can see the network calls with their data.
In my app I do a simple call with okhttp
OkHttpClient client OkHttpClient
        clientnetworkInterceptorsStethoInterceptorRequest request RequestBuilder"https://google.com"build

        clientnewCallrequestenqueueCallback@Overridepublic onFailureRequest requestIOException//do something@Overridepublic onResponseResponse response throws IOException//do something
Here
the tab:

The Resources tab.
In my sample app I am setting a simple value in the SharedPreferences.
SharedPreferencesEditor editor  getSharedPreferences"TEST" MODE_PRIVATE
        editorputString"name""Paolo"
        editorputInt"idName"
        editorcommit
You can check this value in the navigating in
the Local Storage entry.

Also I use a simple SQLiteOpenHelper to manage a very small database with just a table.
privatestatic final String CREATE_DATABASE "CREATE TABLE " TBL_USR
            TBL_USR_CLMN_ID " INTEGER PRIMARY KEY AUTOINCREMENT NOT NULL, "
            TBL_USR_CLMN_NAME " TEXT NOT NULL, "
            TBL_USR_CLMN_SURNAME " TEXT NOT NULL, "
            TBL_USR_CLMN_CODE " INTEGER NOT NULL DEFAULT 0 "@Overridepublic onCreateSQLiteDatabaseexecSQLCREATE_DATABASEexecSQL"INSERT INTO " TBL_USR  TBL_USR_CLMN_NAME   TBL_USR_CLMN_SURNAME  TBL_USR_CLMN_CODE  "  VALUES('PAOLO1','ROSSI1', 233432 )"execSQL"INSERT INTO " TBL_USR  TBL_USR_CLMN_NAME   TBL_USR_CLMN_SURNAME  TBL_USR_CLMN_CODE  "  VALUES('PAOLO2','ROSSI2', 103213 )"execSQL"INSERT INTO " TBL_USR  TBL_USR_CLMN_NAME   TBL_USR_CLMN_SURNAME  TBL_USR_CLMN_CODE  "  VALUES('PAOLO3','ROSSI3', 5454331 )"execSQL"INSERT INTO " TBL_USR  TBL_USR_CLMN_NAME   TBL_USR_CLMN_SURNAME  TBL_USR_CLMN_CODE  "  VALUES('PAOLO4','ROSSI4', 5454444 )"execSQL"INSERT INTO " TBL_USR  TBL_USR_CLMN_NAME   TBL_USR_CLMN_SURNAME  TBL_USR_CLMN_CODE  "  VALUES('PAOLO5','ROSSI5', 1231232 )"execSQL"INSERT INTO " TBL_USR  TBL_USR_CLMN_NAME   TBL_USR_CLMN_SURNAME  TBL_USR_CLMN_CODE  "  VALUES('PAOLO6','ROSSI6', 4443343 )"
You
can navigate on the data on the WebSQL entry.

And you can run queries on your db...(!)

Of course it is only a first glance at this tool but it is enough to check the power of this debug tool.
You can get code from GitHub[9]
