引入依赖
import numpy as np
import pandas as pd
import matplotlib.pyplot as plt
from matplotlib import colors as mcolors
显示中文和负号
plt.rcParams["font.sans-serif"] = ["SimHei"]
plt.rcParams['font.size'] = 10
数据预处理
lipstick = pd.read_csv('./lipstick_v2.csv', encoding='UTF8')

areas = lipstick.groupby(['location'])['sales'].sum()
print(areas.sort_values(ascending=False).to_string())

area_list = ['北京', '上海', '广东', '浙江', '江苏', '湖北',
             '新西兰|韩国|美国|土耳其|日本|加拿大|法国|德国|英国|丹麦|海外']
data = []
for area in area_list:
    data.append(areas[areas.index.str.contains(area)].sum())
data.append(6494.065319999994)
print(data)
area_list = ['北京', '上海', '广东', '浙江', '江苏', '湖北', '海外', '其他']
生成随机色
colors = list(mcolors.CSS4_COLORS.keys())
random_colors = np.random.choice(colors, len(area_list))
color1 = ['#71ae46', '#96b744', '#c4cc38', '#ebe12a', '#eab026', '#e3852b', '#d85d2a', '#ce2626']
color2 = ['#c82d31', '#625ba1', '#898989', '#9c9800', '#007f54', '#a195c5', '#103667', '#f19272']
color3 = ['#0e72cc', '#6ca30f', '#f59311', '#fa4343', '#16afcc', '#85c021', '#d12a6a', '#0e72cc']
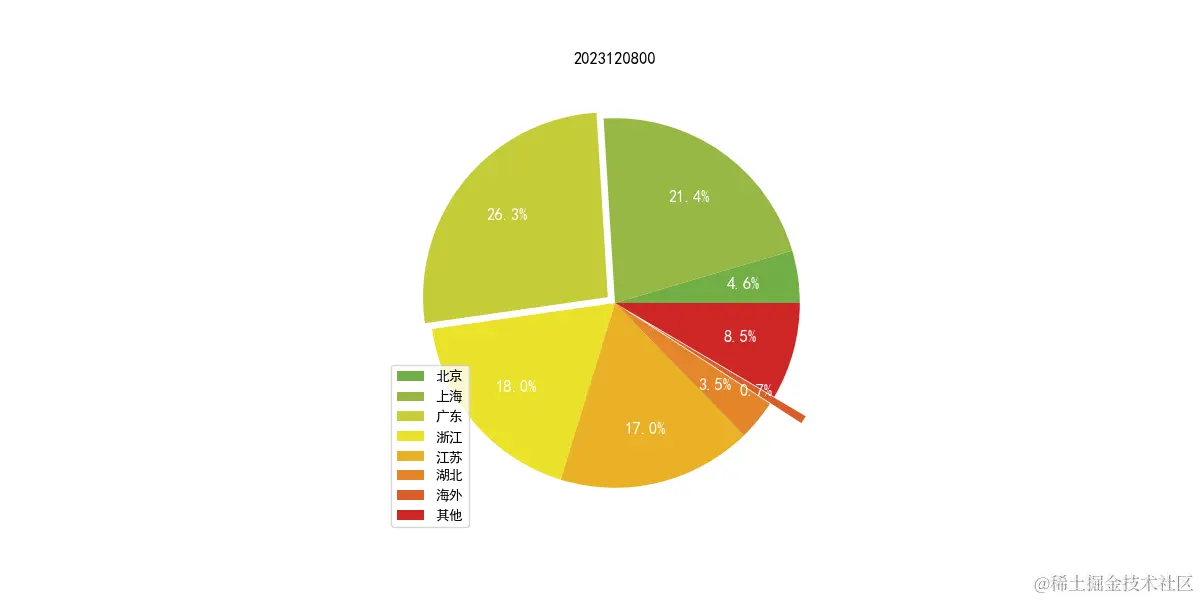
绘制饼图
plt.figure(figsize=(12, 6))

plt.pie(data,
        labels=area_list,
        colors=color1,
        explode=[0, 0, 0.05, 0, 0, 0, 0.2, 0],
        textprops={'color': 'w', 'fontsize': 12},
        pctdistance=0.7,
        autopct='%0.1f%%'
        )
plt.legend(loc='lower left')
plt.title('2023120800')
plt.show()
效果图