引入依赖
from datetime import datetime
import pandas as pd
import matplotlib.pyplot as plt
显示中文和负号
plt.rcParams['font.family'] = 'SimHei'
plt.rcParams['axes.unicode_minus'] = False
数据预处理
df = pd.read_excel('movie_box_office.xlsx')
df_a = df[df['电影名称'] == '第八个嫌疑人']
time = df_a['日期']
box_office = df_a['累计票房'].div(100000000)
y = [0, 1, 2, 3, 4, 4]
x = [time[box_office[box_office < 1].idxmin()], time[box_office[box_office > 1].idxmin()],
time[box_office[box_office > 2].idxmin()], time[box_office[box_office > 3].idxmin()],
time[box_office[box_office > 4].idxmin()], time.iloc[0]]
ind = [0]
for i in range(len(x) - 1):
delta = datetime.strptime(x[i + 1], '%Y-%m-%d') - datetime.strptime(x[i], '%Y-%m-%d')
ind.append(ind[i] + delta.days)
formatted_dates = [datetime.strptime(date, '%Y-%m-%d').strftime('%m月%d日') for date in x]
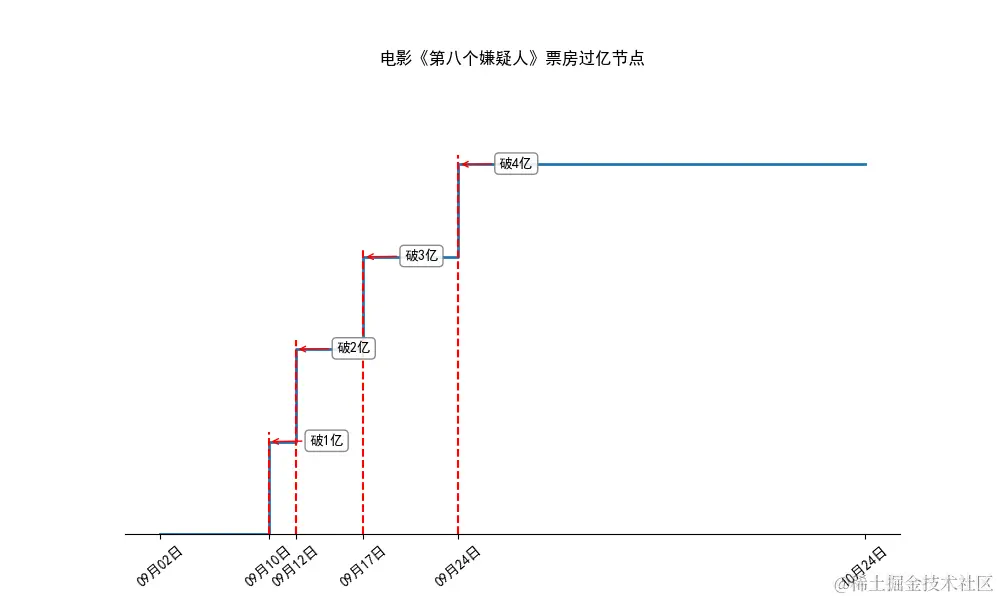
绘制阶梯图
plt.figure(figsize=(10, 6))
plt.step(ind, y, where='post', lw=2)
plt.xticks(ind, formatted_dates, rotation=40)
plt.yticks([])
plt.title('电影《第八个嫌疑人》票房过亿节点')
plt.ylim(0, 5)
for index in range(len(ind) - 2):
plt.plot([ind[index + 1], ind[index + 1]], [0, index + 1 + 0.1], c='r', linestyle='--')
plt.annotate('破' + str(index + 1) + '亿', xy=(ind[index + 1], index + 1),
xytext=(ind[index + 1] + 3, index + 0.96),
arrowprops=dict(arrowstyle='->', edgecolor='red'),
bbox=dict(boxstyle="round", fc="w", ec="0.5", alpha=0.9))
plt.gca().spines['top'].set_color('none')
plt.gca().spines['right'].set_color('none')
plt.gca().spines['left'].set_color('none')
plt.show()
效果图