

前言
在开发可视化相关的业务时,有时候会遇到让我们实现中国省市区地图下钻的功能。
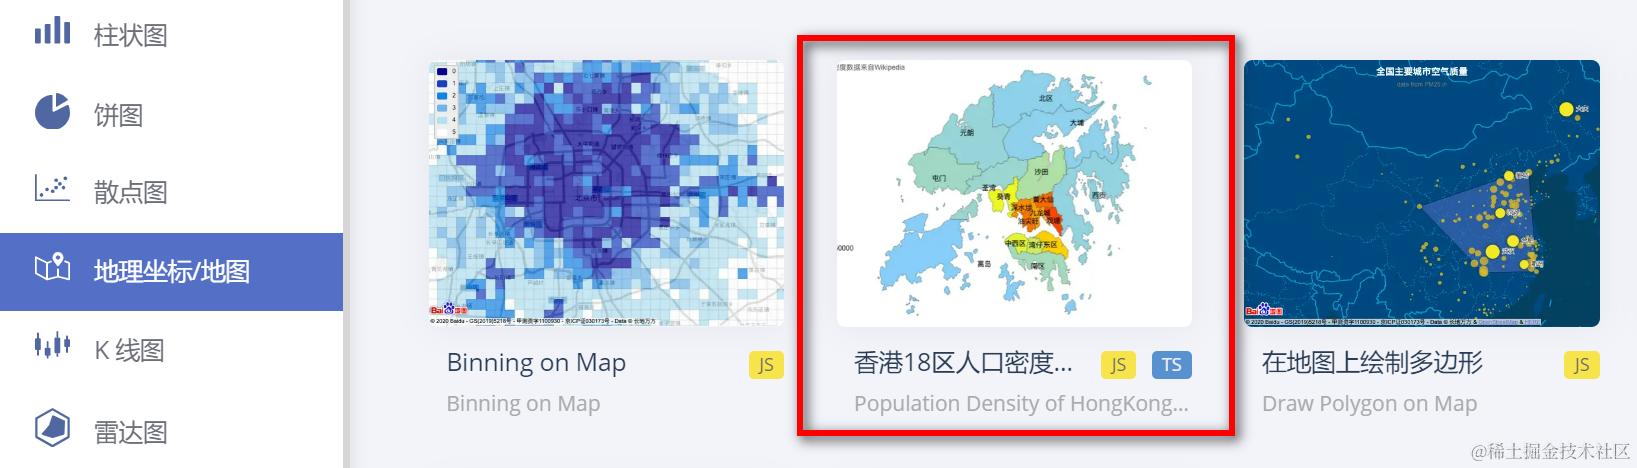
具体业务场景为当我们点击省份的时候,跳转到对应的省份地图,再次点击省份地图中的区,接着跳转到对应的区地图,下图是阿里云可视化平台 DataV.GeoAtlas 中的一个示例,我们使用 Echarts 实现类似的业务。
安装 Echarts
以 Vue3 前端框架为例,在项目根目录命令行终端输入 npm install echarts 安装 echarts 依赖,然后在项目中新建一个 .vue 文件,在该文件中初始化 echarts。
<template>
  <div ref="mapChart" style="height: 500px"></div>
</template>

<script setup>
  import axios from 'axios'
  import { ref, onMounted } from 'vue'
  import * as echarts from 'echarts'

  const mapChart = ref(null)
  const initMyChart = ref()

  onMounted(() => {
    initMyChart.value = echarts.init(mapChart.value)
    initChart()
  })

  // 初始化
  const initChart = () => {
    var option
    option = {
      xAxis: {
        type: 'category',
        data: ['Mon', 'Tue', 'Wed', 'Thu', 'Fri', 'Sat', 'Sun']
      },
      yAxis: {
        type: 'value'
      },
      series: [
        {
          data: [120, 200, 150, 80, 70, 110, 130]
          type: 'bar'
        }
      ]
    }

    option && initMyChart.value.setOption(option)
  }
</script>
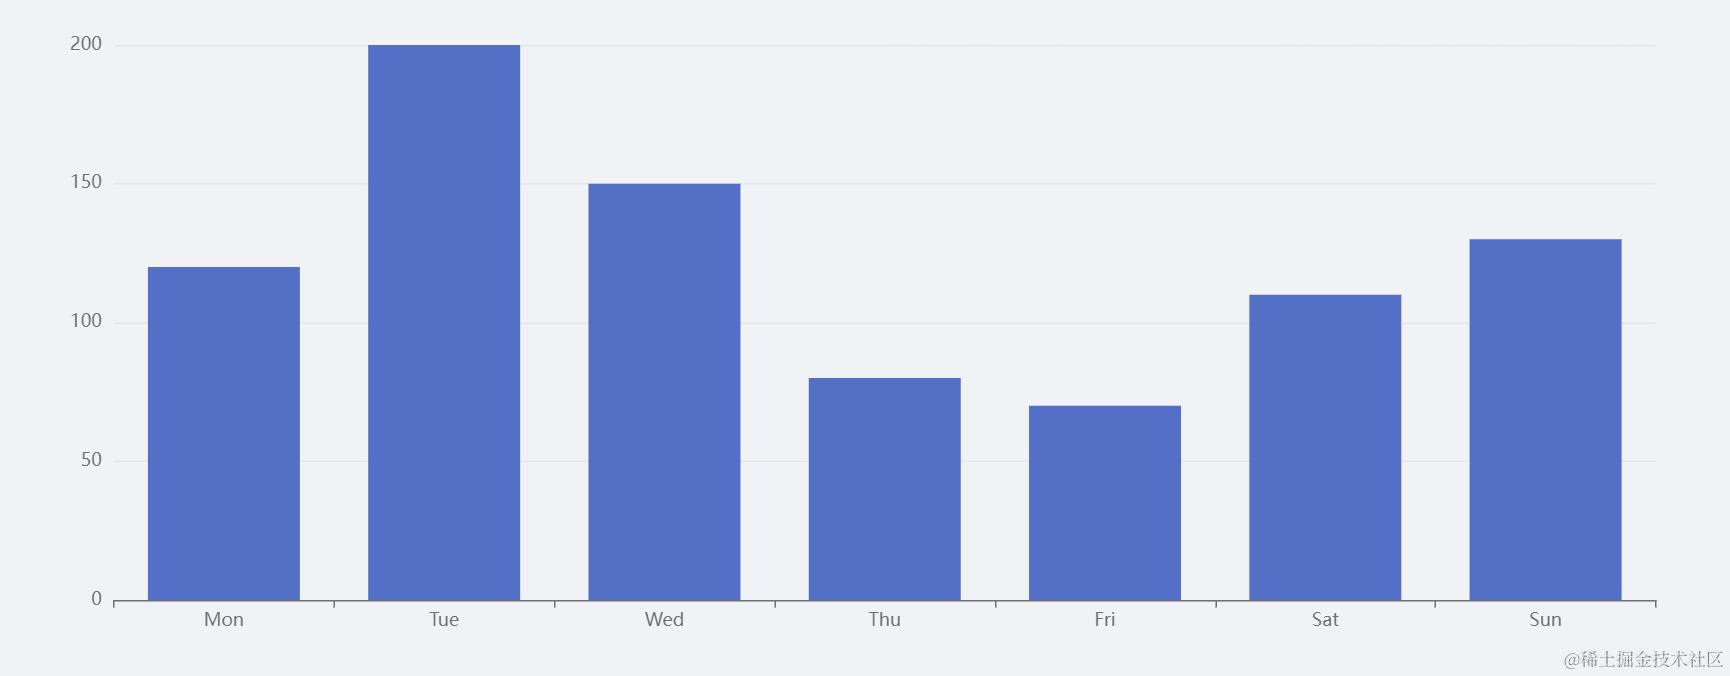
上述代码的意思是,先以柱状图为例初始化 Echarts 看看能否正常运行,然后再根据官网中的示例和配置项手册边调试边开发。
实现下钻功能
要使用 Echarts 开发地图,我们可以先参考官网中的地理坐标/地图示例。
获取地图数据
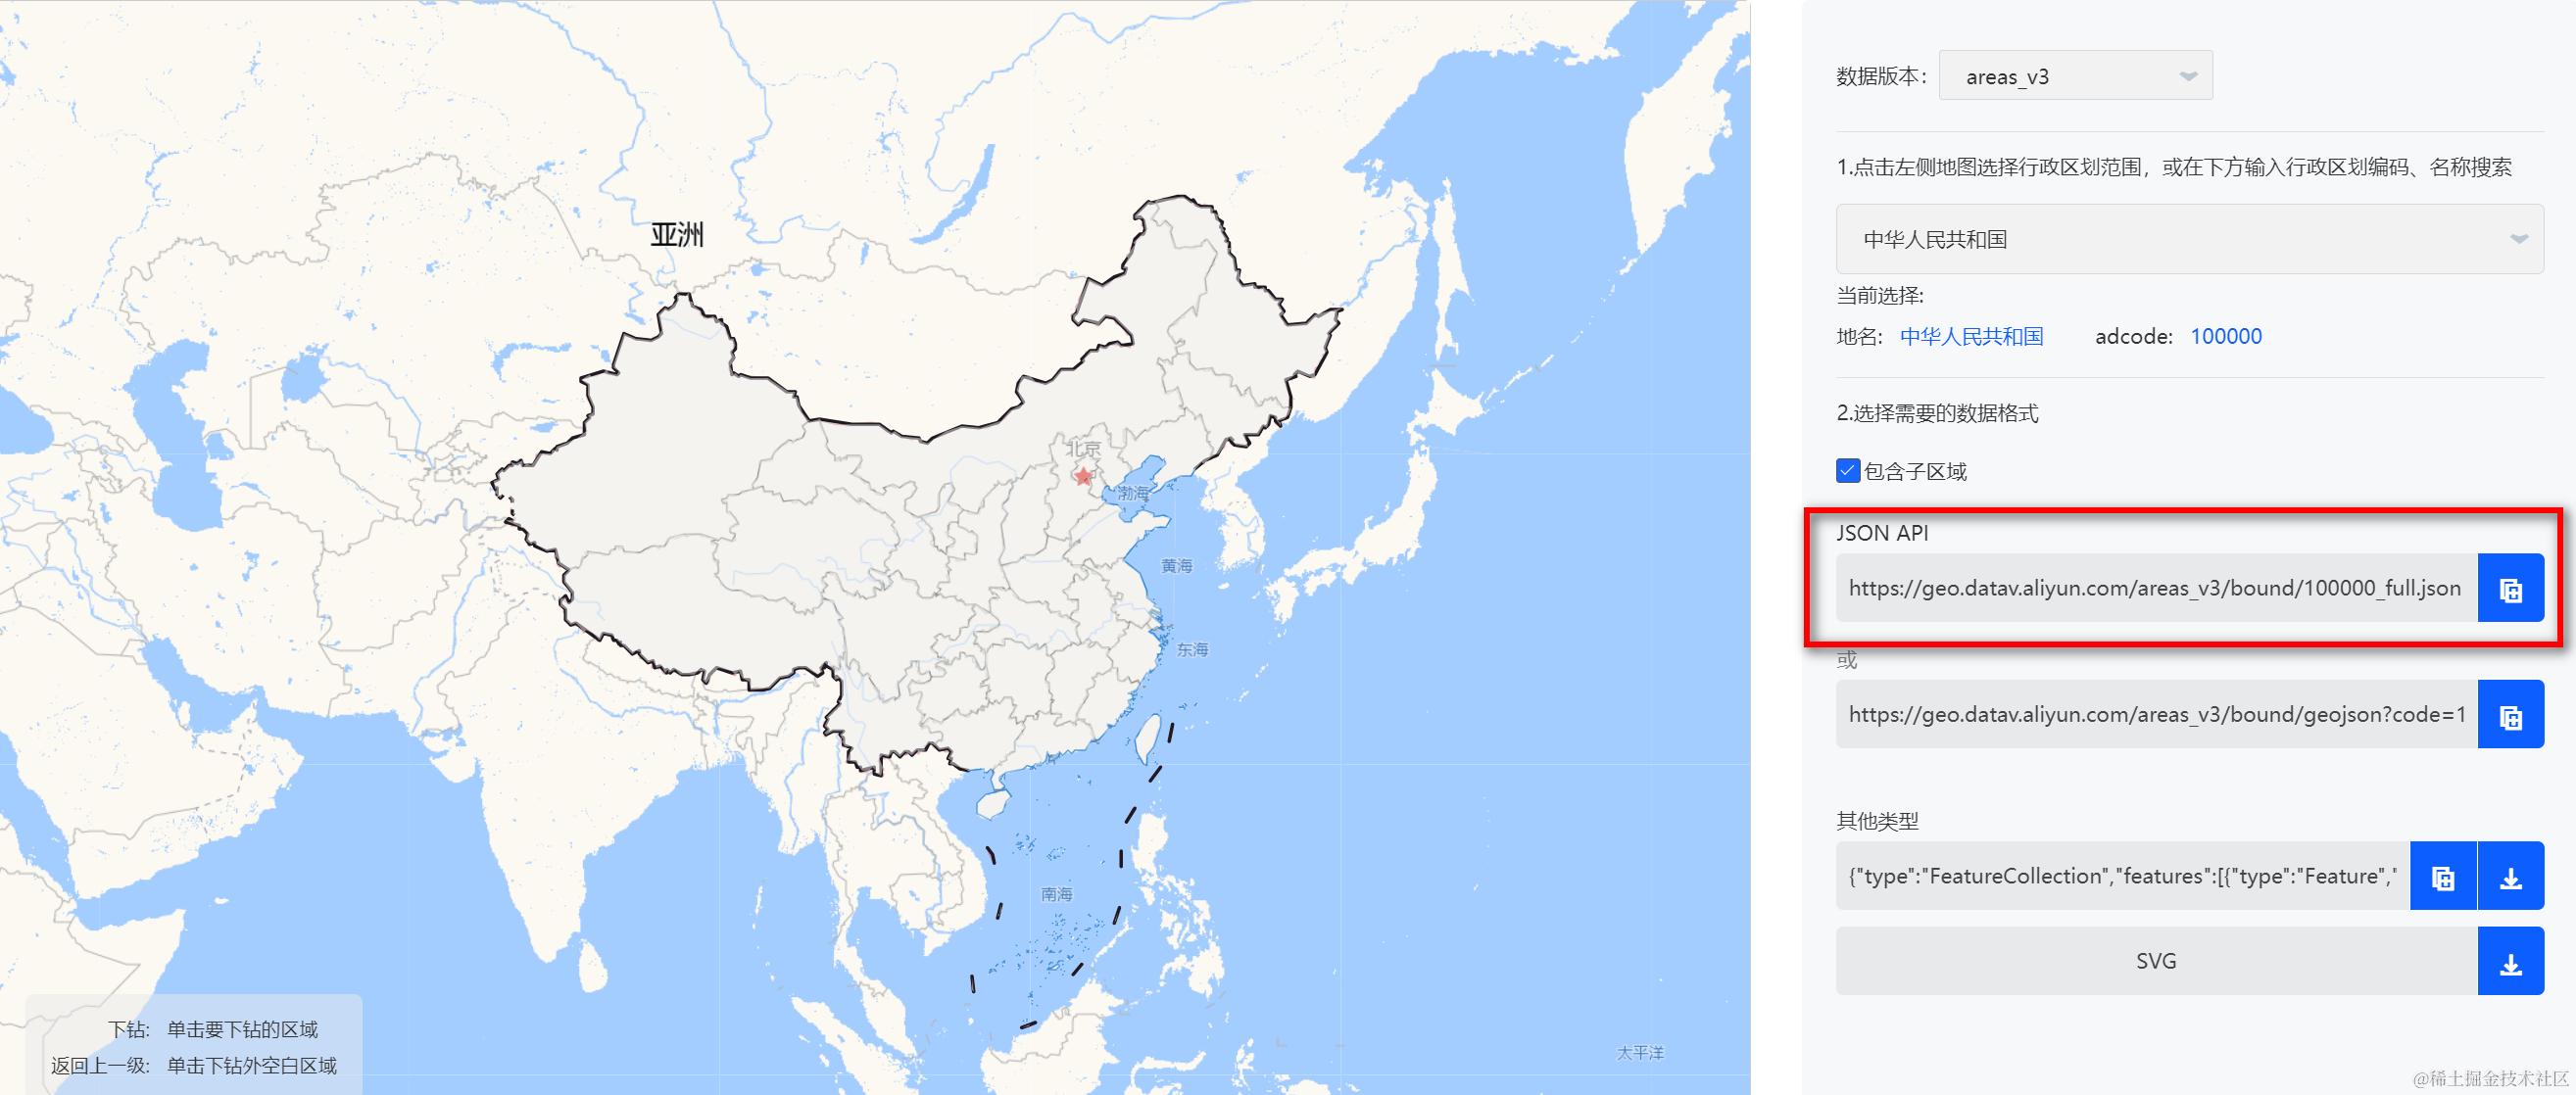
实现地图的展示效果,肯定是需要数据来支撑的,我们可以借助阿里云可视化平台 DataV.GeoAtlas 中提供的接口来进行测试和调试。
要想实现地图类型,上述代码中的配置项 option 中的 xAxis 和 yAxis 是不需要的,因为这是实现柱状图所需要的两个配置,保留 series 并把其中的 type 改为 'map',设置为地图类型。
接着在代码中新增一个用于获取地图数据的函数,用于在项目挂载的时候调用函数获取接口数据。
//获取地图数据
const getMapData = (map) => {
  axios
    .get(`https://geo.datav.aliyun.com/areas_v3/bound/${map}_full.json`)
    .then((res) => {
      if (res.status == '200') {
        console.log('data', res.data)
      }
    })
    .catch((err) => {
      console.log(err)
    })
}
实现地图展示
要想实现地图的展示,需要调用 Echarts 提供的 registerMap 函数来注册地图。
该函数需要传两个参数,第一个参数为要注册地图的名称 mapName,第二个参数为要注册地图的数据,大多数情况下为 geoJSON 格式的数据,完整代码如下。
<template>
  <div ref="mapChart" style="height: 500px"></div>
</template>

<script setup>
  import axios from 'axios'
  import { ref, onMounted } from 'vue'
  import * as echarts from 'echarts'

  const mapChart = ref(null)
  const initMyChart = ref()
  const initAdCode = ref(100000) // 默认地图的编码
  const currentMapName = ref('中国') // 默认地图的名称

  onMounted(() => {
    initMyChart.value = echarts.init(mapChart.value)
    getMapData(initAdCode.value)
  })

  // 初始化
  const initChart = (mapName, mapData) => {
    echarts.registerMap(mapName, mapData)
    var option
    option = {
      series: [
        {
          type: 'map',
          map: mapName, // 注册地图的名称
          zoom: '1.5', // 当前视角的缩放比例
          label: {
            show: true // 是否显示省份名字
          },
          data: []
        }
      ]
    }

    option && initMyChart.value.setOption(option)
  }

  //获取地图数据
  const getMapData = (map) => {
    axios
      .get(`https://geo.datav.aliyun.com/areas_v3/bound/${map}_full.json`)
      .then((res) => {
        if (res.status == '200') {
          initChart(currentMapName.value, res.data)
        }
      })
      .catch((err) => {
        console.log(err)
      })
  }
</script>
这样,一个最基本的地图就展示出来,默认当点击某一个省份的时候,此区域就会高亮显示。
Echarts 官网中的 series-map 配置项中提供很多自定义的配置,我们参考文档进行以下美化工作。
- 设置
roam: true给地图开启鼠标缩放和平移漫游。 - 设置
itemStyle.borderType给地图增加图形的描边类型。 - 设置
itemStyle.borderColor给地图增加图形的描边颜色。 - 设置
emphasis.itemStyle.areaColor给地图增加当鼠标移入时高亮状态下地图区域的颜色。 - 设置
emphasis.itemStyle.borderColor给地图增加当鼠标移入时高亮状态下图形的描边颜色。
修改后的 option 配置代码如下。
option = {
  series: [
    {
      type: 'map',
      map: mapName, // 注册地图的名称
      zoom: '1.5', // 当前视角的缩放比例
      label: {
        show: true // 是否显示省份名字
      },
      data: [],
      roam: true, // 是否开启缩放和平移
      itemStyle: {
        borderColor: '#F59A23',
        borderType: 'dashed'
      },
      emphasis: {
        itemStyle: {
          // 设置鼠标移上去的样式
          borderColor: '#34AEAE',
          areaColor: '#CCEBEB'
        }
      }
    }
  ]
}
修改后的 option 配置效果图如下。
实现下钻功能
实现地图下钻功能的原理很简单,只需要在点击区域的时候获取当前选中的 code 值,点击之后通过 code 值再次请求接口数据,重新渲染即可。
在上述代码中新增点击事件功能,并且在获取地图数据之后整理一份当前选中的省市区的所有名称和编码数据,用于匹配获取当前点击区域的 code 值。
<template>
  <div ref="mapChart" style="height: 500px"></div>
</template>

<script setup>
  import axios from 'axios'
  import { ref, onMounted } from 'vue'
  import * as echarts from 'echarts'

  const mapChart = ref(null)
  const initMyChart = ref()
  const initAdCode = ref(100000) // 默认地图的编码
  const currentMapName = ref('中国') // 默认地图的名称
  const adCodeMap = ref([]) // 当前选中省市区的所有名称和编码

  onMounted(() => {
    initMyChart.value = echarts.init(mapChart.value)
    getMapData(initAdCode.value)
  })

  // 初始化
  const initChart = (mapName, mapData) => {
    echarts.registerMap(mapName, mapData)
    var option
    option = {
    series: [
      {
        type: 'map',
        map: mapName, // 注册地图的名称
        zoom: '1.5', // 当前视角的缩放比例
        label: {
          show: true // 是否显示省份名字
        },
        data: [],
        roam: false, // 是否开启缩放和平移
        itemStyle: {
          borderColor: '#F59A23',
          borderType: 'dashed'
        },
        emphasis: {
          itemStyle: {
            // 设置鼠标移上去的样式
            borderColor: '#34AEAE',
            areaColor: '#CCEBEB'
          }
        }
      ]
     }
     option && initMyChart.value.setOption(option)

     // 省份下钻点击事件
     mapChart.value.on('click', (params) => {
        console.log(params)
        const adCode = adCodeMap.value.find((item) => item.name == params.name).adcode
        console.log('adCode', adCode)
        if (adCode) {
          currentMapName.value = params.name
          getMapData(adCode)
        }
    })
  }

  // 获取地图数据
  const getMapData = (map) => {
    axios
      .get(`https://geo.datav.aliyun.com/areas_v3/bound/${map}_full.json`)
      .then((res) => {
        if (res.status == '200') {
          initChart(currentMapName.value, res.data)
          // 获取当前选中的省市区的所有名称和编码
          adCodeMap.value = []
            for (let i = 0; i < res.data.features.length; i++) {
              adCodeMap.value.push({
                name: res.data.features[i].properties.name,
                dcode: res.data.features[i].properties.adcode
              })
            }
          }
      })
      .catch((err) => {
        console.log(err)
      })
  }
</script>
最终实现地图下钻功能的代码效果如下。
总结
正是因为 Echarts 的这种高度配置性,才能使我们自定义实现地图的各种效果,Echarts 的功能不止于此,更多丰富的功能还值得我们去探索。
