import React, { useRef, useEffect } from 'react';
import PropTypes from 'prop-types';
import echarts from 'echarts';
const Chart = ({ upLimit, chartData }) => {
const chartRef = useRef(null);
const myChart = useRef(null);
useEffect(() => {
const options = {
tooltip: {
trigger: 'axis',
},
xAxis: {
type: 'category',
data: chartData.map(data => data[0]),
},
yAxis: {
type: 'value',
},
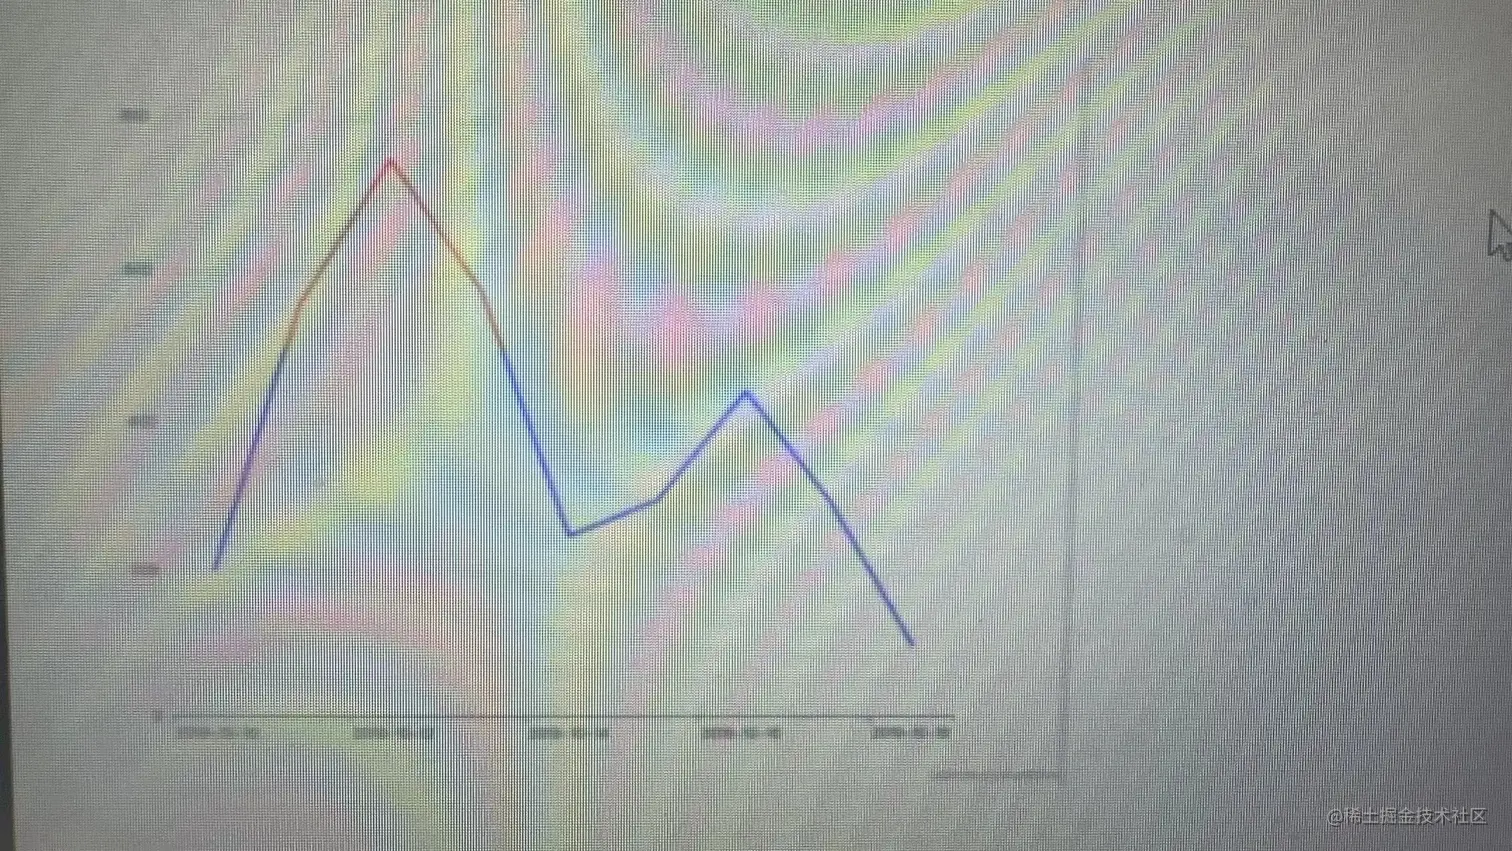
visualMap: {
type: 'piecewise',
show: false,
dimension: 1,
seriesIndex: [0],
pieces: [
{ gt: upLimit, color: 'red' },
{ lt: 0, color: 'blue' },
],
outOfRange: {
color: 'blue',
},
},
series: [
{
name: '线1',
type: 'line',
smooth: false,
symbol: 'none',
lineStyle: {
width: 2,
},
markLine: {
symbol: 'none',
label: {
show: false,
},
lineStyle: {
color: 'red',
},
data: [
{
yAxis: upLimit,
},
],
},
data: chartData,
},
],
};
myChart.current = echarts.init(chartRef.current);
myChart.current.setOption(options);
window.addEventListener('resize', resizeHandler);
return () => {
window.removeEventListener('resize', resizeHandler);
myChart.current.dispose();
};
}, [upLimit, chartData]);
const resizeHandler = () => {
myChart.current && myChart.current.resize();
};
return <div className="chart" ref={chartRef} />;
};
Chart.propTypes = {
upLimit: PropTypes.number,
chartData: PropTypes.arrayOf(PropTypes.arrayOf(PropTypes.any)),
};
Chart.defaultProps = {
upLimit: 500,
chartData: [
['2019-10-10', 200],
['2019-10-11', 560],
['2019-10-12', 750],
['2019-10-13', 580],
['2019-10-14', 250],
['2019-10-15', 300],
['2019-10-16', 450],
['2019-10-17', 300],
['2019-10-18', 100],
],
};
export default Chart;