

Python Matplotlib中的图例是描述图形元素的区域。Matplotlib中的legend()是一个函数,用于在坐标轴上放置图例。
Matplotlib图例
Matplotlib.pyplot.legend()是一个内置的库函数,用于将图例添加到图形中。图例是一个描述,它描述了图形中使用的内容。Legend用于表示x轴和y轴上使用的数值,也可以描述图形中的不同颜色。
语法
matplotlib.pyplot.legend(*args, **kwargs)
参数
matplotlib.pyplot.legend() 函数没有必要的参数。相反, legend() 函数有一些可选参数,其中一些是。
-
- 柄:这是可选的参数。这个参数以一连串的字符串作为值。它与labels参数一起使用,用于将图例与标签一起绘制。
- 标签:这是一个可选参数。这个参数将一系列字符串作为值。这个参数定义了手柄的图例中要使用的标签。
- loc:这是一个可选参数。这个参数以一个字符串作为数值。这个参数描述了图例的保存位置。
- ncols:它以一个整数作为数值。这个参数表示Legend中要保留的列数。
- labelcolor:这个参数以一个字符串或字符串列表作为值。标签的颜色在这个参数中被传递。
- shadow:这个参数需要一个布尔值作为值。如果该值被指定为 "True",那么就会在Legend后面画一个阴影。
- title(标题):这是一个可选的参数。这个参数使用字符串值。在这个参数中给出的值将作为Legend的标题。
- fontsize(字体大小):如果值是一个整数,那么字体大小将被保留为这个参数中传递的值。Legend的字体大小在这个参数中给出。
- labelcolor: 图例文本的颜色在这个参数 中给出。
- facecolor: 图例的背景颜色在这个参数中给出。这个参数中给出的颜色将被保留为图例的背景颜色。
返回值
matplotlib.lengend() 函数返回图形的图例:
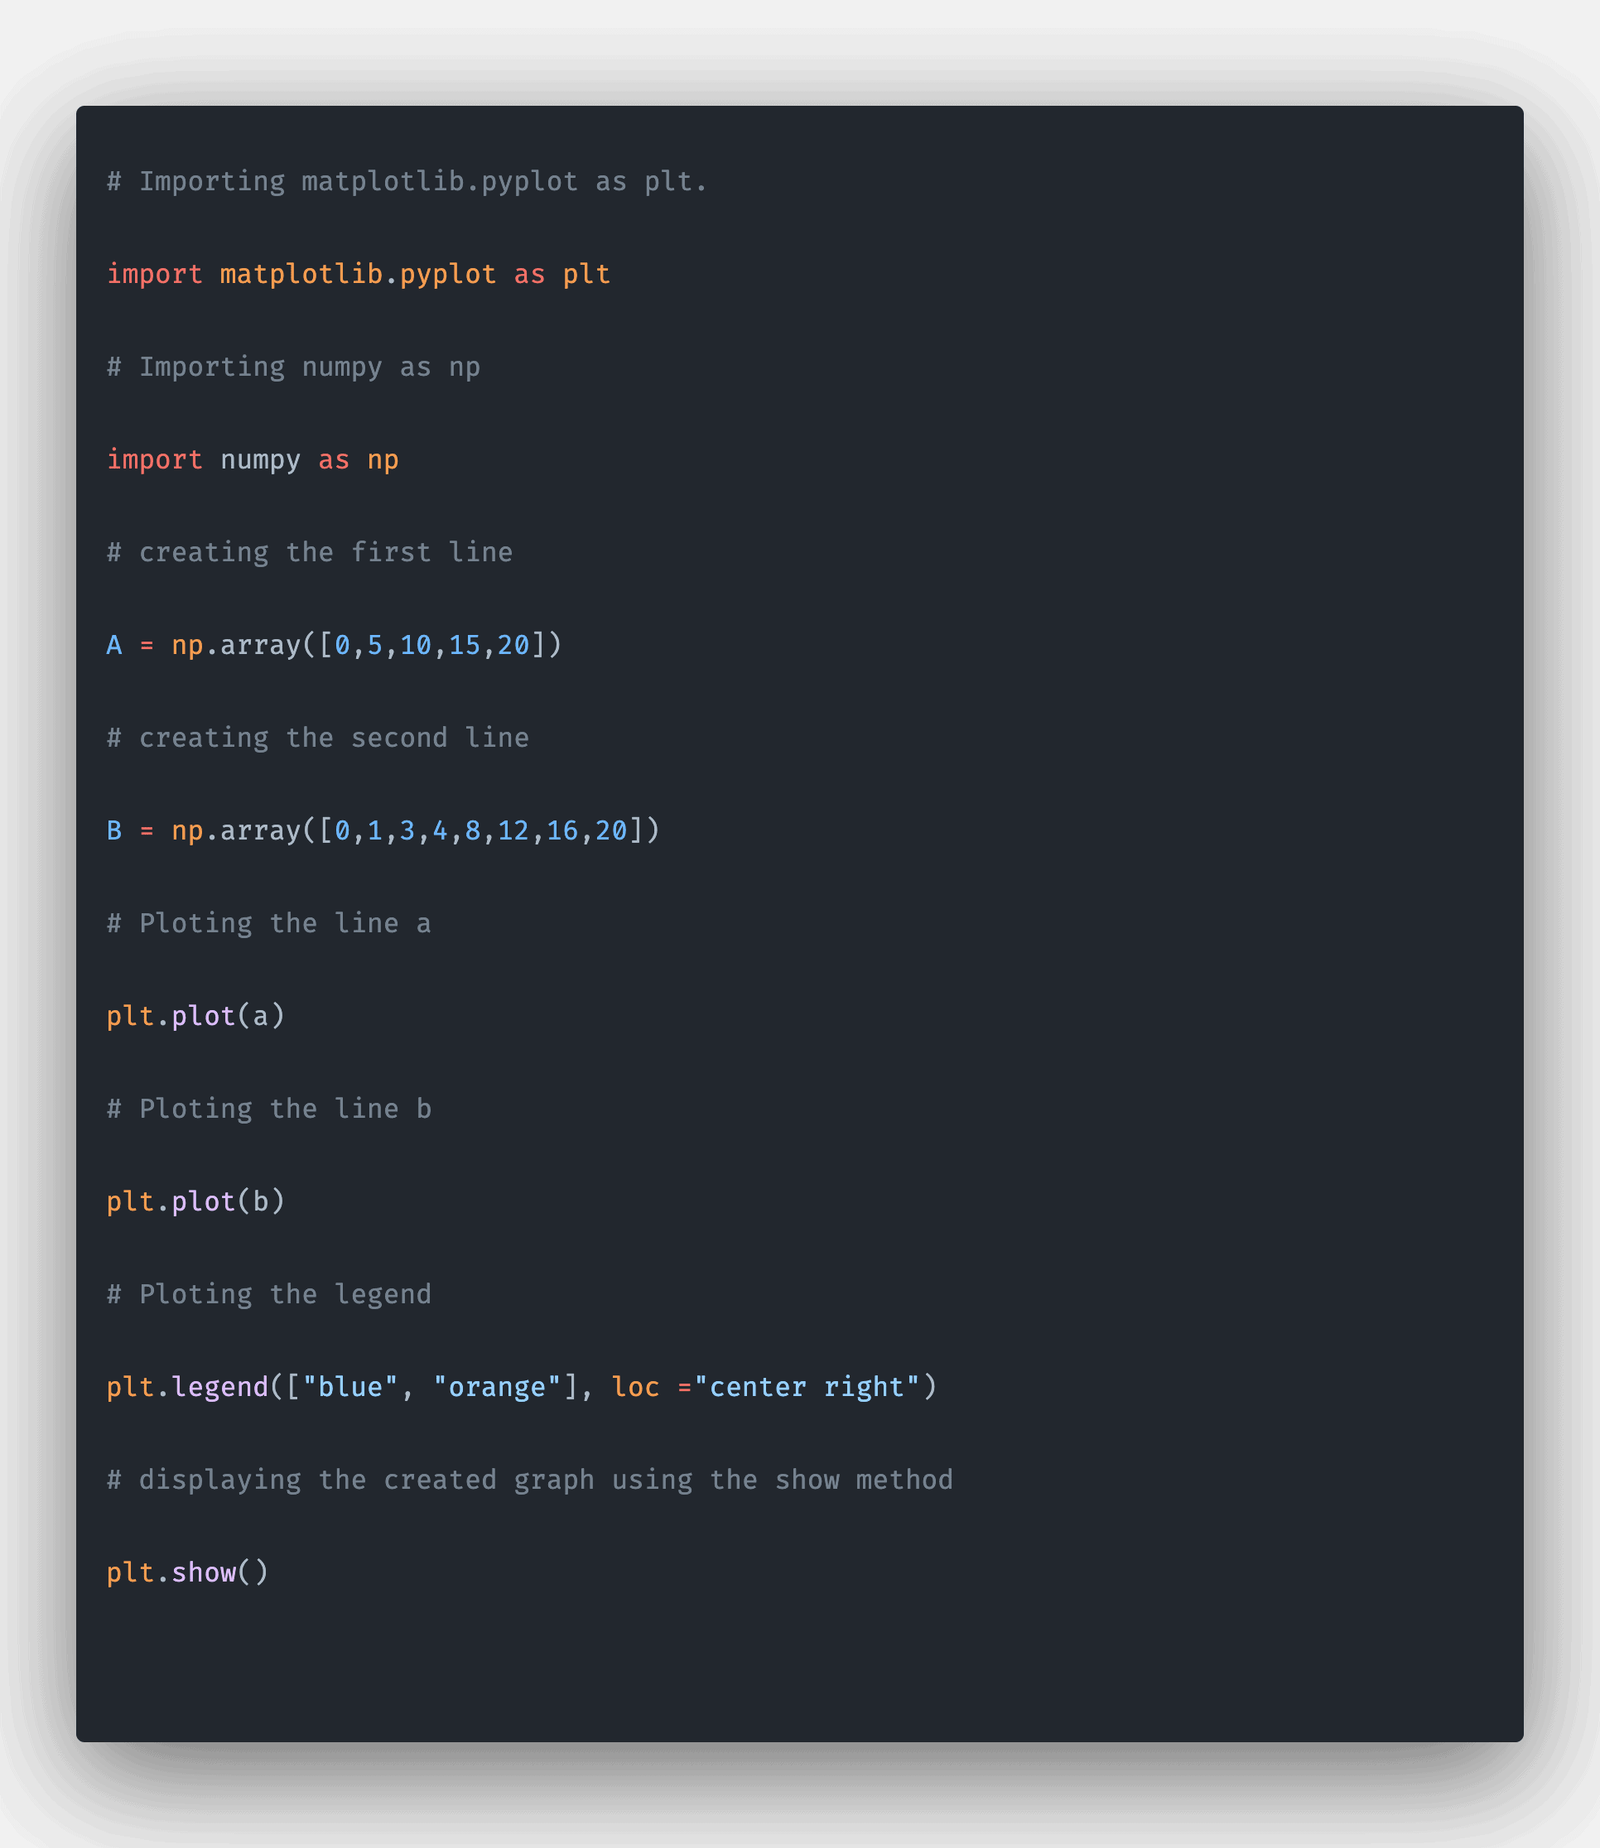
使用matplotlib.pyplot.legend创建图例的程序
# Importing matplotlib.pyplot as plt.
import matplotlib.pyplot as plt

# Importing numpy as np
import numpy as np

# creating the first line
A = np.array([0, 5, 10, 15, 20])

# creating the second line
B = np.array([0, 1, 3, 4, 8, 12, 16, 20])

# Ploting the line a
plt.plot(A)

# Ploting the line b
plt.plot(B)

# Ploting the legend
plt.legend(["blue", "orange"], loc="center right")

# displaying the created graph using the show method
plt.show()
输出
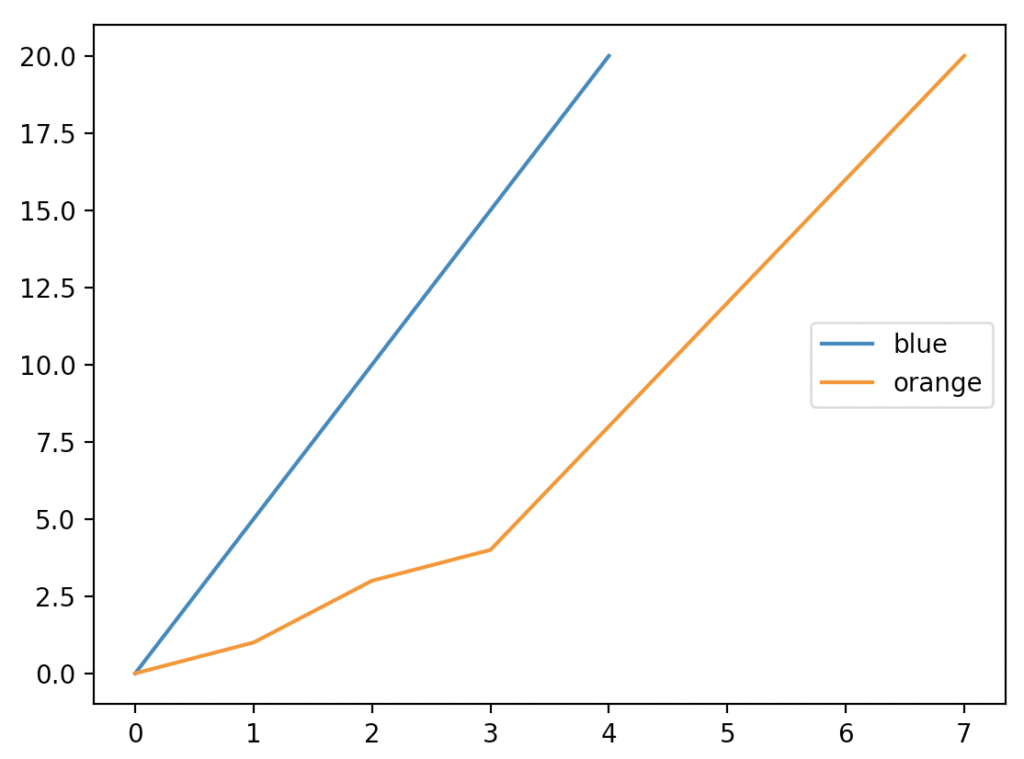
在这个程序中,我们导入了matplotlib.pyplot来绘制两条线。matplotlib库包含了所有用于绘制不同类型图形的函数。
然后,我们导入numpy来创建两个数组来绘制线条。然后,我们用plot函数绘制了这些线。最后,plot函数将点绘制到图形中。
然后,我们绘制了b数组。然后,我们将带有蓝色和橙色标签的图例放在图形上。我们把图例放在了中间偏右的位置。然后,我们用show函数显示了该图。
使用matplotlib.pyplot.legend创建直方图,然后绘制直方图的图例的程序
# Importing matplotlib.pyplot as plt.
import matplotlib.pyplot as plt

# Importing numpy as np
import numpy as np

# Random function is Seeded
np.random.seed(10**7)

# random numbers are created and stored in x variable
x = np.random.randn(1000, 3)

# Number of bins are assigned as 10
num_bins = 10
colr = ["blue", "orange", "green"]

# hist function is used
n, bins, patches = plt.hist(x, num_bins, density=True, color=colr)

# x axis is labeled as X-Axis
plt.xlabel('X-Axis')

# y axis is labeled as Y-Axis
plt.ylabel('Y-Axis')

# Title is kept for the histogram
plt.title('Histogram Example', fontweight="bold")

# Ploting the legend
plt.legend(colr, prop={'size': 15})

# displaying the created graph using the show method
plt.show()
输出
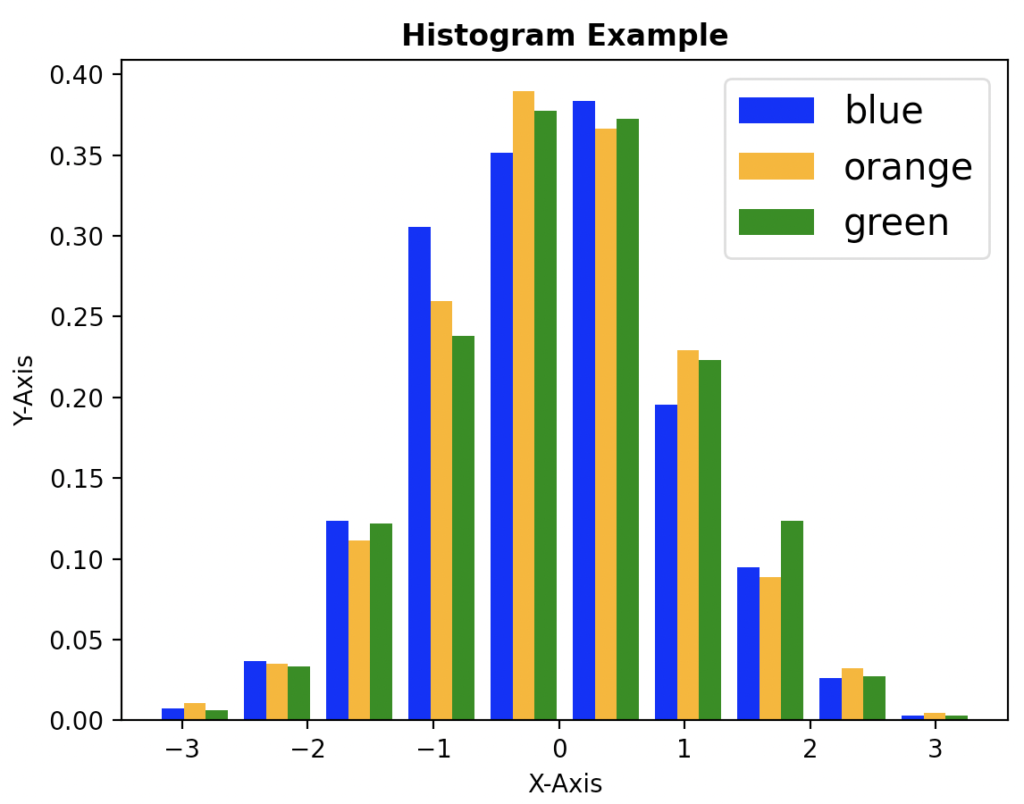
在这个程序中,我们导入了matplotlib.pyplot用于绘制直方图并为其添加图例。
matplotlib库包含了所有用于绘制不同类型图形的函数。然后我们导入numpy来创建随机坐标。然后我们创建了一个随机数组并将其存储在x中。
然后,我们指定了10个bin的数量。然后我们调用了hist函数。然后我们创建了一个存储为三种颜色的列表,称为蓝橙和绿。这个列表被存储为一个colr 数组。
x数组作为必要参数被传递,然后我们传递了10个bin的数量,然后我们传递了密度为True,然后我们传递了颜色为colr数组。
然后我们调用 legend() 函数来设置图例。我们还传递了一个大小为15的属性。在这段代码中,hist函数创建了直方图, legend函数将图例添加到直方图中。
