

Echarts的使用
怎么使用Echarts图表
1、首先先安装该组件模块
npm install echarts --save
2、配置好需要安装的文件模块
“react”: “^16.2.0”
“echarts”: “^4.0.2”
“redux”: “^3.7.2”,
“react-router-dom”: “^4.2.2”
“react-router-redux”: “^5.0.0-alpha.9”
“react-hot-loader”: “^4.0.0-beta.21”
3、关于文件的引入
import React, {useEffect} from 'react';
import {PageContainer} from "@ant-design/pro-layout";

// 引入Echarts主模块
import * as echarts from 'echarts/lib/echarts';

//引入柱状图
import 'echarts/lib/chart/bar';

// 引入提示框和标题文件
import 'echarts/lib/component/tooltip';

import 'echarts/lib/component/title';

import { GridComponent } from 'echarts/components';
echarts.use([GridComponent]);

使用什么图表就引入相关的文件
```
图表代码示例
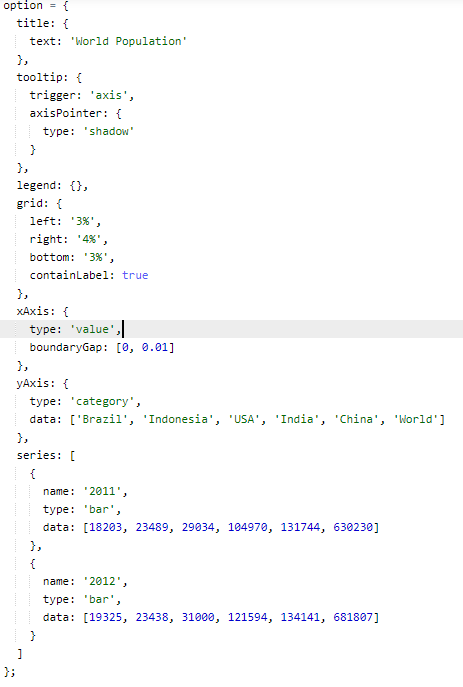
效果如下图
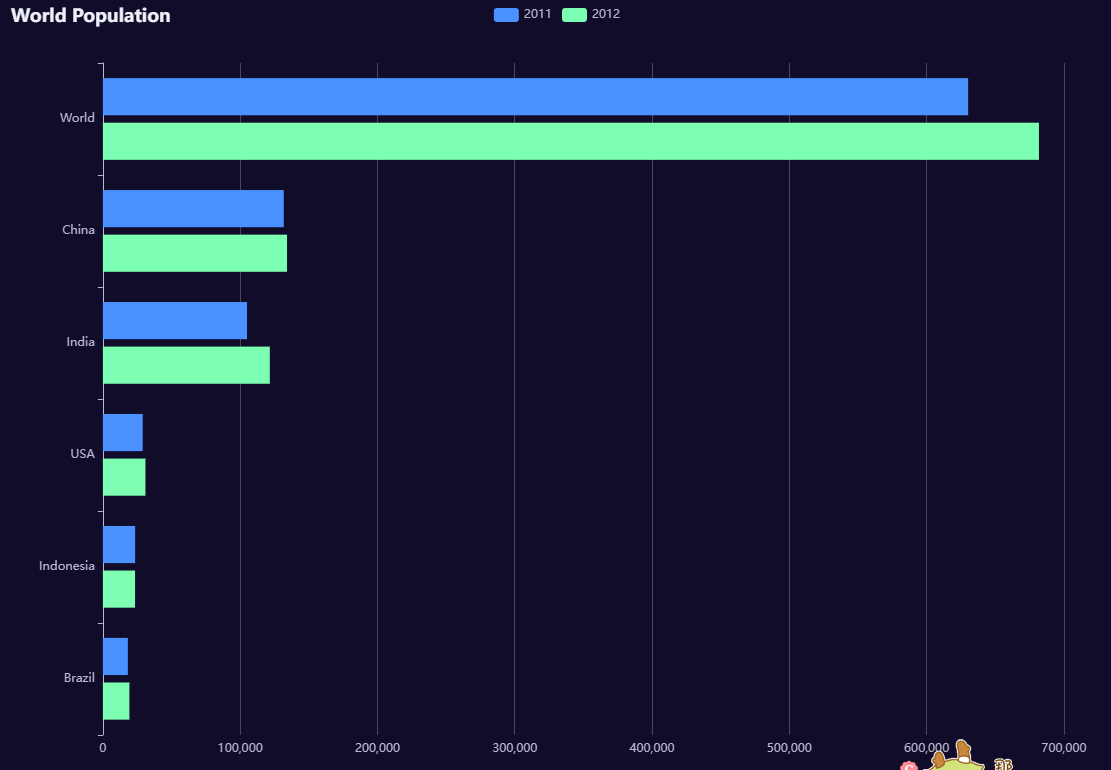
然后最后在return中进行渲染就可以
详细教程请期待更新
