只是笔记,更多细节建议参考官方文档。
引入
- 文档地址:
https://github.com/ecomfe/vue-echarts/blob/5.x/README.zh_CN.md
npm install echarts vue-echarts
柱状图 📊 bar
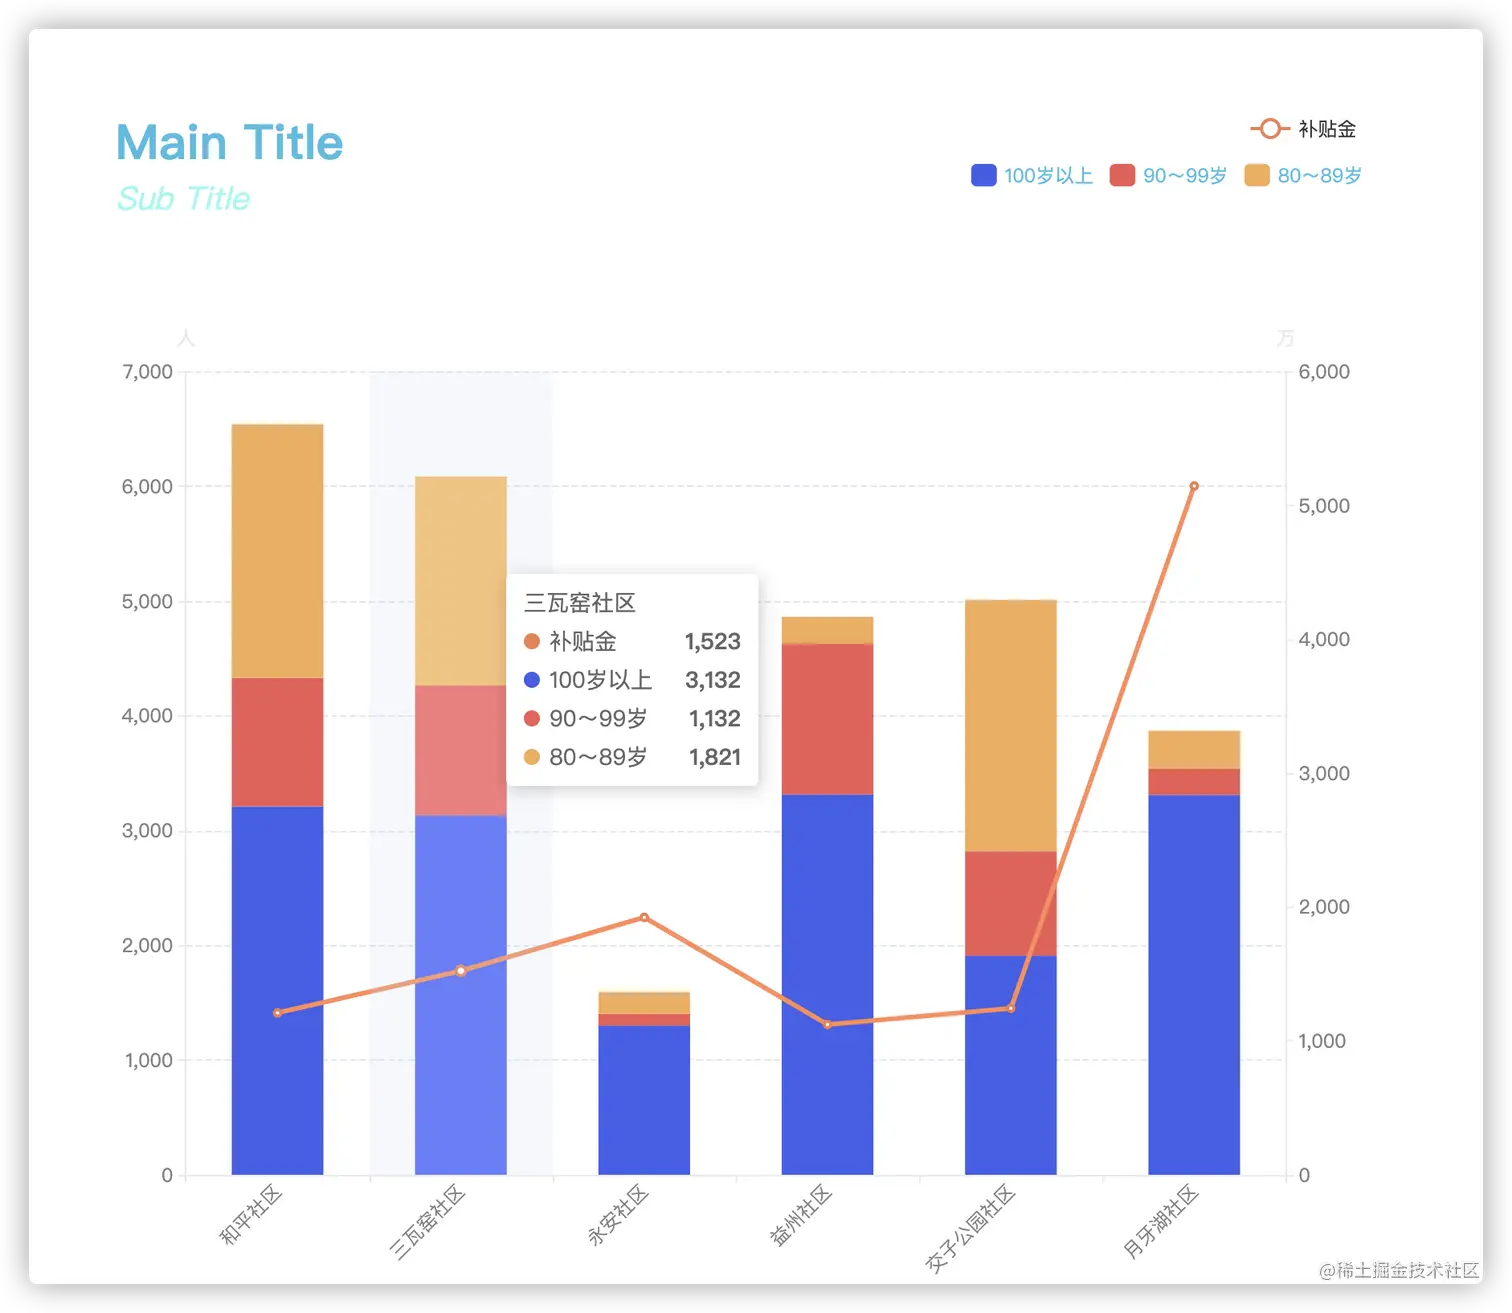
option = {
grid: {
top: '30%',
left: '15%',
right: '15%',
},
title: {
text: 'Main Title',
subtext: 'Sub Title',
left: '10%',
top: '10%',
textStyle: {
fontSize: 30,
color: 'rgba(68, 189, 225, 1)',
fontWeight: 'bolder',
fontFamily: 'sans-serif',
fontStyle: 'normal',
},
subtextStyle: {
fontSize: 20,
color: 'rgba(150, 249, 243, 1)',
fontStyle: 'italic',
},
show: true,
},
tooltip: {
trigger: 'axis',
axisPointer: {
type: 'shadow',
},
},
legend: [
{
top: '10%',
right: '10%',
data: ['补贴金'],
},
{
top: '14%',
right: '10%',
itemWidth: 16,
data: ['100岁以上', '90~99岁', '80~89岁'],
orient: 'horizontal',
padding: [1, 1, 1, 1],
align: 'left',
lineStyle: {
},
textStyle: {
color: 'rgba(68, 189, 225, 1)',
},
},
],
xAxis: {
type: 'category',
name:'',
data: ['和平社区', '三瓦窑社区', '永安社区', '益州社区', '交子公园社区', '月牙湖社区'],
axisLabel: {
rotate: 45,
},
axisLine: {
show: true,
lineStyle: {
color: '##E9EAEB',
},
},
},
yAxis: [
{
type: 'value',
name: '人',
axisLine: {
show: true,
lineStyle: {
color: '#E9EAEB',
},
},
axisTick: {
show: true,
},
splitLine: {
show: true,
lineStyle: {
type: 'dashed',
},
},
axisLabel: {
color: '#828282',
fontSize: 12,
},
},
{
type: 'value',
name: '万',
axisLine: {
show: true,
lineStyle: {
color: '#E9EAEB',
},
},
axisTick: {
show: true,
},
splitLine: {
show: false,
},
axisLabel: {
color: '#828282',
fontSize: 12,
},
},
],
color:["#485AE9","#EE5B56","#F4AC56"],
series: [
{
name: '补贴金',
type: 'line',
yAxisIndex: 1,
color: '#EF8052',
data: [1210, 1523, 1923, 1123, 1244, 5145],
label: {
show: true,
rich: {},
},
},
{
name: '100岁以上',
type: 'bar',
stack: '年龄',
barWidth: '50%',
data: [3210, 3132, 1301, 3314, 1910, 3310],
},
{
name: '90~99岁',
type: 'bar',
stack: '年龄',
barWidth: '50%',
data: [1120, 1132, 101, 1314, 910, 230],
},
{
name: '80~89岁',
type: 'bar',
stack: '年龄',
barWidth: '50%',
data: [2210, 1821, 191, 234, 2190, 330],
},
],
};
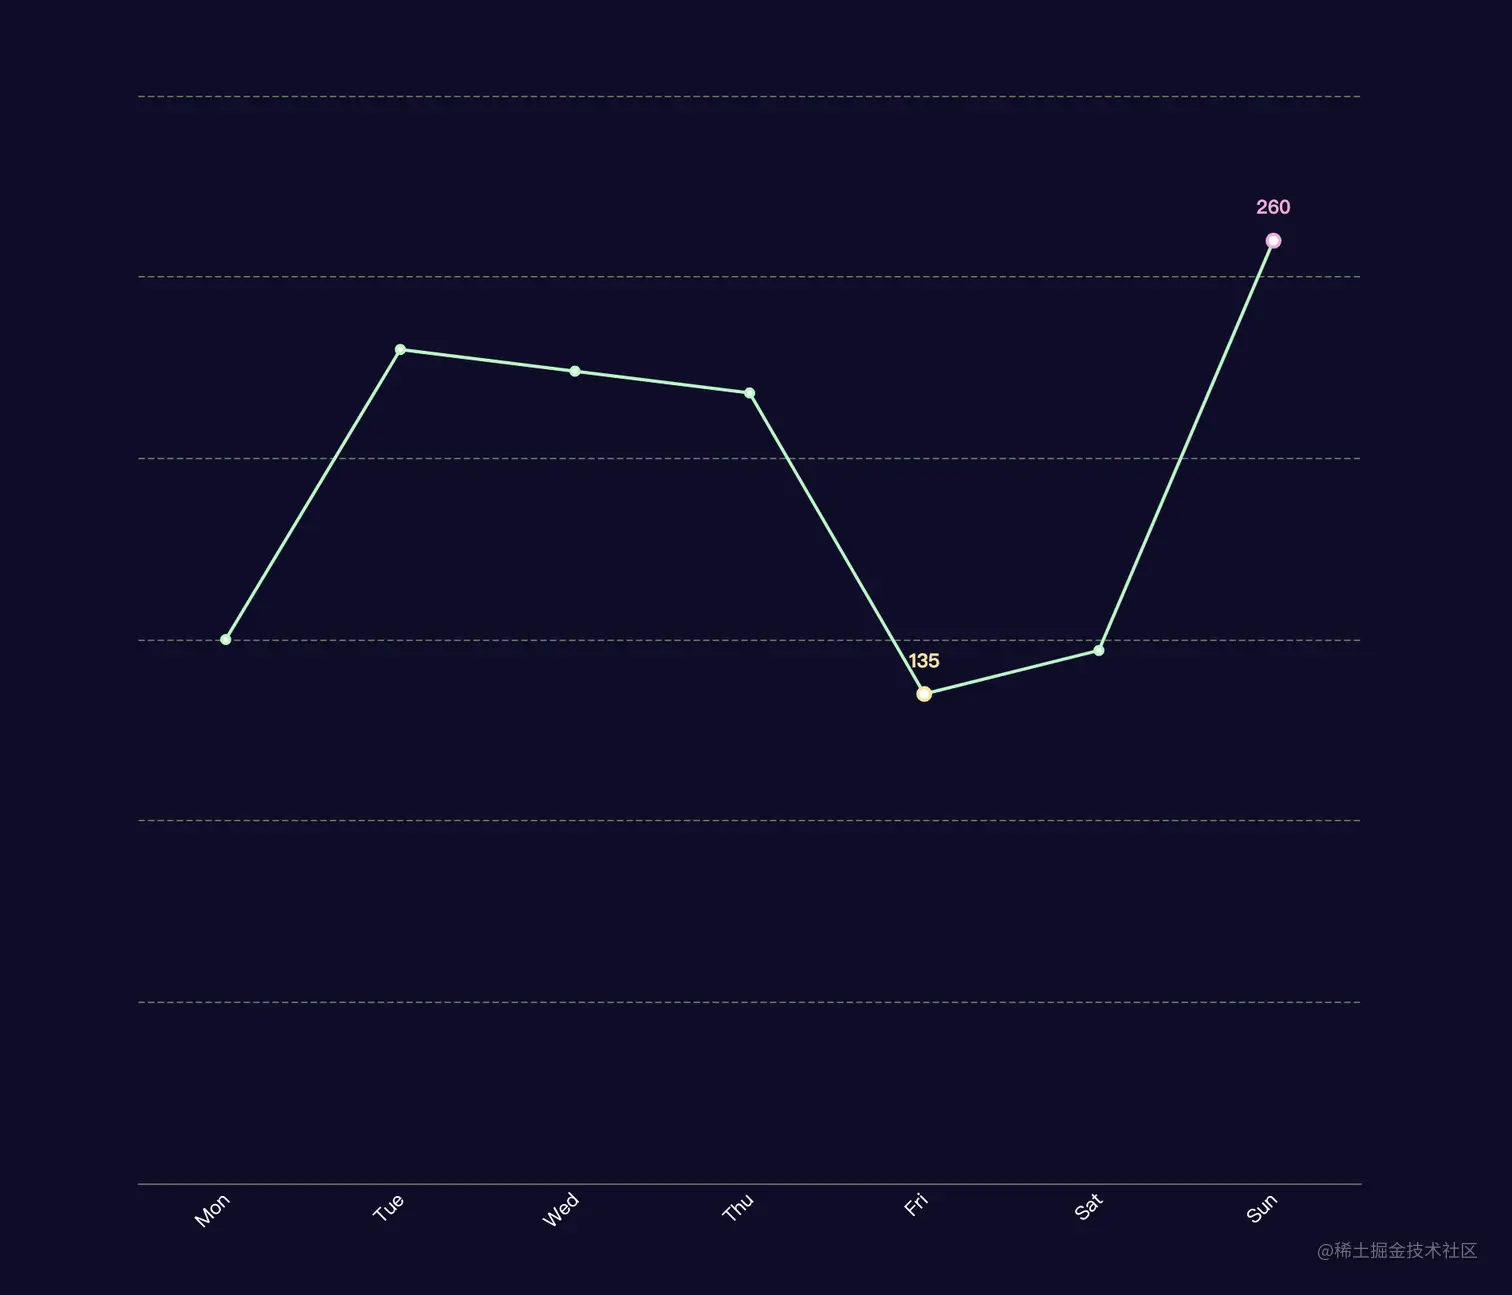
折线图 📈
xAxis: {
type: 'category',
data: ['Mon', 'Tue', 'Wed', 'Thu', 'Fri', 'Sat', 'Sun'],
axisLabel: {
rotate: 45,
color: '#fff',
},
axisLine: {
show: true,
lineStyle: {
color: '#507058',
},
},
axisTick: {
show: false,
},
},
yAxis: {
type: 'value',
axisLine: {
show: false,
},
axisLabel: {
show: false,
},
splitLine: {
show: true,
lineStyle: {
color: '#507058',
type: 'dashed',
},
},
},
series: [
{
symbol: 'emptyCircle',
showSymbol: true,
symbolSize: 5,
markPoint: {
data: [
{
symbol: 'emptyCircle',
symbolSize: 8,
type: 'max',
name: '最大值',
label: {
show: true,
color: '#FBA8DA',
fontWeight: 'bolder',
position: 'top',
distance: 10,
},
itemStyle: {
color: '#FBA8DA',
borderColor: '#FBA8DA',
borderType: 'solid',
borderWidth: 5,
},
},
{
type: 'min',
name: '最小值',
symbol: 'emptyCircle',
symbolSize: 8,
label: {
show: true,
color: '#FAE494',
fontWeight: 'bolder',
position: 'top',
distance: 10,
},
itemStyle: {
color: '#FAE494',
borderColor: '#FAE494',
borderType: 'solid',
borderWidth: 5,
},
},
],
label: { textStyle: { color: '#fff' } },
itemStyle: { color: 'transparent' },
},
color: '#A8FBC0',
data: [150, 230, 224, 218, 135, 147, 260],
type: 'line',
},
],
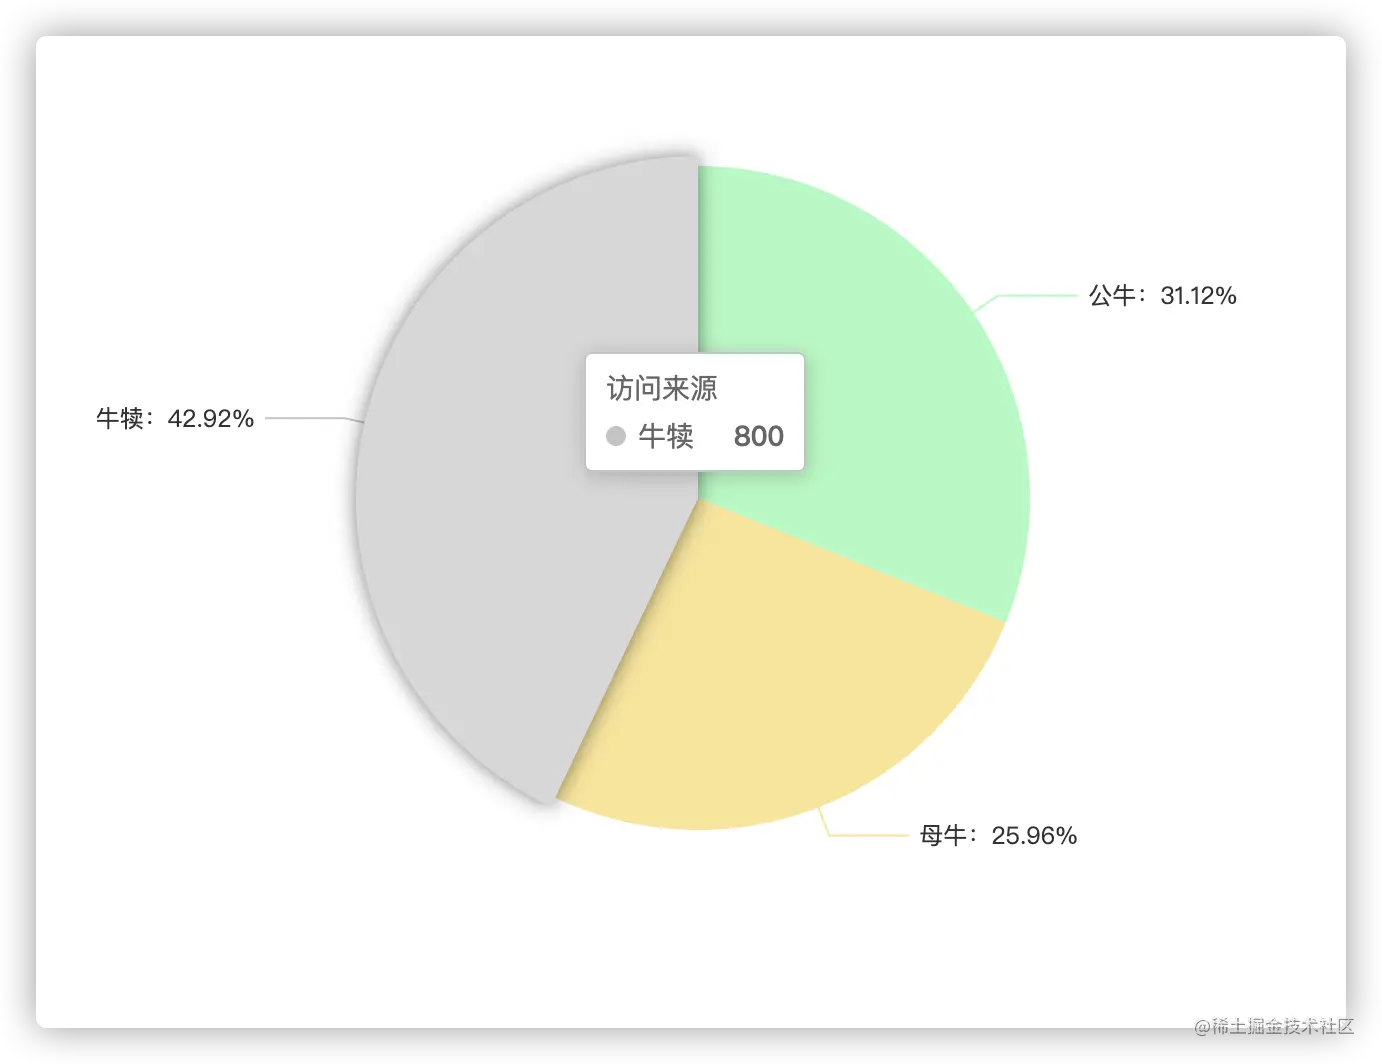
饼图 🫓 pie
- 选中模式的配置:
selectedMode
- 饼图图形上的文本标签:
label
- 标签的边距:
label.edgeDistance
- 标签的对齐方式:
label.alignTo
- 标签的视觉引导线配置:
labelLine
- 标签的统一布局配置:
labelLayout
- 图形样式:
itemStyle
- 高亮状态的扇区和标签样式:
emphasis
- 动画效果:
animation
options: {
tooltip: {
trigger: 'item',
},
color: ['#A8FBC0', '#FAE494', '#C4C4C4'],
series: [
{
label: {
show: true,
position: 'outside',
formatter: '{b}:{d}%',
},
name: '访问来源',
type: 'pie',
radius: '50%',
data: [
{ value: 580, name: '公牛' },
{ value: 484, name: '母牛' },
{ value: 800, name: '牛犊' },
],
labelLine: {
length2: 40,
},
emphasis: {
itemStyle: {
shadowBlur: 10,
shadowOffsetX: 0,
shadowColor: 'rgba(0, 0, 0, 0.5)',
},
},
},
],
},
labelLayout: (params) => {
const isLeft = params.labelRect.x < myChart.getWidth() / 2
const points = params.labelLinePoints
points[2][0] = isLeft
?params.labelRect.x
:params.labelRect.x + params.labelRect.width
return {
labelLinePoints: points
}
}
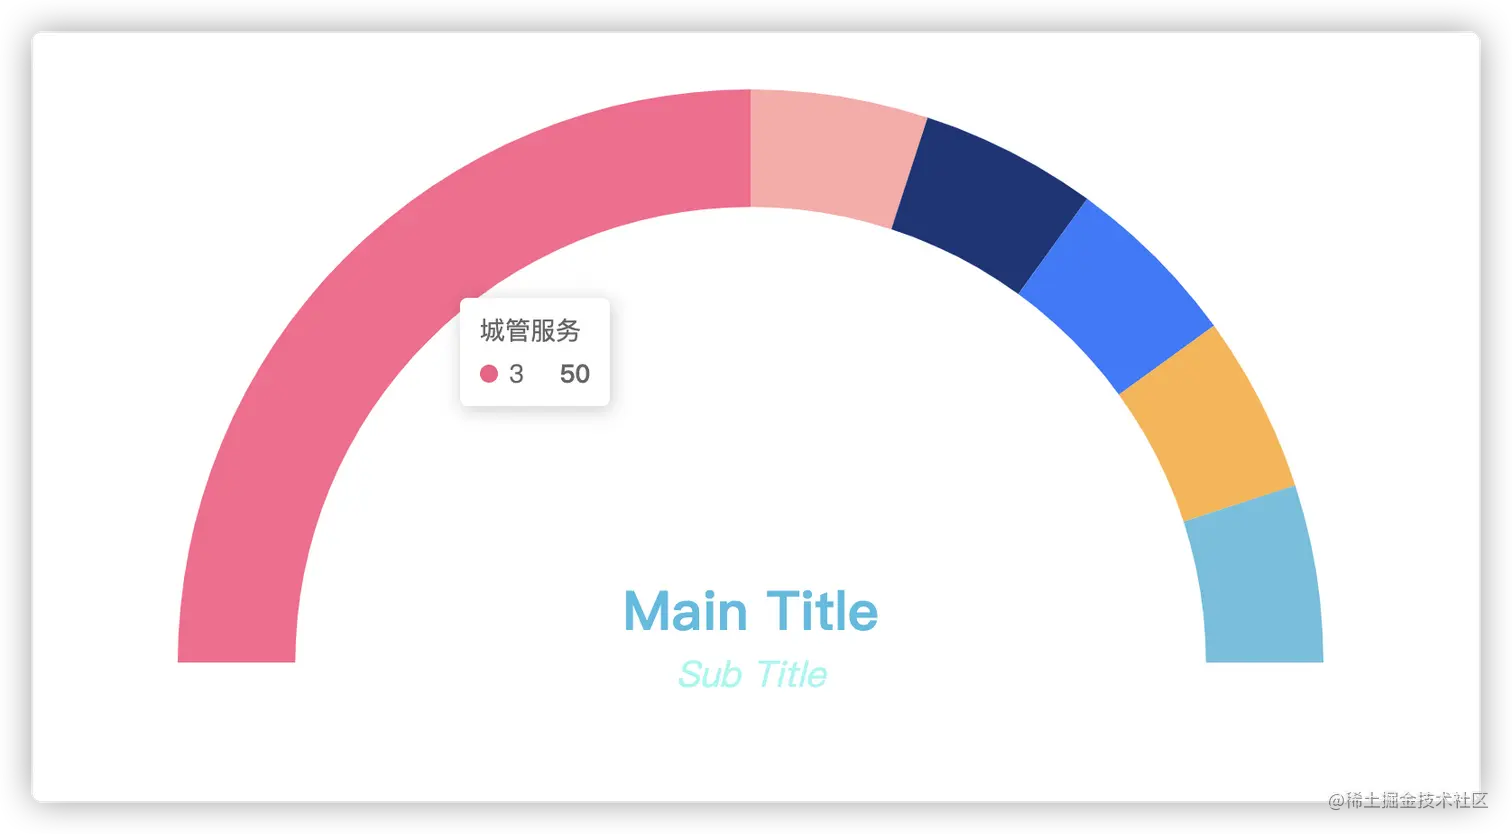
半圆环
title: {
text: 'Main Title',
subtext: 'Sub Title',
left: 'center',
top: '44%',
textStyle: {
fontSize: 30,
color: 'rgba(68, 189, 225, 1)',
fontWeight: 'bolder',
fontFamily: 'sans-serif',
fontStyle: 'normal',
},
subtextStyle: {
fontSize: 20,
color: 'rgba(150, 249, 243, 1)',
fontStyle: 'italic',
},
show: true,
},
polar: {},
angleAxis: {
axisLine: {
show: false,
},
axisLabel: {
show: false,
},
splitLine: {
show: false,
},
axisTick: {
show: false,
},
min: 0,
max: 200,
boundaryGap: ['0', '100'],
startAngle: 180,
},
radiusAxis: {
type: 'category',
axisLine: {
show: false,
},
axisTick: {
show: false,
},
axisLabel: {
show: false,
},
},
series: [
{
type: 'bar',
stack: '总数',
name: '城管服务',
data: [null, null, null, 50],
coordinateSystem: 'polar',
value: 819,
color: '#F45B80',
},
{
type: 'bar',
stack: '总数',
name: '工会服务',
data: [null, null, null, 10],
coordinateSystem: 'polar',
value: 482,
color: '#FFA8A7',
},
{
type: 'bar',
stack: '总数',
name: '食品经营许可',
data: [null, null, null, 10],
coordinateSystem: 'polar',
value: 365,
color: '#1B3478',
},
{
type: 'bar',
stack: '总数',
name: '就业服务',
data: [null, null, null, 10],
coordinateSystem: 'polar',
value: 250,
color: '#3677FF',
},
{
type: 'bar',
stack: '总数',
name: 'EMS邮寄',
data: [null, null, null, 10],
coordinateSystem: 'polar',
value: 25,
color: '#FEB446',
},
{
type: 'bar',
stack: '总数',
name: '团组织服务',
data: [null, null, null, 10],
coordinateSystem: 'polar',
value: 16,
color: '#64C0DE',
},
],
tooltip: {
show: true,
trigger: 'item',
borderColor: '#fff',
},
grid: {
left: 0,
top: 0,
bottom: 0,
right: 0,
},


