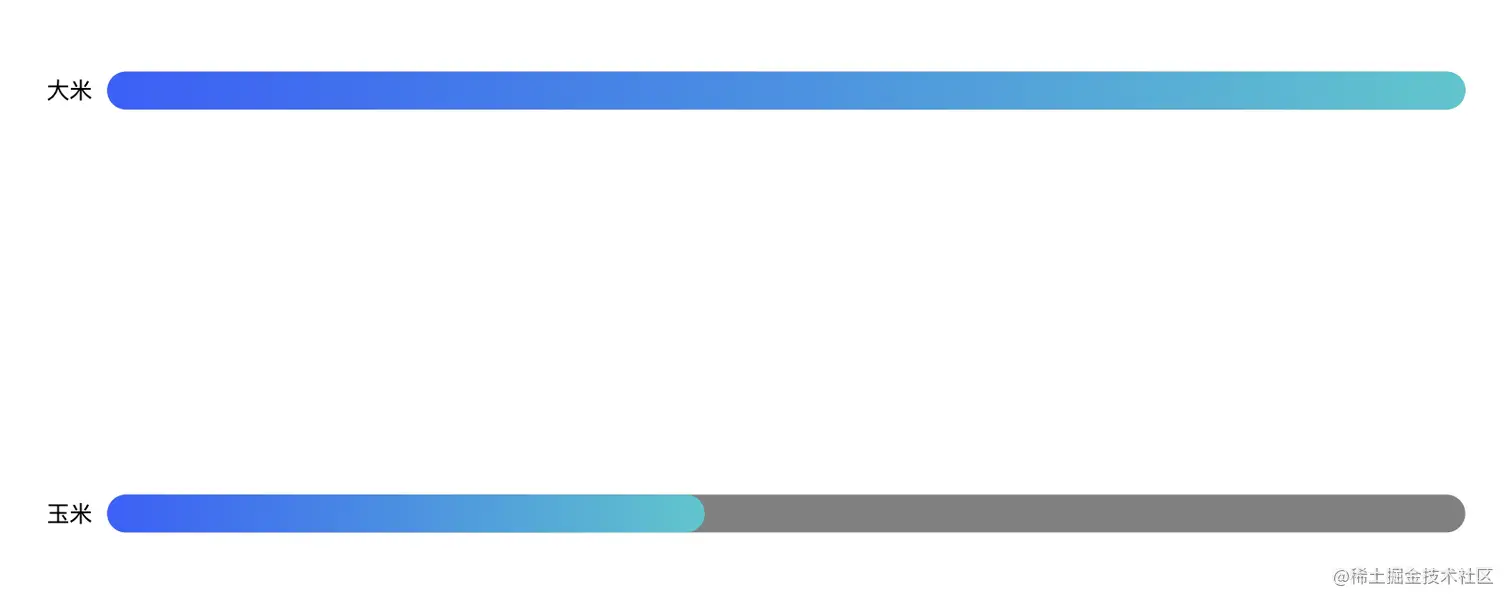
1. echarts 双层横向柱形图,圆角,渐变色。
option = {
    grid: {
        left: '5%',
        right: '5%',
        bottom: '5%',
        top: '10%',
        containLabel: true
    },
    xAxis: {
        show: false,
        type: 'value'
    },
    yAxis: [{
        type: 'category',
        inverse: true,
        axisLabel: {
            show: true,
            textStyle: {
                color: 'black'
            },
        },
        splitLine: {
            show: false
        },
        axisTick: {
            show: false
        },
        axisLine: {
            show: false
        },
        data: ['大米', '玉米']
    }],
    series: [{
            name: '金额',
            type: 'bar',
            zlevel: 1,
            itemStyle: {
                normal: {
                    barBorderRadius: 30,
                    color: new echarts.graphic.LinearGradient(0, 0, 1, 0, [{
                        offset: 0,
                        color: 'rgb(57,89,255,1)'
                    }, {
                        offset: 1,
                        color: 'rgb(46,200,207,1)'
                    }]),
                },
            },
            barWidth: 20,
            data: [50000000, 22000000]
        },
        {
            name: '背景',
            type: 'bar',
            barWidth: 20,
            barGap: '-100%',
            data: [50000000, 50000000],
            itemStyle: {
                normal: {
                    color: 'gray',
                    barBorderRadius: 30,
                }
            },
        },
    ]
};
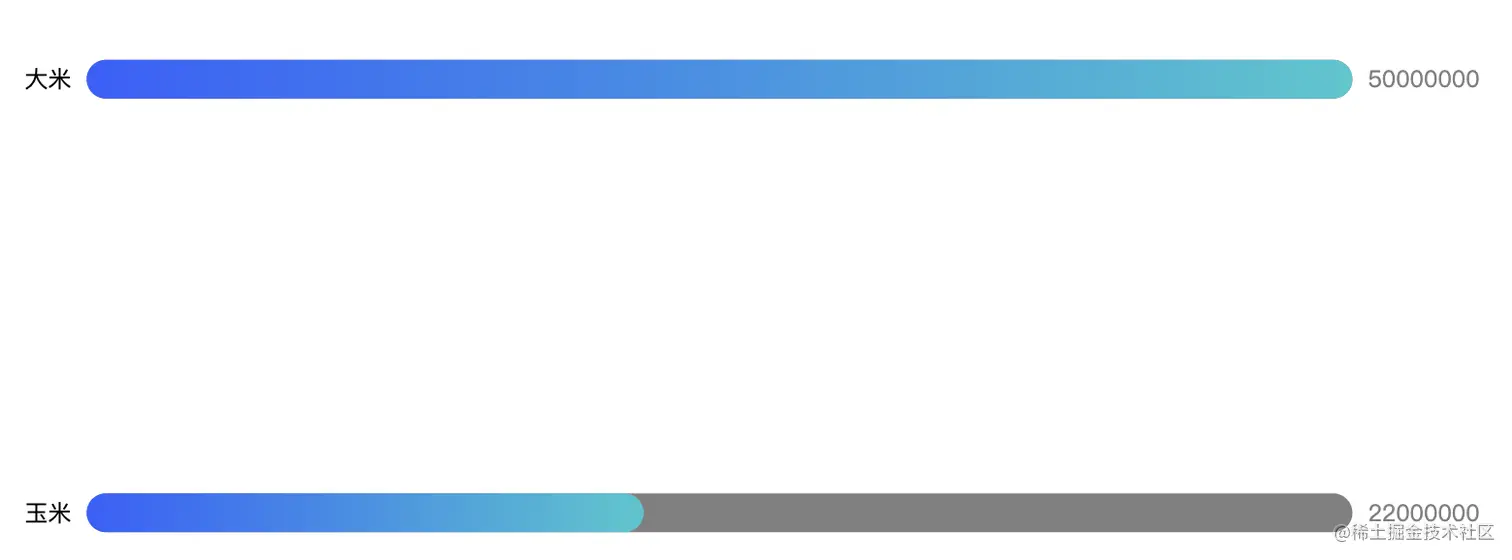
2. 柱形图右侧或者上侧增加数值
option = {
    grid: {
        left: '5%',
        right: '5%',
        bottom: '5%',
        top: '10%',
        containLabel: true
    },
    xAxis: {
        show: false,
        type: 'value'
    },
    yAxis: [{
        type: 'category',
        inverse: true,
        axisLabel: {
            show: true,
            textStyle: {
                color: 'black'
            },
        },
        splitLine: {
            show: false
        },
        axisTick: {
            show: false
        },
        axisLine: {
            show: false
        },
        data: ['大米', '玉米']
    },{
        type: 'category',
        inverse: true,
        axisTick: 'none',
        axisLine: 'none',
        show: true,
        axisLabel: {
            textStyle: {
                color: 'gray',
                fontSize: '12'
            },
        },
        data: [50000000, 22000000]
    }],
    series: [{
            name: '金额',
            type: 'bar',
            zlevel: 1,
            itemStyle: {
                normal: {
                    barBorderRadius: 30,
                    color: new echarts.graphic.LinearGradient(0, 0, 1, 0, [{
                        offset: 0,
                        color: 'rgb(57,89,255,1)'
                    }, {
                        offset: 1,
                        color: 'rgb(46,200,207,1)'
                    }]),
                },
            },
            barWidth: 20,
            data: [50000000, 22000000]
        },
        {
            name: '背景',
            type: 'bar',
            barWidth: 20,
            barGap: '-100%',
            data: [50000000, 50000000],
            itemStyle: {
                normal: {
                    color: 'gray',
                    barBorderRadius: 30,
                }
            },
        },
    ]
};
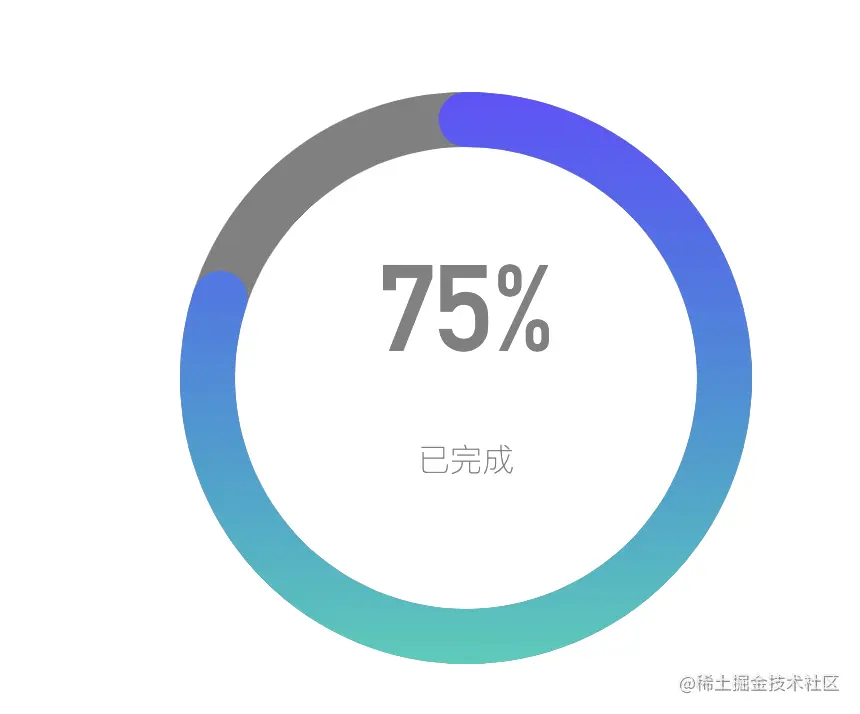
3. 圆环
option = {
    title: [
        {
            text: '已完成',
            x: 'center',
            top: '55%',
            textStyle: {
                color: 'gray',
                fontSize: 16,
                fontWeight: '100',
            },
        },
        {
            text: '75%',
            x: 'center',
            top: '38%',
            textStyle: {
                fontSize: '60',
                color: 'gray',
                fontFamily: 'DINAlternate-Bold, DINAlternate',
                foontWeight: '600',
            },
        },
    ],
    polar: {
        radius: ['42%', '52%'],
        center: ['50%', '50%'],
    },
    angleAxis: {
        max: 100,
        show: false,
    },
    radiusAxis: {
        type: 'category',
        show: true,
        axisLabel: {
            show: false,
        },
        axisLine: {
            show: false,
        },
        axisTick: {
            show: false,
        },
    },
    series: [
        {
            name: '',
            type: 'bar',
            roundCap: true,
            barWidth: 50,
            showBackground: true,
            // 底下环颜色
            backgroundStyle: {
                color: 'gray',
            },
            data: [80],
            coordinateSystem: 'polar',
            itemStyle: {
                normal: {
                    color: new echarts.graphic.LinearGradient(0, 1, 0, 0, [
                        {
                            offset: 0,
                            color: '#16CEB9',
                        },
                        {
                            offset: 1,
                            color: '#6648FF',
                        },
                    ]),
                },
            },
        },
    ],
};
4.echarts 移除页面后tooltip还存在问题
myChart.dispatchAction({
type: 'hideTip'
});
myChart.dispatchAction({
type: 'updateAxisPointer',
currTrigger: 'leave'
})
github.com/apache/echa…


