在最初时候我们在vue中使用echarts时是这样使用的
<template>
<div>
<div id="chart1" :style="{width: '300px', height: '300px'}"></div>
</div>
</template>
export default {
name: 'WorkPlace',
data () {
return {
dataY: [
820,
932,
901,
934
],
dataX: [
0,
1,
2,
3
]
}
},
methods:{
chart () {
let that = this;
that.chart1 = that.echarts.init(document.getElementById("chart1")); //定义
var option1 = {
xAxis: {
name: "时",
boundaryGap: false,
axisLine: {
lineStyle: {
color: "#d8d8d8" // x坐标轴的轴线颜色
}
},
axisLabel: {
show: true, //这行代码控制着坐标轴x轴的文字是否显示
textStyle: {
color: "#707070", //x轴上的字体颜色
fontSize: "12" // x轴字体大小
}
},
type: "category",
data: this.dataX
},
yAxis: {
name: "℃",
type: "value",
nameTextStyle: {
fontSize: 16
},
splitLine: {
// 改变轴线颜色
lineStyle: {
// 使用深浅的间隔色
color: "#edeeed"
}
},
axisLine: {
lineStyle: {
color: "#d8d8d8" // x坐标轴的轴线颜色
}
},
axisTick: { show: false },
axisLabel: {
textStyle: {
align: "left",
color: "#707070", //x轴上的字体颜色
fontSize: "12" // x轴字体大小
},
formatter: "{value}",
interval: 0,
margin: 40
}
},
series: [
{
data:this.dataY,
type: "line",
smooth: true,
symbol: "none",
itemStyle: {
normal: {
color: "#5a60c7",
lineStyle: {
color: "#5a60c7"
}
}
}
}
]
};
that.chart1.clear();
that.chart1.setOption(option1); //展示
}
},
mounted() {
this.chart ()
}
}
但是在2020年vue更新之后,当我这样使用时会报错
Error in mounted hook: "TypeError: Cannot read property 'init' of undefined"
反复查找各种资料,修改版本都不能解决,后来找到了解决办法
1.使用ref获取DOM元素
this.Chart = echarts.init(this.$refs.chart1)
2.改用require的方式引入库
let echarts = require('echarts')
将以上两步替换之前的
that.chart1 = that.echarts.init(document.getElementById("chart1")); //定义(这句不要了哦)
以为就这样解决了,但是还报错
Error in mounted hook: "TypeError: Cannot read property 'getAttribute' of undefined"
经过查找,这样修改
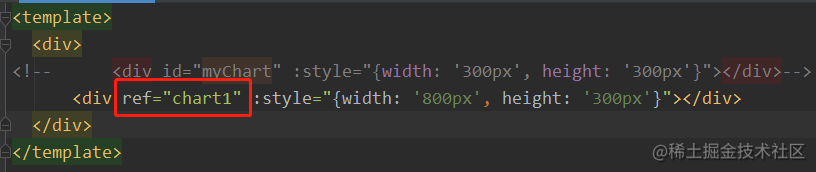
<div ref="chart1" :style="{width: '800px', height: '300px'}"></div>
问题解决了!!!!!!
更新的代码:
<template>
<div>
<div ref="chart1" :style="{width: '300px', height: '300px'}"></div>
</div>
</template>
export default {
name: 'WorkPlace',
data () {
return {
dataY: [
820,
932,
901,
934
],
dataX: [
0,
1,
2,
3
]
}
},
methods:{
chart () {
let that = this;
let echarts = require('echarts');
this.chart1 = echarts.init(this.$refs.chart1)
var option1 = {
xAxis: {
name: "时",
boundaryGap: false,
axisLine: {
lineStyle: {
color: "#d8d8d8" // x坐标轴的轴线颜色
}
},
axisLabel: {
show: true, //这行代码控制着坐标轴x轴的文字是否显示
textStyle: {
color: "#707070", //x轴上的字体颜色
fontSize: "12" // x轴字体大小
}
},
type: "category",
data: this.dataX
},
yAxis: {
name: "℃",
type: "value",
nameTextStyle: {
fontSize: 16
},
splitLine: {
// 改变轴线颜色
lineStyle: {
// 使用深浅的间隔色
color: "#edeeed"
}
},
axisLine: {
lineStyle: {
color: "#d8d8d8" // x坐标轴的轴线颜色
}
},
axisTick: { show: false },
axisLabel: {
textStyle: {
align: "left",
color: "#707070", //x轴上的字体颜色
fontSize: "12" // x轴字体大小
},
formatter: "{value}",
interval: 0,
margin: 40
}
},
series: [
{
data:this.dataY,
type: "line",
smooth: true,
symbol: "none",
itemStyle: {
normal: {
color: "#5a60c7",
lineStyle: {
color: "#5a60c7"
}
}
}
}
]
};
that.chart1.clear();
that.chart1.setOption(option1); //展示
}
},
mounted() {
this.chart ()
}
}


