开始之前先看一个 通过搜索得到的 echarts 自动滚动
- 这是之前搜索到的,可以看出移动的逻辑是这样文章链接
setInterval(function () {
if (option.dataZoom[0].endValue == KSMC.length ) {
option.dataZoom[0].endValue = 6;
option.dataZoom[0].startValue = 0;
}
else {
option.dataZoom[0].endValue = option.dataZoom[0].endValue + 1;
option.dataZoom[0].startValue = option.dataZoom[0].startValue + 1;
}
myChart.setOption(option);
}, 2000);
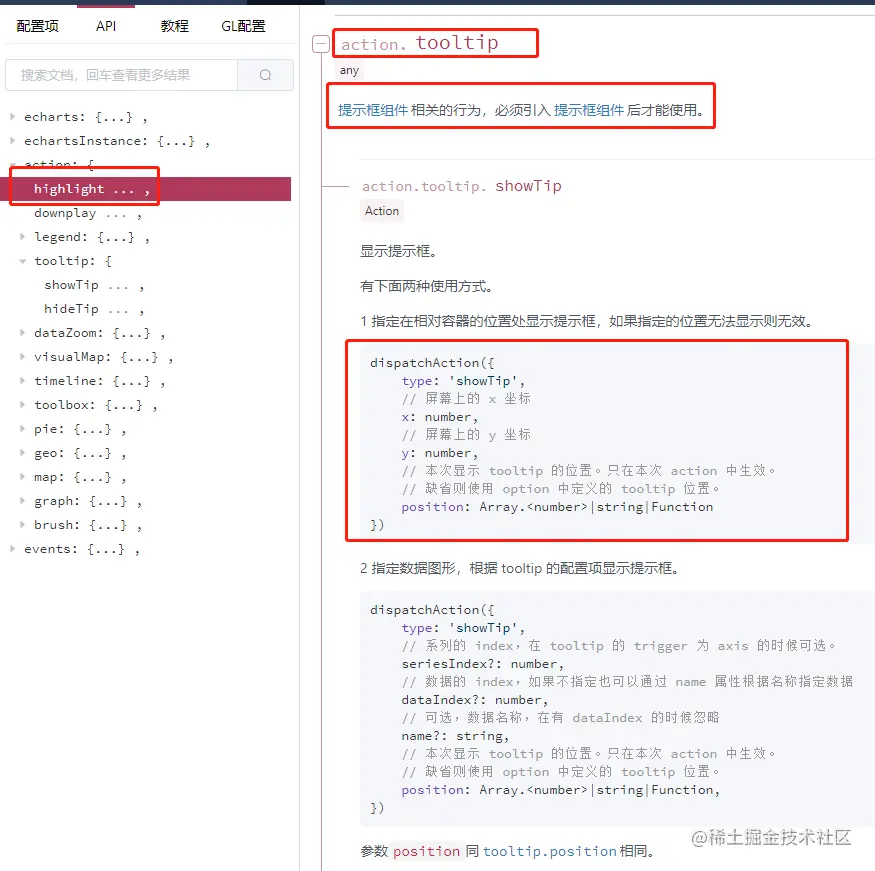
再来看下官网文档
- 文档直达地址
- 上述可以看出文档是提供移动的方法的,原理是一样的 通过定时器移动元素,那么就有了下面的代码
this.mainLeftCarBox 是承载 echarts的元素
let index = 0
let timer = setInterval(()=> {
let lendLength = option.xAxis.data.length
this.mainLeftCarBox.dispatchAction({
type: 'dataZoom',
startValue: index,
endValue: 6 + index
});
index++;
if(index > lendLength) { index = 0 }
}, 2000);
this.$once('hook:beforeDestroy', ()=> { clearInterval(timer)})
- 然后我们在创建一个 tooltip 的移动方法 他俩组合后是这样的
+
export const chartMotionAnimation = (opts) => {
const { chartDom, option, time = 1500, self } = opts;
let index = 0;
let lendLength = 0;
const xData = option.xAxis;
const seriesData = option.series;
const type = Array.isArray(seriesData) ? seriesData[0].type : seriesData.type;
if (['line', 'bar'].includes(type)) {
lendLength = Array.isArray(xData) ? xData[0].data.length : xData.data.length;
} else {
lendLength = Array.isArray(seriesData) ? seriesData[0].data.length : seriesData.data.length;
}
let timer = setInterval(() => {
chartDom.dispatchAction({
type: 'showTip',
seriesIndex: 0,
dataIndex: index,
position: [10, 20]
});
let downplayIndex = index - 1;
if (index === 0) {
downplayIndex = lendLength - 1;
}
chartDom.dispatchAction({
type: 'downplay',
seriesIndex: 0,
dataIndex: downplayIndex,
position: [10, 20]
});
chartDom.dispatchAction({
type: 'highlight',
seriesIndex: 0,
dataIndex: index,
position: [10, 20]
});
chartDom.dispatchAction({
type: 'dataZoom',
startValue: index,
endValue: 6 + index
});
index++;
if (index >= lendLength) {
index = 0;
}
}, time);
self.$once('hook:beforeDestroy', () => {
clearInterval(timer);
});
};
结束


