

概述
最近一直研究Matrix框架,也找了很多相关博客,发现大多都是说了大致框架流程,细节不够深入,或者是基于较早的版本,所以决定对照最新的版本自己撸一篇。建议不太了解Matrix Trace Canary的同学先看一下官方文档,有助于本文理解。话不多说开始吧。
框架解析
Trace是基于ASM字节码插桩,在编译期对所有class文件中的函数字节码修改,在函数执行前后打点。
自定义MatrixTraceTransform
Transform可在class文件打包成dex文件之前对class字节码进行编辑。 插桩部分不是本文重点,网上也有很多相关文章,不做过度介绍。看一下关键代码
        @Override
        protected void onMethodEnter() {
            TraceMethod traceMethod = collectedMethodMap.get(methodName);
            if (traceMethod != null) {
                traceMethodCount.incrementAndGet();
                mv.visitLdcInsn(traceMethod.id);
                mv.visitMethodInsn(INVOKESTATIC, TraceBuildConstants.MATRIX_TRACE_CLASS, "i", "(I)V", false);
            }
        }
在需要插桩的函数执行前插入AppMethodBeat.i()方法
@Override
        protected void onMethodExit(int opcode) {
            TraceMethod traceMethod = collectedMethodMap.get(methodName);
            if (traceMethod != null) {
                if (hasWindowFocusMethod && isActivityOrSubClass && isNeedTrace) {
                    TraceMethod windowFocusChangeMethod = TraceMethod.create(-1, Opcodes.ACC_PUBLIC, className,
                            TraceBuildConstants.MATRIX_TRACE_ON_WINDOW_FOCUS_METHOD, TraceBuildConstants.MATRIX_TRACE_ON_WINDOW_FOCUS_METHOD_ARGS);
                    if (windowFocusChangeMethod.equals(traceMethod)) {
                        traceWindowFocusChangeMethod(mv, className);
                    }
                }

                traceMethodCount.incrementAndGet();
                mv.visitLdcInsn(traceMethod.id);
                mv.visitMethodInsn(INVOKESTATIC, TraceBuildConstants.MATRIX_TRACE_CLASS, "o", "(I)V", false);
            }
        }
    }
在需要插桩的函数执行后插入AppMethodBeat.o()方法
    private void traceWindowFocusChangeMethod(MethodVisitor mv, String classname) {
        mv.visitVarInsn(Opcodes.ALOAD, 0);
        mv.visitVarInsn(Opcodes.ILOAD, 1);
        mv.visitMethodInsn(Opcodes.INVOKESTATIC, TraceBuildConstants.MATRIX_TRACE_CLASS, "at", "(Landroid/app/Activity;Z)V", false);
    }

    private void insertWindowFocusChangeMethod(ClassVisitor cv, String classname) {
        MethodVisitor methodVisitor = cv.visitMethod(Opcodes.ACC_PUBLIC, TraceBuildConstants.MATRIX_TRACE_ON_WINDOW_FOCUS_METHOD,
                TraceBuildConstants.MATRIX_TRACE_ON_WINDOW_FOCUS_METHOD_ARGS, null, null);
        methodVisitor.visitCode();
        methodVisitor.visitVarInsn(Opcodes.ALOAD, 0);
        methodVisitor.visitVarInsn(Opcodes.ILOAD, 1);
        methodVisitor.visitMethodInsn(Opcodes.INVOKESPECIAL, TraceBuildConstants.MATRIX_TRACE_ACTIVITY_CLASS, TraceBuildConstants.MATRIX_TRACE_ON_WINDOW_FOCUS_METHOD,
                TraceBuildConstants.MATRIX_TRACE_ON_WINDOW_FOCUS_METHOD_ARGS, false);
        traceWindowFocusChangeMethod(methodVisitor, classname);
        methodVisitor.visitInsn(Opcodes.RETURN);
        methodVisitor.visitMaxs(2, 2);
        methodVisitor.visitEnd();

    }
在 Activity 的 onWindowFocusChanged函数中插入AppMethodBeat.at()方法
TracePlugin
TracePlugin 的start()方法是整个project的起始位置
 @Override
    public void start() {
        super.start();
        if (!isSupported()) {
            MatrixLog.w(TAG, "[start] Plugin is unSupported!");
            return;
        }
        MatrixLog.w(TAG, "start!");
        Runnable runnable = new Runnable() {
            @Override
            public void run() {

                if (!UIThreadMonitor.getMonitor().isInit()) {
                    try {
                        UIThreadMonitor.getMonitor().init(traceConfig);
                    } catch (java.lang.RuntimeException e) {
                        MatrixLog.e(TAG, "[start] RuntimeException:%s", e);
                        return;
                    }
                }

                AppMethodBeat.getInstance().onStart();

                UIThreadMonitor.getMonitor().onStart();

                anrTracer.onStartTrace();

                frameTracer.onStartTrace();

                evilMethodTracer.onStartTrace();

                startupTracer.onStartTrace();
            }
        };

        if (Thread.currentThread() == Looper.getMainLooper().getThread()) {
            runnable.run();
        } else {
            MatrixLog.w(TAG, "start TracePlugin in Thread[%s] but not in mainThread!", Thread.currentThread().getId());
            MatrixHandlerThread.getDefaultMainHandler().post(runnable);
        }

    }
AppMethodBeat
hook的函数的相关逻辑都在AppMethodBeat里面
AppMethodBeat.i()/AppMethodBeat.o()
之前插桩的函数运行开始时调用i(),结束调用o();
    public static void i(int methodId) {

        if (status <= STATUS_STOPPED) {
            return;
        }

        if (methodId >= METHOD_ID_MAX) { //1
            return;
        }

        if (status == STATUS_DEFAULT) {
            synchronized (statusLock) {
                if (status == STATUS_DEFAULT) {
                    realExecute();//2
                    status = STATUS_READY;
                }
            }
        }

        long threadId = Thread.currentThread().getId();
        if (sMethodEnterListener != null) {
            sMethodEnterListener.enter(methodId, threadId);
        }

        if (threadId == sMainThreadId) {
            if (assertIn) {
                android.util.Log.e(TAG, "ERROR!!! AppMethodBeat.i Recursive calls!!!");
                return;
            }
            assertIn = true;
            if (sIndex < Constants.BUFFER_SIZE) {
               mergeData(methodId, sIndex, true);//3
            } else {
                sIndex = 0;
                mergeData(methodId, sIndex, true);
            }
            ++sIndex;
            assertIn = false;
        }
    }
注释1处先对methodId做了校验,methodId有以下两种
- AppMethodBeat.i(AppMethodBeat.METHOD_ID_DISPATCH); 先买个坑,后面解释
- traceMethod.id = methodId.incrementAndGet(); 插桩过程中的AtomicInteger的自增
注释2处状态的判断,主要看执行的realExecute()方法
    private static void realExecute() {
        MatrixLog.i(TAG, "[realExecute] timestamp:%s", System.currentTimeMillis());

        sCurrentDiffTime = SystemClock.uptimeMillis() - sDiffTime;

        sHandler.removeCallbacksAndMessages(null);
    //2.1     sHandler.postDelayed(sUpdateDiffTimeRunnable, Constants.TIME_UPDATE_CYCLE_MS);
        sHandler.postDelayed(checkStartExpiredRunnable = new Runnable() {
            @Override
            public void run() {
                synchronized (statusLock) {
                    MatrixLog.i(TAG, "[startExpired] timestamp:%s status:%s", System.currentTimeMillis(), status);
                    if (status == STATUS_DEFAULT || status == STATUS_READY) {
                        status = STATUS_EXPIRED_START;
                    }
                }
            }
        }, Constants.DEFAULT_RELEASE_BUFFER_DELAY);

    //2.2    ActivityThreadHacker.hackSysHandlerCallback();
        LooperMonitor.register(looperMonitorListener);
    }
    private static Runnable sUpdateDiffTimeRunnable = new Runnable() {
        @Override
        public void run() {
            try {
                while (true) {
                    while (!isPauseUpdateTime && status > STATUS_STOPPED) {
                        sCurrentDiffTime = SystemClock.uptimeMillis() - sDiffTime;
                        SystemClock.sleep(Constants.TIME_UPDATE_CYCLE_MS);
                    }
                    synchronized (updateTimeLock) {
                        updateTimeLock.wait();
                    }
                }
            } catch (InterruptedException e) {
                MatrixLog.e(TAG, "" + e.toString());
            }
        }
    };
注释2.1处这里主要看sUpdateDiffTimeRunnable 这里通过开辟线程的方式每隔5ms更新sCurrentDiffTime的值,官方的解释是插桩函数每次获取时间加大性能开销,毕竟是在主线程,至于低于5ms的时间间隔可以忽略。直呼666啊 注释2.2处这里是跟Activity的启动相关的检测,先挖个坑,后面说 注释3处再说mergeData之前 先说一下 sBuffer,sIndex
    private static long[] sBuffer = new long[Constants.BUFFER_SIZE];
    private static int sIndex = 0;
函数的运行记录都被记录在sBuffer中,sIndexr就是sBuffe当前的索引记录
    private static void mergeData(int methodId, int index, boolean isIn) {
        if (methodId == AppMethodBeat.METHOD_ID_DISPATCH) {
            sCurrentDiffTime = SystemClock.uptimeMillis() - sDiffTime;
        }
        long trueId = 0L;
        if (isIn) {
            trueId |= 1L << 63;
        }
        trueId |= (long) methodId << 43;
        trueId |= sCurrentDiffTime & 0x7FFFFFFFFFFL;
        sBuffer[index] = trueId;
       checkPileup(index);//3.1
        sLastIndex = index;
    }

        private static void checkPileup(int index) {
        IndexRecord indexRecord = sIndexRecordHead;
        while (indexRecord != null) {
            if (indexRecord.index == index || (indexRecord.index == -1 && sLastIndex == Constants.BUFFER_SIZE - 1)) {
                indexRecord.isValid = false;
                MatrixLog.w(TAG, "[checkPileup] %s", indexRecord.toString());
                sIndexRecordHead = indexRecord = indexRecord.next;
            } else {
                break;
            }
        }
    }
注释3.1主要是对于数据做了校验 IndexRecord是一个链表,这里为什么这么操作我也有疑问,条件满足的情况下先设置了头节点的isValid属性但是又删除了头节点。
AppMethodBeat.at()
AppMethodBeat.at() 也是个插桩函数,不过是监测Activity启动的,后面放在StartupTracer一起说
OK 到这里主要的数据格式大致有些了解了,下面开始结合代码流程
EvilMethodTracer
EvilMethodTracer先关注的api
    @Override
    public void onAlive() {
        super.onAlive();
        if (isEvilMethodTraceEnable) {
            UIThreadMonitor.getMonitor().addObserver(this);
        }

    }


    public void addObserver(LooperObserver observer) {
        if (!isAlive) {
            onStart();
        }
        synchronized (observers) {
            observers.add(observer);
        }
    }
这里设置了监听,可以看出来实际上是设置了LooperObserver的监听,跟进看看EvilMethodTracer里的实现函数是什么时候回调,最终在LooperPrinter中找到dispatch(x.charAt(0) == '>', x);方法
    class LooperPrinter implements Printer {
        public Printer origin;
        boolean isHasChecked = false;
        boolean isValid = false;

        LooperPrinter(Printer printer) {
            this.origin = printer;
        }

        @Override
        public void println(String x) {
            if (null != origin) {
                origin.println(x);
                if (origin == this) {
                    throw new RuntimeException(TAG + " origin == this");
                }
            }

            if (!isHasChecked) {
                isValid = x.charAt(0) == '>' || x.charAt(0) == '<';
                isHasChecked = true;
                if (!isValid) {
                    MatrixLog.e(TAG, "[println] Printer is inValid! x:%s", x);
                }
            }

            if (isValid) {
                dispatch(x.charAt(0) == '>', x);//
            }

        }
    }
在LooperMonitor初始化的时候调用了resetPrinter()
    private synchronized void resetPrinter() {
        Printer originPrinter = null;
        try {
            if (!isReflectLoggingError) {
                originPrinter = ReflectUtils.get(looper.getClass(), "mLogging", looper);
                if (originPrinter == printer && null != printer) {
                    return;
                }
            }
        } catch (Exception e) {
            isReflectLoggingError = true;
            Log.e(TAG, "[resetPrinter] %s", e);
        }

        if (null != printer) {
            MatrixLog.w(TAG, "maybe thread:%s printer[%s] was replace other[%s]!",
                    looper.getThread().getName(), printer, originPrinter);
        }
        looper.setMessageLogging(printer = new LooperPrinter(originPrinter));
        if (null != originPrinter) {
            MatrixLog.i(TAG, "reset printer, originPrinter[%s] in %s", originPrinter, looper.getThread().getName());
        }
    }
可以看到该方法通过反射获取Looper中的mLogging属性,下面看下Looper中的代码
 for (;;) {
            Message msg = queue.next(); // might block

            final Printer logging = me.mLogging;
            if (logging != null) {
                logging.println(">>>>> Dispatching to " + msg.target + " " +
                        msg.callback + ": " + msg.what);
            }
           ...//省略了无关代码

            if (logging != null) {
                logging.println("<<<<< Finished to " + msg.target + " " + msg.callback);
            }
        }
可以发现 Looper在处理message开始和结束时会打印相关日志,LooperMonitor正是基于这个实现了主线程处理message时是否出现了超时情况;
让我们再回到EvilMethodTracer和UIThreadMonitor中,当主线程的一个message开始dispatch时会调用它们的dispatchBegin(),dispatch结束后调用它们的dispatchEnd()
UIThreadMonitor中
    private void dispatchBegin() {
        token = dispatchTimeMs[0] = SystemClock.uptimeMillis();
        dispatchTimeMs[2] = SystemClock.currentThreadTimeMillis();
        AppMethodBeat.i(AppMethodBeat.METHOD_ID_DISPATCH);//1

        synchronized (observers) {
            for (LooperObserver observer : observers) {
                if (!observer.isDispatchBegin()) {
                    observer.dispatchBegin(dispatchTimeMs[0], dispatchTimeMs[2], token);
                }
            }
        }
    }
之前methodId埋的坑这里可以填了,这里主线程的message 的dispatch开始和结束方法用AppMethodBeat.METHOD_ID_DISPATCH来标记,同样添加到sBuffer数组中,dispatchEnd()方法类似,就不介绍了
    @Override
    public void dispatchBegin(long beginMs, long cpuBeginMs, long token) {
        super.dispatchBegin(beginMs, cpuBeginMs, token);
        indexRecord = AppMethodBeat.getInstance().maskIndex("EvilMethodTracer#dispatchBegin");
    }


    public IndexRecord maskIndex(String source) {
        if (sIndexRecordHead == null) {//1
            sIndexRecordHead = new IndexRecord(sIndex - 1);
            sIndexRecordHead.source = source;
            return sIndexRecordHead;
        } else {
            IndexRecord indexRecord = new IndexRecord(sIndex - 1);
            indexRecord.source = source;
            IndexRecord record = sIndexRecordHead;
            IndexRecord last = null;
            while (record != null) {
                if (indexRecord.index <= record.index) {
                    if (null == last) {
                        IndexRecord tmp = sIndexRecordHead;
                        sIndexRecordHead = indexRecord;
                        indexRecord.next = tmp;
                    } else {
                        IndexRecord tmp = last.next;
                        if (null != last.next) {
                            last.next = indexRecord;
                        }
                        indexRecord.next = tmp;
                    }
                    return indexRecord;//2
                }
                last = record;
                record = record.next;
            }

            last.next = indexRecord;

            return indexRecord;//3
        }
    }
maskIndex方法用于生成一个IndexRecord节点,这里主要是对单链表增加节点的操作。 IndexRecord中的index属性的值根据当前sBuffer的索引sIndex决定的,也是相当于插桩方法在sBuffer的索引,这个是重点。
- 注释1处直接设置为头节点
- 注释2处,如果last==null 则在当前sIndexRecordHead之前插入,last!=null在sIndexRecordHead中间插入,具体位置根据节点的index大小来确定
- 注释3处 直接在尾节点新增 接着回到EvilMethodTracer中 刚刚介绍了dispatchBegin,接下来肯定要说dispatchEnd,和dispatchBegin一样是主线次
    @Override
    public void dispatchEnd(long beginMs, long cpuBeginMs, long endMs, long cpuEndMs, long token, boolean isBelongFrame) {
        super.dispatchEnd(beginMs, cpuBeginMs, endMs, cpuEndMs, token, isBelongFrame);
        long start = config.isDevEnv() ? System.currentTimeMillis() : 0;
        try {
            long dispatchCost = endMs - beginMs;
            if (dispatchCost >= evilThresholdMs) {
                long[] data = AppMethodBeat.getInstance().copyData(indexRecord);
                long[] queueCosts = new long[3];
                System.arraycopy(queueTypeCosts, 0, queueCosts, 0, 3);
                String scene = AppMethodBeat.getVisibleScene();
                MatrixHandlerThread.getDefaultHandler().post(new AnalyseTask(isForeground(), scene, data, queueCosts, cpuEndMs - cpuBeginMs, endMs - beginMs, endMs));
            }
        } finally {
            indexRecord.release();
            if (config.isDevEnv()) {
                String usage = Utils.calculateCpuUsage(cpuEndMs - cpuBeginMs, endMs - beginMs);
                MatrixLog.v(TAG, "[dispatchEnd] token:%s cost:%sms cpu:%sms usage:%s innerCost:%s",
                        token, endMs - beginMs, cpuEndMs - cpuBeginMs, usage, System.currentTimeMillis() - start);
            }
        }
    }
当dispatchCost超过阀值即为出现耗时方法, long[] data = AppMethodBeat.getInstance().copyData(indexRecord);获取sBuffer中的耗时方法记录
public long[] copyData(IndexRecord startRecord) {
        return copyData(startRecord, new IndexRecord(sIndex - 1));
    }

private long[] copyData(IndexRecord startRecord, IndexRecord endRecord) {
        long current = System.currentTimeMillis();
        long[] data = new long[0];
        try {
            if (startRecord.isValid && endRecord.isValid) {
                int length;
                int start = Math.max(0, startRecord.index);
                int end = Math.max(0, endRecord.index);

                if (end > start) {
                    length = end - start + 1;
                    data = new long[length];
                    System.arraycopy(sBuffer, start, data, 0, length);
                } else if (end < start) {
                    length = 1 + end + (sBuffer.length - start);
                    data = new long[length];
                    System.arraycopy(sBuffer, start, data, 0, sBuffer.length - start);
                    System.arraycopy(sBuffer, 0, data, sBuffer.length - start, end + 1);
                }
                return data;
            }
            return data;
        } catch (OutOfMemoryError e) {
            MatrixLog.e(TAG, e.toString());
            return data;
        } finally {
            MatrixLog.i(TAG, "[copyData] [%s:%s] length:%s cost:%sms", Math.max(0, startRecord.index), endRecord.index, data.length, System.currentTimeMillis() - current);
        }
    }
这里的startRecord就是之前在dispatchBegin中生成的IndexRecord节点,endRecord中index对应的是sBuffer中当前索引。这样就能截取一个message在dispatch过程中所有执行的函数。
因为默认sBuffer数组的长度是1000000,当达到最大值之后sIndex会被置为0,所以存在end< start 的情况,如下代码所示
             if (sIndex < Constants.BUFFER_SIZE) {
               mergeData(methodId, sIndex, true);
            } else {
                sIndex = 0;
                mergeData(methodId, sIndex, true);
            }
回到dispatchEnd()方法中
String scene = AppMethodBeat.getVisibleScene(); scene其实是当前所在activity
    private void updateScene(Activity activity) {
        visibleScene = activity.getClass().getName();
    }
最后在AnalyseTask中处理和上报数据 先看analyse()中的
TraceDataUtils.structuredDataToStack(data, stack, true, endMs);

 public static void structuredDataToStack(long[] buffer, LinkedList<MethodItem> result, boolean isStrict, long endTime) {
        long lastInId = 0L;
        int depth = 0;
        LinkedList<Long> rawData = new LinkedList<>();
        boolean isBegin = !isStrict;

        for (long trueId : buffer) {// 1
            if (0 == trueId) {
                continue;
            }
            if (isStrict) {
                if (isIn(trueId) && AppMethodBeat.METHOD_ID_DISPATCH == getMethodId(trueId)) {
                    isBegin = true;
                }

                if (!isBegin) {
                    MatrixLog.d(TAG, "never begin! pass this method[%s]", getMethodId(trueId));
                    continue;
                }

            }
            if (isIn(trueId)) {
                lastInId = getMethodId(trueId);
                if (lastInId == AppMethodBeat.METHOD_ID_DISPATCH) {
                    depth = 0;
                }
                depth++;
                rawData.push(trueId);
            } else {
                int outMethodId = getMethodId(trueId);
                if (!rawData.isEmpty()) {
                    long in = rawData.pop();
                    depth--;
                    int inMethodId;
                    LinkedList<Long> tmp = new LinkedList<>();
                    tmp.add(in);
                    while ((inMethodId = getMethodId(in)) != outMethodId && !rawData.isEmpty()) {
                        MatrixLog.w(TAG, "pop inMethodId[%s] to continue match ouMethodId[%s]", inMethodId, outMethodId);
                        in = rawData.pop();
                        depth--;
                        tmp.add(in);
                    }

                    if (inMethodId != outMethodId && inMethodId == AppMethodBeat.METHOD_ID_DISPATCH) {
                        MatrixLog.e(TAG, "inMethodId[%s] != outMethodId[%s] throw this outMethodId!", inMethodId, outMethodId);
                        rawData.addAll(tmp);
                        depth += rawData.size();
                        continue;
                    }

                    long outTime = getTime(trueId);
                    long inTime = getTime(in);
                    long during = outTime - inTime;
                    if (during < 0) {
                        MatrixLog.e(TAG, "[structuredDataToStack] trace during invalid:%d", during);
                        rawData.clear();
                        result.clear();
                        return;
                    }
                    MethodItem methodItem = new MethodItem(outMethodId, (int) during, depth);
                    addMethodItem(result, methodItem);//2
                } else {
                    MatrixLog.w(TAG, "[structuredDataToStack] method[%s] not found in! ", outMethodId);
                }
            }
        }

        while (!rawData.isEmpty() && isStrict) {//3
            long trueId = rawData.pop();
            int methodId = getMethodId(trueId);
            boolean isIn = isIn(trueId);
            long inTime = getTime(trueId) + AppMethodBeat.getDiffTime();
            MatrixLog.w(TAG, "[structuredDataToStack] has never out method[%s], isIn:%s, inTime:%s, endTime:%s,rawData size:%s",
                    methodId, isIn, inTime, endTime, rawData.size());
            if (!isIn) {
                MatrixLog.e(TAG, "[structuredDataToStack] why has out Method[%s]? is wrong! ", methodId);
                continue;
            }
            MethodItem methodItem = new MethodItem(methodId, (int) (endTime - inTime), rawData.size());
            addMethodItem(result, methodItem);
        }
        TreeNode root = new TreeNode(null, null);
        stackToTree(result, root);//4
        result.clear();
        treeToStack(root, result);//5
    }
先看注释1的数组遍历 这里主要是将数组中记录的方法转变成带有层级的属性depth的MethodItem链表
例如

fun1(){//depth=0
  fun2(){//depth=1
   fun3(){ //depth=2
     }
   fun4(){// depth=2
    }
  }
}
MethodItemd的属性也比较简单 层级depth,耗时,方法id
    public MethodItem(int methodId, int durTime, int depth) {
        this.methodId = methodId;
        this.durTime = durTime;
        this.depth = depth;
    }
注释2 将生成的methodItem添加到链表头结点,如果有下相同的methodId节点则更新该节点
    private static int addMethodItem(LinkedList<MethodItem> resultStack, MethodItem item) {
        if (AppMethodBeat.isDev) {
            Log.v(TAG, "method:" + item);
        }
        MethodItem last = null;
        if (!resultStack.isEmpty()) {
            last = resultStack.peek();
        }
        if (null != last && last.methodId == item.methodId && last.depth == item.depth && 0 != item.depth) {
            item.durTime = item.durTime == Constants.DEFAULT_ANR ? last.durTime : item.durTime;
            last.mergeMore(item.durTime);
            return last.durTime;
        } else {
            resultStack.push(item);
            return item.durTime;
        }
    }
注释3处主要是对不正常的数据的校验操作,通常截取的sBuffer数据i o函数都是一一对应的。
注释4处是将链表数据转化成树结构,注意这指的不是二叉树,可以理解为省市区多级的树状数据格式
public static final class TreeNode {
MethodItem item;
TreeNode father;
LinkedList<TreeNode> children = new LinkedList<>();
TreeNode(MethodItem item, TreeNode father) {
this.item = item;
this.father = father;
}
private int depth() {
return null == item ? 0 : item.depth;
}
private void add(TreeNode node) {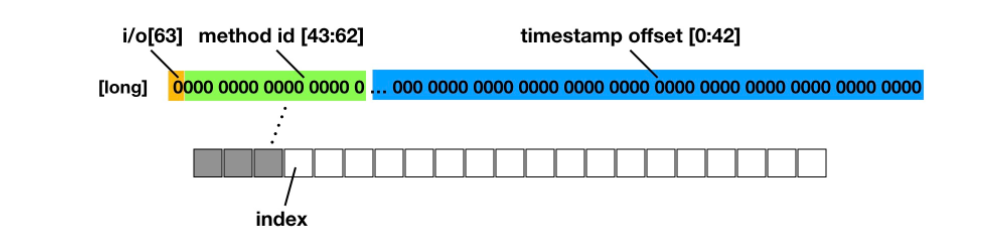
children.addFirst(node);
}
private boolean isLeaf() {
return children.isEmpty();
}
}
回到AnalyseTask的analyse()中
   TraceDataUtils.trimStack(stack, Constants.TARGET_EVIL_METHOD_STACK, new TraceDataUtils.IStructuredDataFilter() {
                    @Override
                    public boolean isFilter(long during, int filterCount) {
                        return during < filterCount * Constants.TIME_UPDATE_CYCLE_MS;
                    }

                    @Override
                    public int getFilterMaxCount() {
                        return Constants.FILTER_STACK_MAX_COUNT;
                    }

                    @Override
                    public void fallback(List<MethodItem> stack, int size) {
                        MatrixLog.w(TAG, "[fallback] size:%s targetSize:%s stack:%s", size, Constants.TARGET_EVIL_METHOD_STACK, stack);
                        Iterator iterator = stack.listIterator(Math.min(size, Constants.TARGET_EVIL_METHOD_STACK));
                        while (iterator.hasNext()) {
                            iterator.next();
                            iterator.remove();
                        }
                    }
                });
这里主要是对收集的数据进行过滤
public static void trimStack(List<MethodItem> stack, int targetCount, IStructuredDataFilter filter) {
        if (0 > targetCount) {
            stack.clear();
            return;
        }

        int filterCount = 1;
        int curStackSize = stack.size();
        while (curStackSize > targetCount) {//1
            ListIterator<MethodItem> iterator = stack.listIterator(stack.size());
            while (iterator.hasPrevious()) {
                MethodItem item = iterator.previous();
                if (filter.isFilter(item.durTime, filterCount)) {//2
                    iterator.remove();
                    curStackSize--;
                    if (curStackSize <= targetCount) {
                        return;
                    }
                }
            }
            curStackSize = stack.size();
            filterCount++;
            if (filter.getFilterMaxCount() < filterCount) {
                break;
            }
        }
        int size = stack.size();
        if (size > targetCount) {
            filter.fallback(stack, size);
        }
    }
注释1处设置了超过30个节点的阀值才会出发过滤 注释2处是对具体的耗时判断是否需要过滤;
继续回到 analyse()中
long stackCost = Math.max(cost, TraceDataUtils.stackToString(stack, reportBuilder, logcatBuilder));
这里获取最大耗时,逻辑比较简单
String stackKey = TraceDataUtils.getTreeKey(stack, stackCost);
这里是获取本次耗时方法检测数据上报时需要的一个key值,具体看下
    public static String getTreeKey(List<MethodItem> stack, long stackCost) {
        StringBuilder ss = new StringBuilder();
        long allLimit = (long) (stackCost * Constants.FILTER_STACK_KEY_ALL_PERCENT);

        LinkedList<MethodItem> sortList = new LinkedList<>();

        for (MethodItem item : stack) {
            if (item.durTime >= allLimit) {
                sortList.add(item);
            }
        }

        Collections.sort(sortList, new Comparator<MethodItem>() {
            @Override
            public int compare(MethodItem o1, MethodItem o2) {
                return Integer.compare((o2.depth + 1) * o2.durTime, (o1.depth + 1) * o1.durTime);
            }
        });

        if (sortList.isEmpty() && !stack.isEmpty()) {
            MethodItem root = stack.get(0);
            sortList.add(root);
        } else if (sortList.size() > 1 && sortList.peek().methodId == AppMethodBeat.METHOD_ID_DISPATCH) {
            sortList.removeFirst();
        }

        for (MethodItem item : sortList) {
            ss.append(item.methodId + "|");
            break;
        }
        return ss.toString();
    }
逻辑并不复杂,先根据durTime过滤数据,再根据depth和durTime进行排序;这里为什么需要用到depth,应该是考虑到调用栈层级的原因,不能只考虑单个方法的耗时。
analyse中后面就是一些json数据的设置和上报。
至此EvilMethodTracer逻辑基本说完。
AnrTracer
弄清楚了EvilMethodTracer相关逻辑AnrTracer就很简单了,ANR的根本原因就是主线程耗时导致的程序无响应
    @Override
    public void dispatchBegin(long beginMs, long cpuBeginMs, long token) {
        super.dispatchBegin(beginMs, cpuBeginMs, token);
        anrTask = new AnrHandleTask(AppMethodBeat.getInstance().maskIndex("AnrTracer#dispatchBegin"), token);
        if (traceConfig.isDevEnv()) {
            MatrixLog.v(TAG, "* [dispatchBegin] token:%s index:%s", token, anrTask.beginRecord.index);
        }
        anrHandler.postDelayed(anrTask, Constants.DEFAULT_ANR - (SystemClock.uptimeMillis() - token));
    }


    @Override
    public void dispatchEnd(long beginMs, long cpuBeginMs, long endMs, long cpuEndMs, long token, boolean isBelongFrame) {
        super.dispatchEnd(beginMs, cpuBeginMs, endMs, cpuEndMs, token, isBelongFrame);
        if (traceConfig.isDevEnv()) {
            MatrixLog.v(TAG, "[dispatchEnd] token:%s cost:%sms cpu:%sms usage:%s",
                    token, endMs - beginMs, cpuEndMs - cpuBeginMs, Utils.calculateCpuUsage(cpuEndMs - cpuBeginMs, endMs - beginMs));
        }
        if (null != anrTask) {
            anrTask.getBeginRecord().release();
            anrHandler.removeCallbacks(anrTask);
        }
    }
- dispatchBegin中延时发送了一个消息
- dispatchEnd中取消这个延时消息,如果没能取消则说明发生了ANR
- 发生了ANR数据上报
StartupTracer
    @Override
    protected void onAlive() {
        super.onAlive();
        MatrixLog.i(TAG, "[onAlive] isStartupEnable:%s", isStartupEnable);
        if (isStartupEnable) {
            AppMethodBeat.getInstance().addListener(this);
            Matrix.with().getApplication().registerActivityLifecycleCallbacks(this);
        }
    }
这里注册了两个监听
- IAppMethodBeatListener
- ActivityLifecycleCallbacks 全局Activity生命周期监听 主要看下IAppMethodBeatListener 发现他的onActivityFocused()方法是在AppMethodBeat中的at()中调用,at跟上文提到的i() o()方法一样 都是编译时期插入的,具体插入位置在Activity子类的onWindowFocusChange方法中
    public static void at(Activity activity, boolean isFocus) {
        String activityName = activity.getClass().getName();
        if (isFocus) {
            if (sFocusActivitySet.add(activityName)) {
                synchronized (listeners) {
                    for (IAppMethodBeatListener listener : listeners) {
                        listener.onActivityFocused(activityName);
                    }
                }
                MatrixLog.i(TAG, "[at] visibleScene[%s] has %s focus!", getVisibleScene(), "attach");
            }
        } else {
            if (sFocusActivitySet.remove(activityName)) {
                MatrixLog.i(TAG, "[at] visibleScene[%s] has %s focus!", getVisibleScene(), "detach");
            }
        }
    }
StartupTracer中的主要几个回调已经确定,下面具体看一下
    @Override
    public void onActivityFocused(String activity) {
        if (isColdStartup()) {
            if (firstScreenCost == 0) {
                this.firstScreenCost = uptimeMillis() - ActivityThreadHacker.getEggBrokenTime();
            }
            if (hasShowSplashActivity) {
                coldCost = uptimeMillis() - ActivityThreadHacker.getEggBrokenTime();
            } else {
                if (splashActivities.contains(activity)) {
                    hasShowSplashActivity = true;
                } else if (splashActivities.isEmpty()) {
                    MatrixLog.i(TAG, "default splash activity[%s]", activity);
                    coldCost = firstScreenCost;
                } else {
                    MatrixLog.w(TAG, "pass this activity[%s] at duration of start up! splashActivities=%s", activity, splashActivities);
                }
            }
            if (coldCost > 0) {
                analyse(ActivityThreadHacker.getApplicationCost(), firstScreenCost, coldCost, false);
            }

        } else if (isWarmStartUp()) {
            isWarmStartUp = false;
            long warmCost = uptimeMillis() - ActivityThreadHacker.getLastLaunchActivityTime();
            if (warmCost > 0) {
                analyse(ActivityThreadHacker.getApplicationCost(), firstScreenCost, warmCost, true);
            }
        }

    }
这里逻辑不复杂 主要是一些变量的含义
- ActivityThreadHacker.getEggBrokenTime(); 第一次调用AppMethodBeat.i()的时间,看作是程序启动的时间
- ActivityThreadHacker.getLastLaunchActivityTime();这里通过反射ActivityThread中的mH Handler来监听msg.what == LAUNCH_ACTIVITY的消息。 接下来的analyse()方法是数据分析和上报逻辑跟之前的EvilMethodTracer类似
    private void analyse(long applicationCost, long firstScreenCost, long allCost, boolean isWarmStartUp) {
        MatrixLog.i(TAG, "[report] applicationCost:%s firstScreenCost:%s allCost:%s isWarmStartUp:%s", applicationCost, firstScreenCost, allCost, isWarmStartUp);
        long[] data = new long[0];
        if (!isWarmStartUp && allCost >= coldStartupThresholdMs) { // for cold startup
            data = AppMethodBeat.getInstance().copyData(ActivityThreadHacker.sApplicationCreateBeginMethodIndex);
            ActivityThreadHacker.sApplicationCreateBeginMethodIndex.release();

        } else if (isWarmStartUp && allCost >= warmStartupThresholdMs) {
            data = AppMethodBeat.getInstance().copyData(ActivityThreadHacker.sLastLaunchActivityMethodIndex);
            ActivityThreadHacker.sLastLaunchActivityMethodIndex.release();
        }

        MatrixHandlerThread.getDefaultHandler().post(new AnalyseTask(data, applicationCost, firstScreenCost, allCost, isWarmStartUp, ActivityThreadHacker.sApplicationCreateScene));

    }
FrameTracer
FrameTracer模块主要FPSCollector和FrameDecorator, 主要原理是通过Choreographer获取VSync垂直同步相关回调。
  choreographer = Choreographer.getInstance();
        callbackQueueLock = reflectObject(choreographer, "mLock");
        callbackQueues = reflectObject(choreographer, "mCallbackQueues");

        addInputQueue = reflectChoreographerMethod(callbackQueues[CALLBACK_INPUT], ADD_CALLBACK, long.class, Object.class, Object.class);
        addAnimationQueue = reflectChoreographerMethod(callbackQueues[CALLBACK_ANIMATION], ADD_CALLBACK, long.class, Object.class, Object.class);
        addTraversalQueue = reflectChoreographerMethod(callbackQueues[CALLBACK_TRAVERSAL], ADD_CALLBACK, long.class, Object.class, Object.class);
        frameIntervalNanos = reflectObject(choreographer, "mFrameIntervalNanos");
通过反射获取Choreographer相关实例
 private synchronized void addFrameCallback(int type, Runnable callback, boolean isAddHeader) {
        if (callbackExist[type]) {
            MatrixLog.w(TAG, "[addFrameCallback] this type %s callback has exist! isAddHeader:%s", type, isAddHeader);
            return;
        }

        if (!isAlive && type == CALLBACK_INPUT) {
            MatrixLog.w(TAG, "[addFrameCallback] UIThreadMonitor is not alive!");
            return;
        }
        try {
            synchronized (callbackQueueLock) {
                Method method = null;
                switch (type) {
                    case CALLBACK_INPUT:
                        method = addInputQueue;
                        break;
                    case CALLBACK_ANIMATION:
                        method = addAnimationQueue;
                        break;
                    case CALLBACK_TRAVERSAL:
                        method = addTraversalQueue;
                        break;
                }
                if (null != method) {//1
                    method.invoke(callbackQueues[type], !isAddHeader ? SystemClock.uptimeMillis() : -1, callback, null);
                    callbackExist[type] = true;
                }
            }
        } catch (Exception e) {
            MatrixLog.e(TAG, e.toString());
        }
    }
注释1:向Choreographer中的mCallbackQueues中添加数据,执行结果会在callback中返回并设置耗时数据
        public void addCallbackLocked(long dueTime, Object action, Object token) {
            CallbackRecord callback = obtainCallbackLocked(dueTime, action, token);
            CallbackRecord entry = mHead;
            if (entry == null) {
                mHead = callback;
                return;
            }
            if (dueTime < entry.dueTime) {
                callback.next = entry;
                mHead = callback;
                return;
            }
            while (entry.next != null) {
                if (dueTime < entry.next.dueTime) {
                    callback.next = entry.next;
                    break;
                }
                entry = entry.next;
            }
            entry.next = callback;
        }
    private void doQueueBegin(int type) {
        queueStatus[type] = DO_QUEUE_BEGIN;
        queueCost[type] = System.nanoTime();
    }

    private void doQueueEnd(int type) {
        queueStatus[type] = DO_QUEUE_END;
        queueCost[type] = System.nanoTime() - queueCost[type];
        synchronized (this) {
            callbackExist[type] = false;
        }
    }
这是回调设置数据的地方,但是queueCost并没有用到。emmm 其实Choreographer一顿操作,FrameTracer并没有用到,仍然用的是主线程message分发的逻辑,跟EvilMethodTracer相同的逻辑
FrameTracer中的核心代码如下
    private void notifyListener(final String visibleScene, final long taskCostMs, final long frameCostMs, final boolean isContainsFrame) {
        long start = System.currentTimeMillis();
        try {
            synchronized (listeners) {
                for (final IDoFrameListener listener : listeners) {
                    if (config.isDevEnv()) {
                        listener.time = SystemClock.uptimeMillis();
                    }
                    final int dropFrame = (int) (taskCostMs / frameIntervalMs);

                    listener.doFrameSync(visibleScene, taskCostMs, frameCostMs, dropFrame, isContainsFrame);
                    if (null != listener.getExecutor()) {
                        listener.getExecutor().execute(new Runnable() {
                            @Override
                            public void run() {
                                listener.doFrameAsync(visibleScene, taskCostMs, frameCostMs, dropFrame, isContainsFrame);//1
                            }
                        });
                    }

                }
            }
        } finally {
            long cost = System.currentTimeMillis() - start;
            if (config.isDebug() && cost > frameIntervalMs) {
                MatrixLog.w(TAG, "[notifyListener] warm! maybe do heavy work in doFrameSync! size:%s cost:%sms", listeners.size(), cost);
            }
        }
    }
注释1在FPSCollector和FrameDecorator有各自的具体实现
FPSCollector中处理的掉帧数据的处理与上报
 void collect(int droppedFrames, boolean isContainsFrame) {
            long frameIntervalCost = UIThreadMonitor.getMonitor().getFrameIntervalNanos();
            sumFrameCost += (droppedFrames + 1) * frameIntervalCost / Constants.TIME_MILLIS_TO_NANO;
            sumDroppedFrames += droppedFrames;
            sumFrame++;
            if (!isContainsFrame) {
                sumTaskFrame++;
            }

            if (droppedFrames >= frozenThreshold) {
                dropLevel[DropStatus.DROPPED_FROZEN.index]++;
                dropSum[DropStatus.DROPPED_FROZEN.index] += droppedFrames;
            } else if (droppedFrames >= highThreshold) {
                dropLevel[DropStatus.DROPPED_HIGH.index]++;
                dropSum[DropStatus.DROPPED_HIGH.index] += droppedFrames;
            } else if (droppedFrames >= middleThreshold) {
                dropLevel[DropStatus.DROPPED_MIDDLE.index]++;
                dropSum[DropStatus.DROPPED_MIDDLE.index] += droppedFrames;
            } else if (droppedFrames >= normalThreshold) {
                dropLevel[DropStatus.DROPPED_NORMAL.index]++;
                dropSum[DropStatus.DROPPED_NORMAL.index] += droppedFrames;
            } else {
                dropLevel[DropStatus.DROPPED_BEST.index]++;
                dropSum[DropStatus.DROPPED_BEST.index] += (droppedFrames < 0 ? 0 : droppedFrames);
            }
        }
- 收集掉帧的数主要是通过主线成一个dispatch的时间计算得到的
- 对于掉帧数设置了5个等级
FrameDecorator中主要是根据帧率绘制了一个view,实时展示,更加直观。这部分逻辑比较简单,不做过多介绍。
    @Override
    public void doFrameAsync(String visibleScene, long taskCost, long frameCostMs, int droppedFrames, boolean isContainsFrame) {
        super.doFrameAsync(visibleScene, taskCost, frameCostMs, droppedFrames, isContainsFrame);
        sumFrameCost += (droppedFrames + 1) * UIThreadMonitor.getMonitor().getFrameIntervalNanos() / Constants.TIME_MILLIS_TO_NANO;
        sumFrames += 1;
        long duration = sumFrameCost - lastCost[0];

        long collectFrame = sumFrames - lastFrames[0];
        if (duration >= 200) {
            final float fps = Math.min(60.f, 1000.f * collectFrame / duration);
            updateView(view.fpsView, fps);
            view.chartView.addFps((int) fps);
            lastCost[0] = sumFrameCost;
            lastFrames[0] = sumFrames;
            mainHandler.removeCallbacks(updateDefaultRunnable);
            mainHandler.postDelayed(updateDefaultRunnable, 130);
        }
    }


   private void updateView(final TextView view, final float fps) {
        mainHandler.post(new Runnable() {
            @Override
            public void run() {
                view.setText(String.format("%.2f FPS", fps));
                if (fps >= 50) {
                    view.setTextColor(view.getResources().getColor(android.R.color.holo_green_dark));
                } else if (fps >= 30) {
                    view.setTextColor(view.getResources().getColor(android.R.color.holo_orange_dark));
                } else {
                    view.setTextColor(view.getResources().getColor(android.R.color.holo_red_dark));
                }
            }
        });
    }
总结
matrix Trace—Canary的框架介绍完了,框架结构还是比较清晰,并不复杂,主要是数据处理模块比较繁琐,但这也是trace相对于其他框架的优势之一,能够完整的记录耗时的函数调用栈情况。
