- 本文利用爬虫爬取了贝壳网上海市房屋出租数据,利用python对数据进行清洗、分析和展示,并对房屋租金进行数据挖掘建模预测。
# 导入相关包
import pandas as pd
import numpy as np
import seaborn as sns
import matplotlib as mpl
import matplotlib.pyplot as plt
from IPython.display import display, Image

# 设置中文正常显示,设置负号正常显示
mpl.rcParams['font.sans-serif']=['SimHei']
mpl.rcParams['axes.unicode_minus']=False
sns.set_style({'font.sans-serif':['SimHei','Arial']})

%matplotlib inline
一、 爬虫部分
# 导入相关包
import requests
from bs4 import BeautifulSoup
import json
import re
# 避免反扒,构建header和cookies,否则网站会检测不合法的访问请求头部信息,返回404.
# header
r_h = {'User-Agent': 'Mozilla/5.0 (Windows NT 10.0; Win64; x64; rv:76.0) Gecko/20100101 Firefox/76.0'}
# cookies
r_c = {}
cookies = '''F12在网络里查看'''
for i in cookies.split('; '):
    r_c[i.split('=')[0]] = i.split('=')[1]

# 构造爬虫网站基础结构
district = ['jingan', 'xuhui', 'huangpu', 'changning', 'putuo', 'pudong',
            'baoshan', 'hongkou', 'yangpu', 'minhang', 'jinshan', 'jiading',
            'chongming', 'fengxian', 'songjiang', 'qingpu']
base_url = 'https://sh.zu.ke.com/zufang/'

# 求出每个区共有多少页房源信息
district_info = {}
for i in district:
    pg_i = requests.get(url=base_url + i + '/', headers=r_h, cookies = r_c)
    pgsoup_i = BeautifulSoup(pg_i.text, 'lxml')
    num_i = pgsoup_i.find('div', class_ = "content__pg").attrs['data-totalpage']
    district_info[i] = int(num_i)

# 建立爬虫网站
url_list = []
for i, num in district_info.items():
    for j in range(1, num + 1):
        url_i = base_url + i + '/' + 'pg' + str(j) + '/'
        url_list.append(url_i)

# 爬取网页信息函数
def data_request(urli, r_h, r_c):
    r_i = requests.get(url=urli, headers=r_h, cookies = r_c)
    soup_i = BeautifulSoup(r_i.text, 'lxml')
    div = soup_i.find('div', class_ = "content__list")
    info_list = div.find_all('div', class_ = "content__list--item--main")
    data_i = []
    for info in info_list:
        item = {}
        item['region'] = urli.split('/')[-3]
        item['info'] = info
        data_i.append(item)
    return data_i
# 爬取网页信息
data = []
for i in url_list:
    data.extend(data_request(i, r_h, r_c))
二、 数据清洗
# 建立数据清洗函数,从爬取网站信息中获取需要分析的字段
def data_clear(data_i):
    item = {}
    item['region'] = data_i['region']
    info = data_i['info']
    item['house_info'] = ''.join(re.findall(r'\n\n\n(.+)\n\n\n', info.get_text())).replace(' ','')
    item['location_info'] = ''.join(re.findall(r'\n\n\n(.+)\n/\n', info.get_text())).replace(' ','')
    item['area_info'] = ''.join(re.findall(r'\n/\n(.+)㎡\n', info.get_text())).replace(' ','')
    item['floor_info'] = ''.join(re.findall(r'\n/\n(.+))\n', info.get_text())).replace(' ','').replace('(','')
    item['direction_info'] = ''.join(re.findall(r'\n(.+)/\n', info.get_text())).replace(' ','').replace('/','')
    item['layout_info'] = ''.join(re.findall(r'/\n(.+)\n/\n', info.get_text())).replace(' ','')
    item['price_info'] = ''.join(re.findall(r'\n\n(.+)元/月\n', info.get_text())).replace(' ','')
    item['other_info'] = ''.join(re.findall(r'\n                  \n\n\n([\s\S]*)\n\n', info.get_text())).replace(' ','')
    return item
# 数据清洗
data_c = []
for data_i in data:
    data_c.append(data_clear(data_i))
三、 数据存储
# 导入相关工具包,建立连接
import pymongo
myclient = pymongo.MongoClient("mongodb://localhost:27017/")
db = myclient['data']
beike_data = db['beike_data']
# 导入数据至 mongodb
beike_data.insert_many(data_c)
# 正常的采集流程应为采集一条存入一条,
# 存储应在数据采集阶段完成,本文仅为了演示mongodb大致用法,
# 读者可自行尝试采集阶段存储,方法是一致的
<pymongo.results.InsertManyResult at 0x260c3179508>
# 对数据简单处理
data_pre = pd.read_csv("pd_data.csv",index_col=0)
# 查看数据大致结构
data_pre[:3]

# 去掉与分析无关的字段
data_pre = data_pre.drop(['_id', 'region'], axis=1)
#
# 查看个字段数据类型
data_pre.info()
# OUTPUT
<class 'pandas.core.frame.DataFrame'>
Int64Index: 36622 entries, 0 to 36621
Data columns (total 8 columns):
area_info         36131 non-null object
direction_info    36499 non-null object
floor_info        34720 non-null object
house_info        36622 non-null object
layout_info       34729 non-null object
location_info     36131 non-null object
other_info        34720 non-null object
price_info        36622 non-null object
dtypes: object(8)
memory usage: 2.5+ MB
# 创建空数据框
beike_df = pd.DataFrame()
# 提取字段
beike_df['Area'] = data_pre['area_info']
beike_df['Price'] = data_pre['price_info']
beike_df['Direction'] = data_pre['direction_info']
beike_df['Layout'] = data_pre['layout_info']
beike_df['Relative height'] = data_pre['floor_info'].str.split('楼层', expand = True)[0]
beike_df['Total floors'] = data_pre['floor_info'].str.split('楼层', expand = True)[1].str[:-1]
beike_df['Renting modes'] = data_pre['house_info'].str.split('·', expand = True)[0]
beike_df['District'] = data_pre['location_info'].str.split('-', expand = True)[0]
beike_df['Street'] = data_pre['location_info'].str.split('-', expand = True)[1]
beike_df['Community'] = data_pre['location_info'].str.split('-', expand = True)[2]
beike_df['Metro'] = data_pre['other_info'].str.contains('地铁') + 0
beike_df['Decoration'] = data_pre['other_info'].str.contains('精装') + 0
beike_df['Apartment'] = data_pre['other_info'].str.contains('公寓') + 0
# 数据列位置重排方便查看,存至csv
columns = ['District', 'Street', 'Community', 'Renting modes','Layout', 'Total floors', 'Relative height', 'Area', 'Direction', 'Metro','Decoration', 'Apartment', 'Price']
df = pd.DataFrame(beike_df, columns = columns)
df.to_csv("df.csv",sep=',')
四、 添加经纬度地理信息字段
# 构造中心点,取上海国际饭店作为中心点
center = (121.4671328,31.23570852)
# 将地点名称列单独导出,由第三方平台转化为经纬度信息
location_info = data_pre['location_info'].str.replace('-', '')
location_info.to_csv("location_info.csv",header='location',sep=',')
https://maplocation.sjfkai.com/ 从该网站将地理信息点转化为对应的经纬度坐标(百度坐标系)
https://github.com/wandergis/coordTransform_py coordTransform_py模块将百度坐标系下的经纬度转换为国际坐标系wgs84
# 模块说明
# coord_converter.py [-h] -i INPUT -o OUTPUT -t TYPE [-n LNG_COLUMN] [-a LAT_COLUMN] [-s SKIP_INVALID_ROW]

# arguments:
#  -i , --input          Location of input file
#  -o , --output         Location of output file
#  -t , --type           Convert type, must be one of: g2b, b2g, w2g, g2w, b2w,
#                        w2b
#  -n , --lng_column     Column name for longitude (default: lng)
#  -a , --lat_column     Column name for latitude (default: lat)
#  -s , --skip_invalid_row
#                        Whether to skip invalid row (default: False)
# 将各点地理信息读入到pandas
geographic_info = pd.read_csv("wgs84.csv",index_col=0)
# 合并经纬度
def point(x,y):
    return(x,y)
geographic_info['point'] = geographic_info.apply(lambda row:point(row['lat'],row['lng']),axis=1)
# 利用geopy计算各点与中心点之间的距离,作为一个字段反映租房位置接近市中心的程度
from geopy.distance import great_circle
center = (31.23570852,121.4671328)
list_d = []
for point in geographic_info['point']:
    list_d.append(great_circle(point, center).km)

geographic_info.insert(loc=4,column='distance',value=list_d
#
# 导出至csv,留存备用
geographic_info.to_csv("geographic_info.csv",sep=',')
五、 数据进一步处理及特征工程
df=pd.read_csv("df.csv",index_col=0)
#
# 查看数据类型及缺失情况
df.info()
#
# OUTPUT
<class 'pandas.core.frame.DataFrame'>
Int64Index: 36622 entries, 0 to 36621
Data columns (total 13 columns):
District           36131 non-null object
Street             34728 non-null object
Community          34729 non-null object
Renting modes      36622 non-null object
Layout             34729 non-null object
Total floors       34712 non-null float64
Relative height    34720 non-null object
Area               36131 non-null object
Direction          36499 non-null object
Metro              34720 non-null float64
Decoration         34720 non-null float64
Apartment          34720 non-null float64
Price              36622 non-null object
dtypes: float64(4), object(9)
memory usage: 3.9+ MB***
房屋所属街区和小区,房屋装修情况等信息缺失较多,因信息无法通过填充等方式补全,后续会通过移除的方式进行处理。
# 查看各个字段的数据分布,主要为了清除无效的数据(比如“未知”等不合理数据)
df['District'].value_counts()
df['Street'].value_counts()
df['Community'].value_counts()
df['Renting modes'].value_counts()
df['Total floors'].value_counts()
df['Relative height'].value_counts()
df['Layout'].value_counts()
# 去除空值
df = df.dropna(how='any')
# 将价格和面积字段的数据类型改为浮点型
df[['Price','Area']] = df[['Price','Area']].astype(float)
# 将地铁有无、装修类型、是否是公寓字段类型改为整型
df[['Metro','Decoration','Apartment']] = df[['Metro','Decoration','Apartment']].astype(int)
# 去掉房屋布局为未知的数据
df = df[~df['Layout'].str.contains("未知")]
df.dtypes
# OUTPUT
District            object
Street              object
Community           object
Renting modes       object
Layout              object
Total floors       float64
Relative height     object
Area               float64
Direction           object
Metro                int32
Decoration           int32
Apartment            int32
Price              float64
dtype: object
- 房屋朝向
# 房屋朝向较分布不符合常理,需要进行清理
df['Direction'].value_counts()
# OUTPUT
南            25809
南北            2956
北             1980
东南             835
东              792
西              534
西南             499
西北             217
东南南            202
东北             160
南西南             69
东东南南西南西         66
南西              57
东西              41
东南北             36
东东南南北           35
东东南             31
南西北             30
东南西北            29
东东南南            21
东东南南西南北         19
东南西南            15
西南西             13
东南南西南北           8
东南南北             8
西西北              7
南西南西             6
东南南西南            6
北东北              5
西南东北             5
东南西              5
南东北              5
西南西北             5
东南南北东北           5
东西北              4
南西北北             4
西南北              4
南西南北             3
东南南西北            3
东东南北             3
南北东北             3
东南南西北北           3
西南西西北            3
东南东北             3
东南南西             3
东东南南西北北          2
东东南南西南           2
西北北              2
东东北              2
东南西南西西北东北        1
南西南西北            1
南西西北北            1
东南南西西北北          1
东北东北             1
西西北北             1
西东北              1
Name: Direction, dtype: int64
# 构建清理字典,主要思路将重复的朝向更改为简单类型
cleanup_nums= {"东南南":"东南","南西南":"西南","东东南南西南西":"东西南",
               "南西":"西南","东东南南北":"东南北","东东南":"东南",
               "南西北":"西南北","东南西北":"东西南北","东东南南":"东南",
               "东东南南西南北":"东西南北","东南西南":"东西南","西南西":"西南",
               "东南南西南北":"东西南北","东南南北":"东南北","西西北":"西北",
               "南西南西":"西南","东南南西南":"东西南","西南东北":"东西南北",
               "西南西北":"西南北","南东北":"东南北","北东北":"东北",
               "东南南北东北":"东南北","东南西":"东西南","南西北北":"西南北",
               "东南东北":"东南北","南北东北":"东南北","东东南北":"东南北",
               "东南南西北北":"东西南北","南西南北":"西南北","西南西西北":"西南北",
               "东南南西北":"东西南北","东南南西":"东西南","东东北":"东北",
               "西北北":"西北","东东南南西南":"东西南","东东南南西北北":"东西南北",
               "东南南西西北北":"东西南北","南西西北北":"西南北","东北东北":"东北",
               "东南西南西西北东北":"东西南北","南西南西北":"西南北","西西北北":"西北",
               "西东北":"东西北"
              }
df['Direction'].replace(cleanup_nums,inplace=True)
# 上面字典构建太繁琐,可以考虑先做一次去重,然后构建字典,会省去很多重复工作。
#for i in len(df['Direction']):
#   df['Direction'][i] = ''.join(set(df['Direction'][i]))
#df['Direction']
#df['Direction'].value_counts()
#cleanup_nums构建较少字典即可
#df['Direction'].replace(cleanup_nums,inplace=True)
# 清理之后的房屋朝向信息
df['Direction'].value_counts()
# OUTPUT
南       25809
南北       2956
北        1980
东南       1089
东         792
西南        644
西         534
西北        227
东北        168
东南北        98
东西南        97
东西南北       71
西南北        51
东西         41
东西北         5
Name: Direction, dtype: int64
- 房屋面积
df_aera = df['Area']
#sns直方图
f, (ax_box, ax_hist) = plt.subplots(2, sharex=True, gridspec_kw={"height_ratios": (.15, .85)}, figsize=(16, 10))
sns.boxplot(df_aera, ax=ax_box )
sns.distplot(df_aera, bins=40, ax=ax_hist)
# 不显示箱形图的横坐标
ax_box.set(xlabel='')
ax_box.set_title('房屋面积分布')
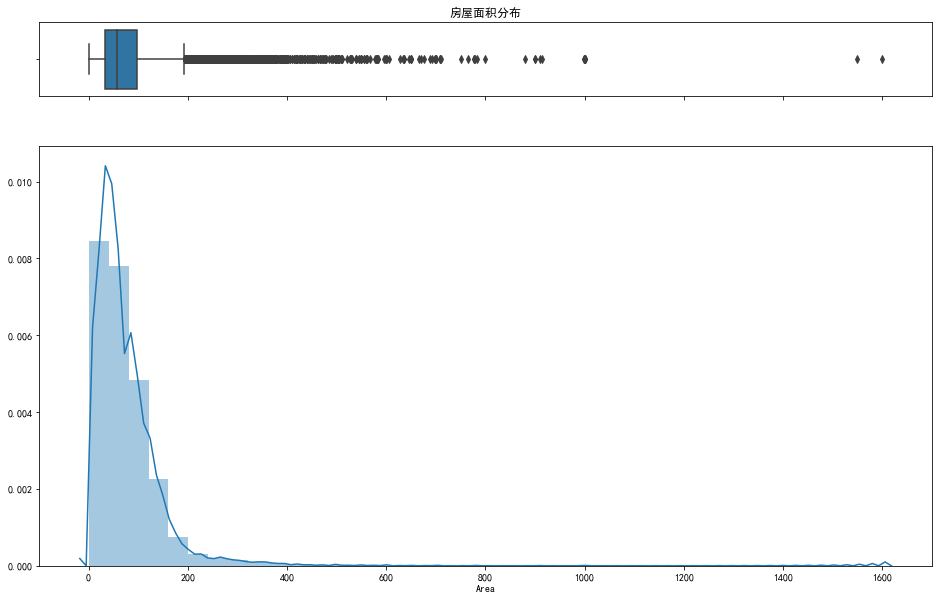
房屋面积分布为长尾分布,不符合数据建模要求的正态分布,这里先简单处理以下,主要处理思路为,将面积大于800平小于6平的明显不属于住宅性质的数据移除,对于400平以上但是只有1室的数据也做移除处理。
df = df[(df['Area'] < 800)]
df = df[~(df['Area'] < 6)]
df = df[~((df['Area'] > 400) & (df['Layout'].str.contains('1室')))]
df_aera = df['Area']
#sns直方图
f, (ax_box, ax_hist) = plt.subplots(2, sharex=True, gridspec_kw={"height_ratios": (.15, .85)},figsize=(16, 10))
sns.boxplot(df_aera, ax=ax_box)
sns.distplot(df_aera, bins=40, ax=ax_hist)
# Remove x axis name for the boxplot 不显示箱形图的横坐标
ax_box.set(xlabel='')
ax_box.set_title('房屋面积分布')
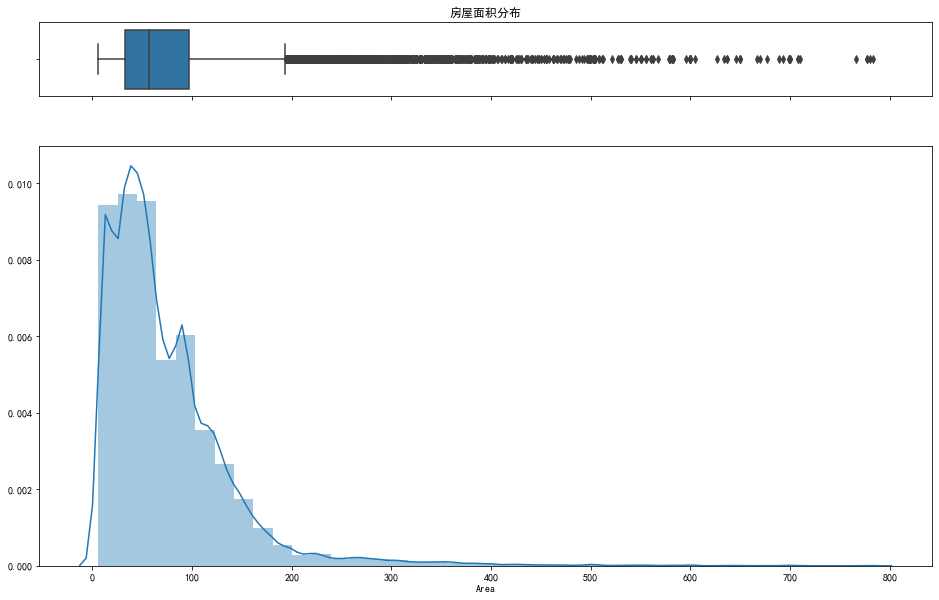
清理之后的数据如图,后续会进一步做处理。
- 房屋价格
f, ax_reg = plt.subplots(figsize=(16, 6))
sns.regplot(x='Area', y='Price', data=df, ax=ax_reg)
ax_reg.set_title('房屋面积与价格分布关系')
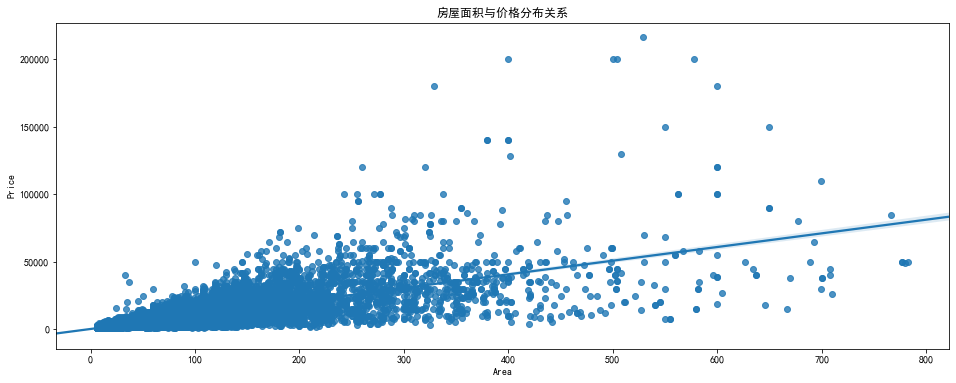
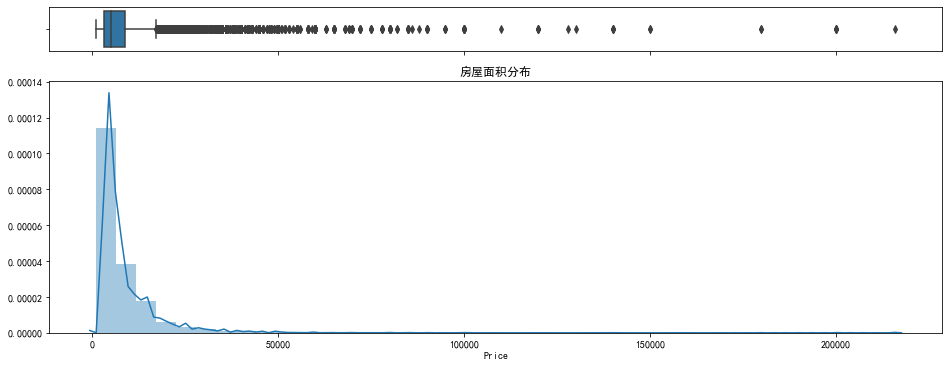
在对房屋面积做了初步清理后,房屋价格仍然会有一些离群点,后续将进行清理,主要将价格大于100000的数据移除。
df_price = df['Price']
df = df[df['Price'] < 100000]
df_price = df['Price']
f, (ax_box, ax_hist) = plt.subplots(2, sharex=True, gridspec_kw={"height_ratios": (.15, .85)},figsize=(16, 6))
sns.boxplot(df_price, ax=ax_box)
sns.distplot(df_price, bins=40, ax=ax_hist)
# 不显示箱形图的横坐标
ax_box.set(xlabel='')
ax_box.set_title('房屋面积分布')
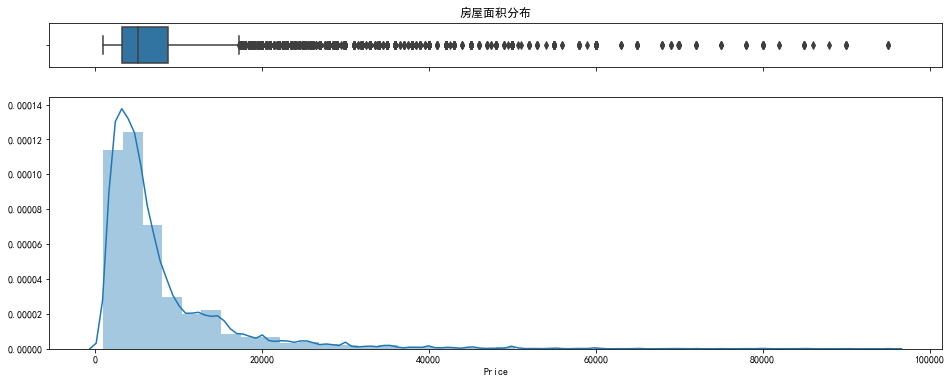
f, ax_reg = plt.subplots(figsize=(16, 6))
sns.regplot(x='Area', y='Price', data=df, ax=ax_reg)
ax_reg.set_title('房屋面积与价格分布关系')
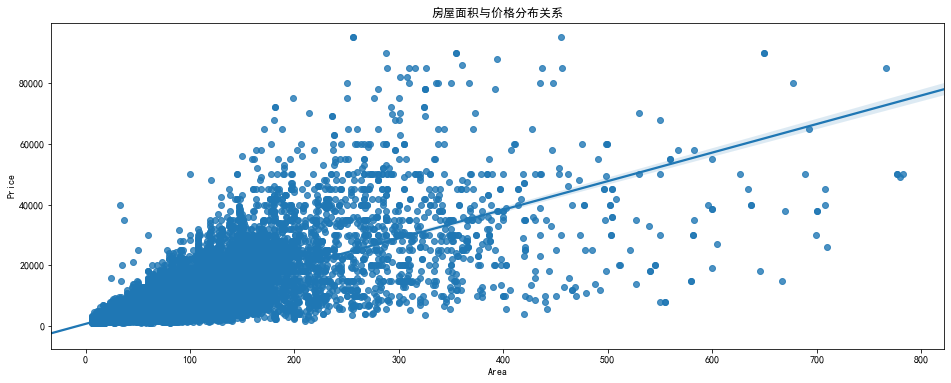
仍会有一些离群点,但是数据质量已经好了很多。
- 将地理信息表与房屋信息表合并
# 做连接字段
df['region'] = df['District'] + df['Street'] + df['Community']
geo=pd.read_csv("geographic_info.csv",index_col=0)
df_geo = pd.merge(df, geo, on='region', how='left')
# 去除分析无关字段
df_geo = df_geo.drop(['region', 'point'], axis=1)
# 添加电梯字段,爬取的原始数据中无电梯信息,主要根据总楼层高度来判断,默认总楼层大于6层即有电梯
elevator = (df_geo['Total floors'] > 6) + 0
df_geo.insert(loc=4,column='Elevator',value=elevator)
# 导出数据
df_geo.to_csv("df_geo.csv", sep=',')
六、 数据可视化
# 对基础字段进行数据可视化,以了解数据分布信息,对数据进行进一步处理。
df_geo = pd.read_csv("df_geo.csv",index_col=0)
# 可视化主要用交互式可视化包 bokeh 和 pyecharts
# 导入相关包
from bokeh.io import output_notebook
from bokeh.plotting import figure, show
from bokeh.models import ColumnDataSource
output_notebook()


import pyecharts.options as opts
from pyecharts.globals import ThemeType
from pyecharts.faker import Faker
from pyecharts.charts import Grid, Boxplot, Scatter, Pie, Bar
(https://bokeh.pydata.org)BokehJS 1.2.0 successfully loaded.
- 租赁方式可视化
# 租赁方式可视化
Renting_modes_group = df_geo.groupby('Renting modes')['Price'].count()
val = list(Renting_modes_group.astype('float64'))
var = list(Renting_modes_group.index)
p_group = (
    Pie(opts.InitOpts(width="1000px",height="600px",theme=ThemeType.LIGHT))
    .add("", [list(z) for z in zip(var, val)])
    .set_global_opts(title_opts=opts.TitleOpts(title="出租形式分布"),
                 legend_opts=opts.LegendOpts(type_="scroll", pos_right="middle", orient="vertical"),
                 toolbox_opts=opts.ToolboxOpts())
    .set_series_opts(label_opts=opts.LabelOpts(formatter="{b}: {c}"))
)
p_group.render_notebook()
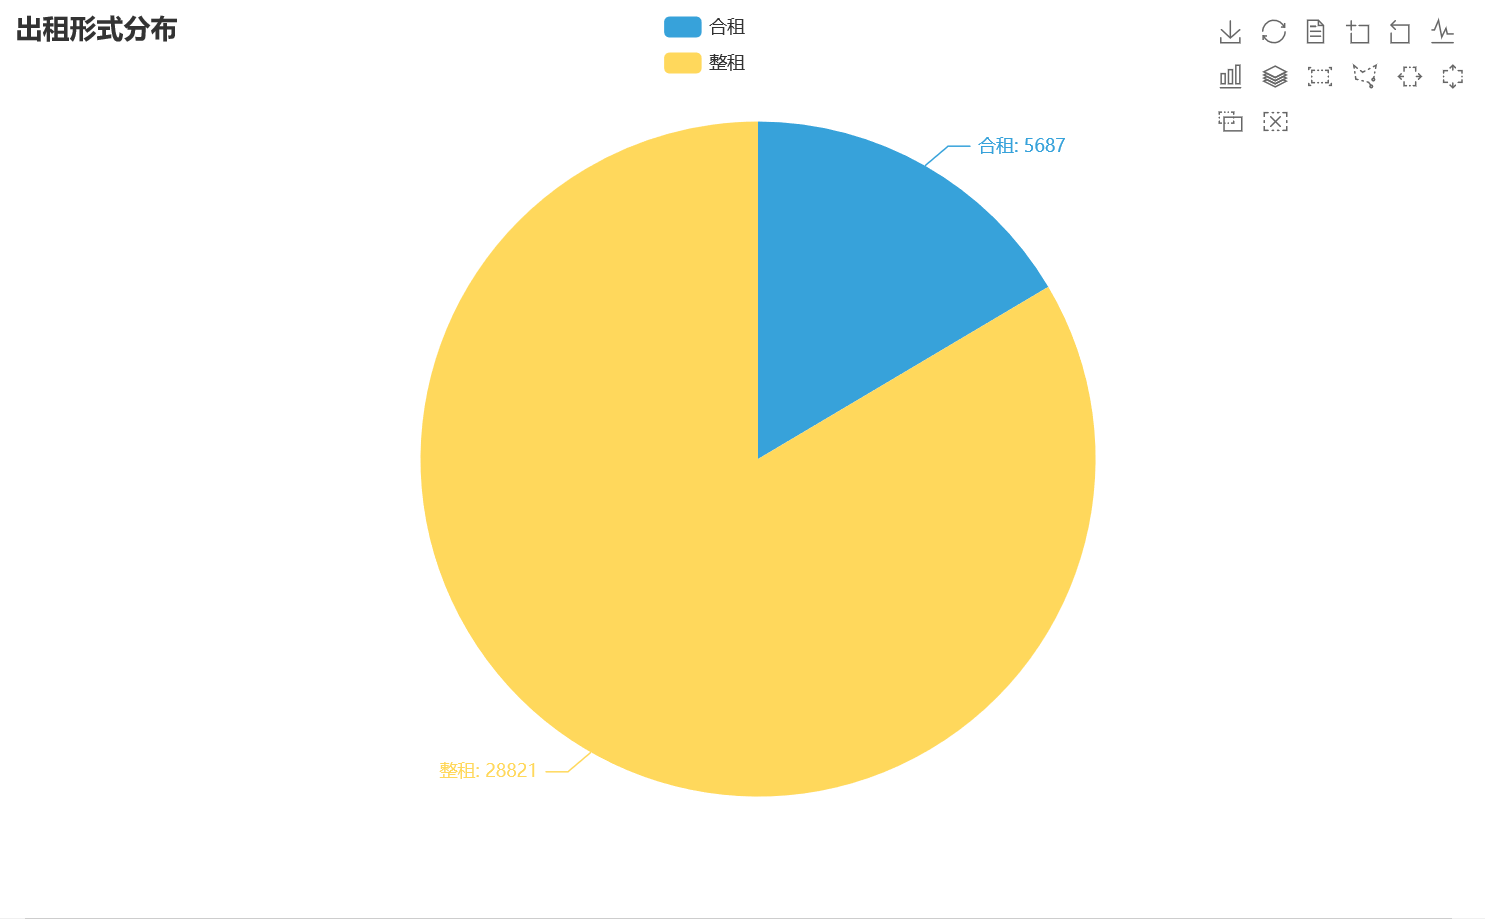
其中合租数据共5687份,因合租数据较难推测房屋整租租金,对于研究租金整体分布无法利用,且合租占总数据的比重较少,本次分析做去除处理,后续可以单开一个专题做合租租金的分布研究。
df_geo = df_geo[~(df_geo['Renting modes'] == '合租')]
- 地理距离可视化
# 距离上海市中心点70公里以外的数据已超出上海市边界,属于数据处理产生的错误点,做移除处理
df_geo = df_geo[~(df_geo['distance'] > 70)]
# 对距离字段做分桶处理,分为0-5,5-10,10-20,20-70,数字越大距市中心越远。
bins = [0, 5, 10, 20, 70]
cats = pd.cut(df_geo.distance,bins)
df_geo['cats'] = cats

f, ax1 = plt.subplots(figsize=(16, 6))
sns.countplot(df_geo['cats'], ax=ax1, palette="husl")
ax1.set_title('距市中心不同距离出租房屋数量分布')

f, ax2 = plt.subplots(figsize=(16, 6))
sns.boxplot(x='cats', y='Price', data=df_geo, ax=ax2, palette="husl")
ax2.set_title('距市中心不同距离出租房屋价格分布')

plt.show()
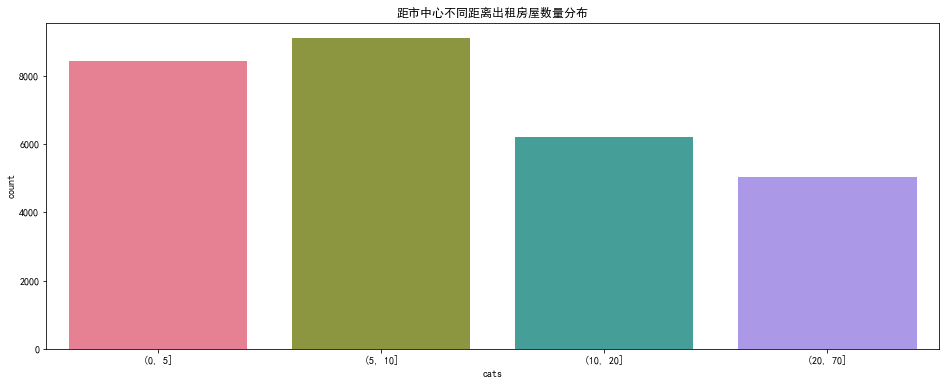
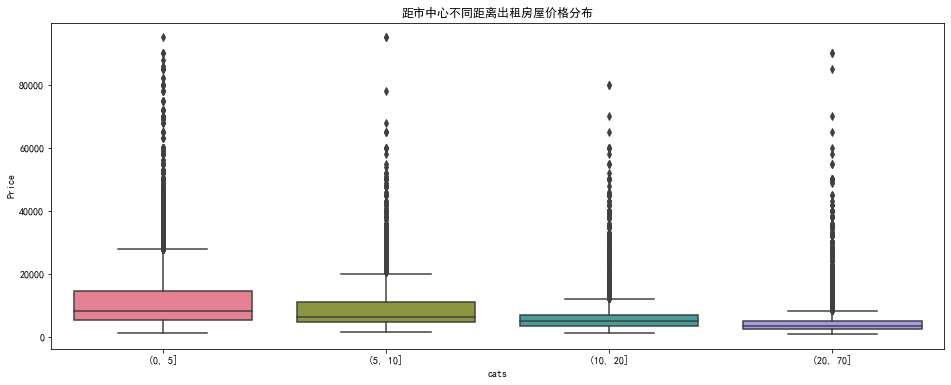
从图中可以看出距市中心5-10公里范围内出租房屋数量最多,其次是0-5公里范围内,再偏远一些的范围房屋数量相对较少一些,说明大部分人租房范围在距市中心10公里以内。随着距市中心越来越远,出租房屋均价也越来越低,大约每个范围均价之间有2000元的差距。
- 房屋面积可视化
df_area = df_geo['Area']
df_price = df_geo['Area']
# bokeh直方图
hist, edge = np.histogram(df_area, bins=50)
p = figure(title="出租房屋面积分布",plot_width=1000, plot_height=600, toolbar_location="above",tooltips="数量: @top")
p.quad(top=hist, bottom=0, left=edge[:-1], right=edge[1:], line_color="white")

show(p)
#pyecharts直方图
hist, edge = np.histogram(df_area, bins=50)
x_data = list(edge[1:])
y_data = list(hist.astype('float64'))
bar = (
        Bar(init_opts = opts.InitOpts(width="1000px",height="600px",theme=ThemeType.LIGHT))
        .add_xaxis(xaxis_data=x_data)
        .add_yaxis("数量", yaxis_data=y_data,category_gap=1)
        .set_global_opts(title_opts=opts.TitleOpts(title="出租房屋面积分布"),
                        legend_opts=opts.LegendOpts(type_="scroll", pos_right="middle", orient="vertical"),
                        datazoom_opts=[opts.DataZoomOpts(type_="slider")], toolbox_opts=opts.ToolboxOpts(),
                        tooltip_opts=opts.TooltipOpts(is_show=True,axis_pointer_type= "line",trigger="item",formatter='{c}'))
        .set_series_opts(label_opts=opts.LabelOpts(is_show=False))
        )
bar.render_notebook()
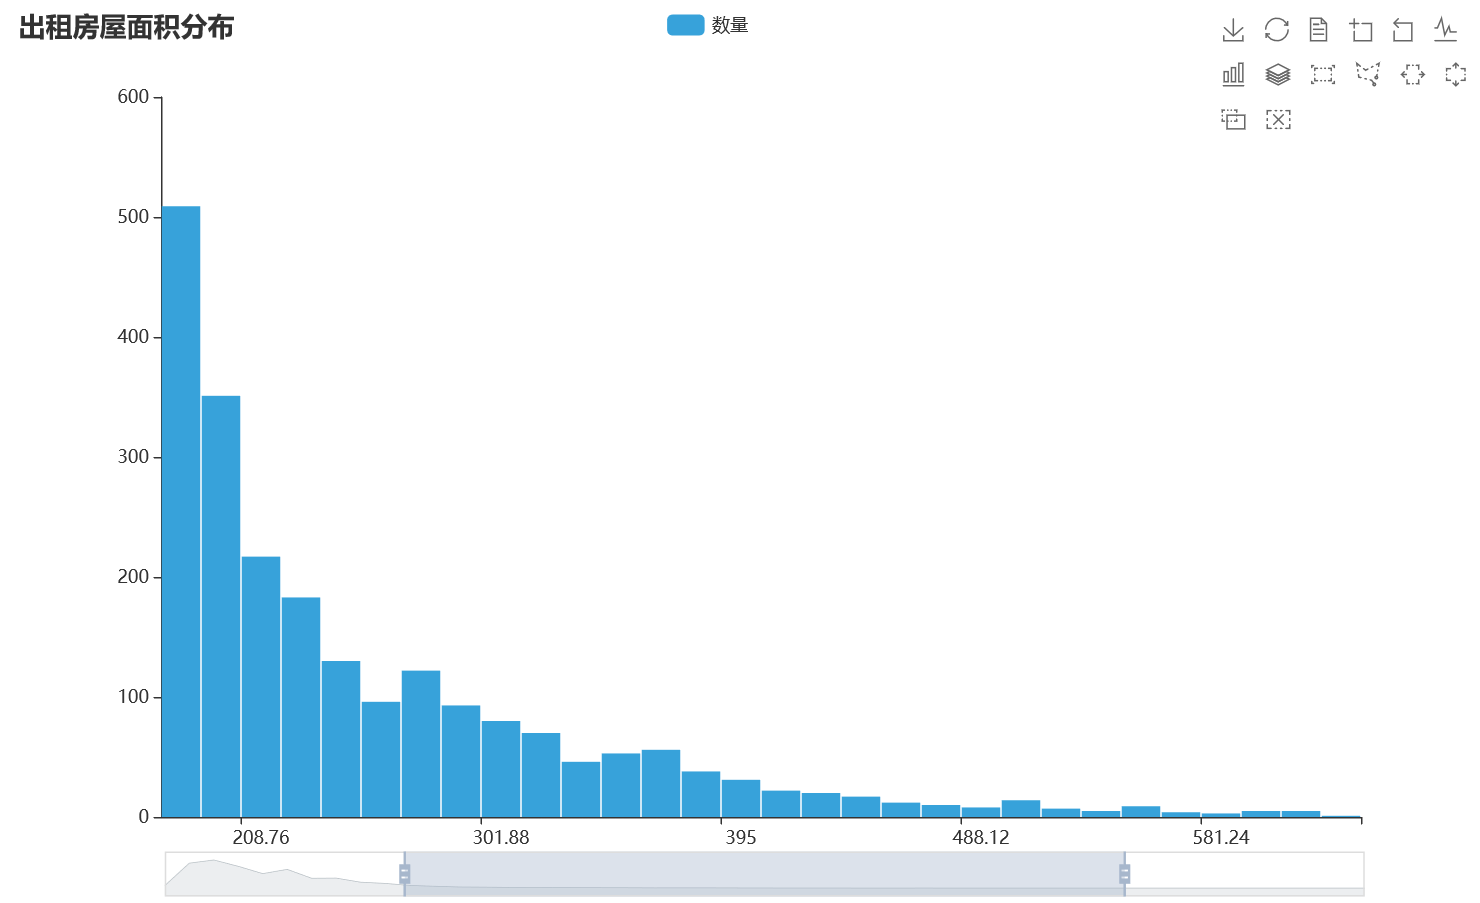
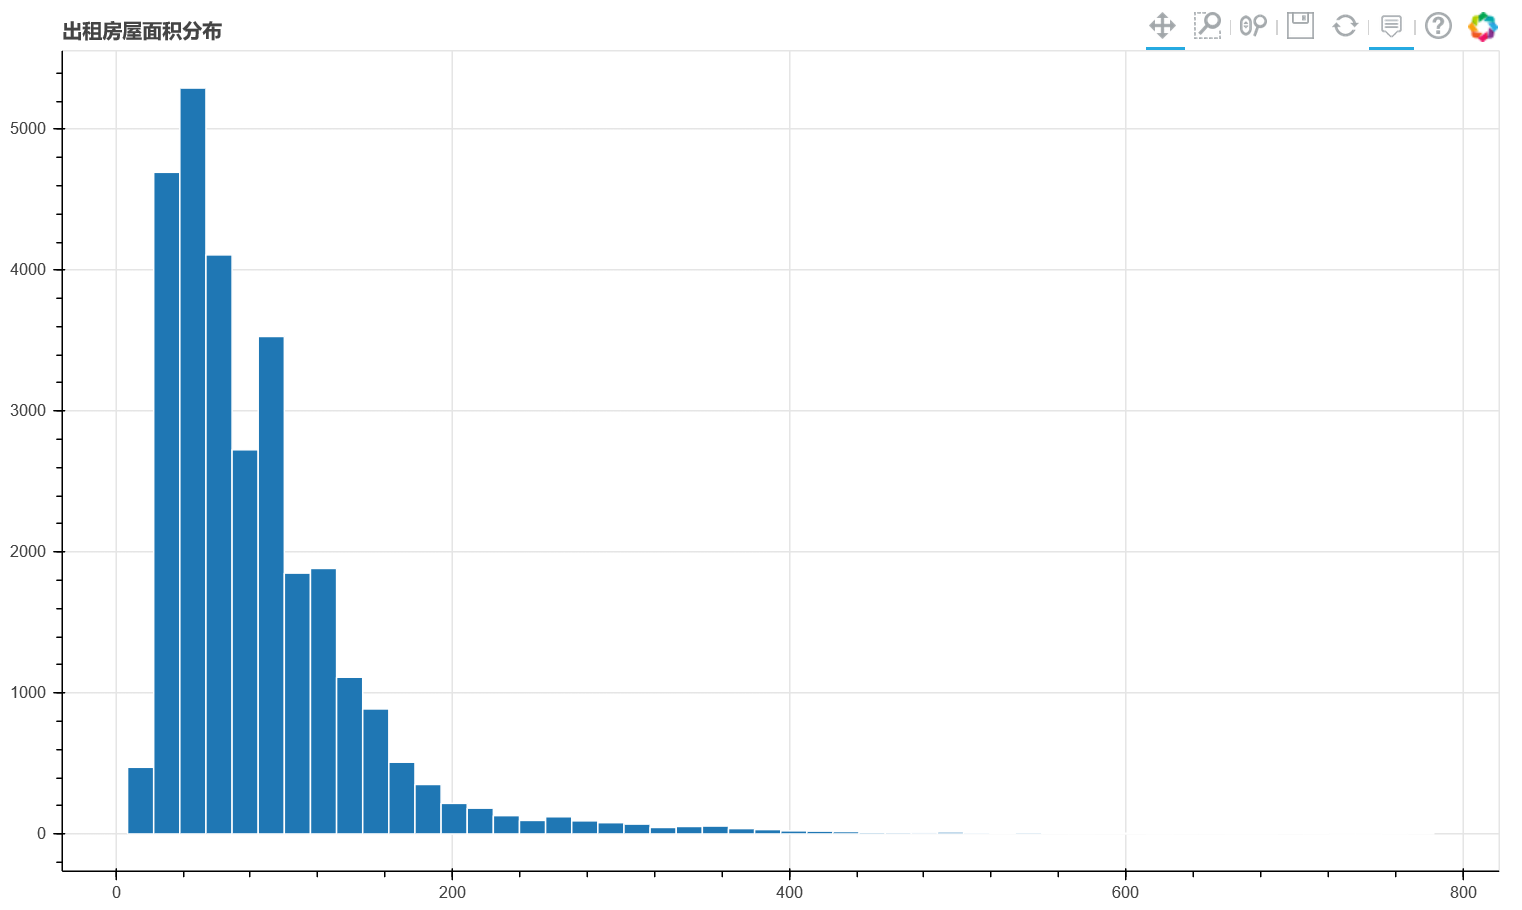
两种交互式的可视化比Seaborn有很多优势,可以点选查看每个条目的数量,拖动以观察感兴趣的区间。
- 各城区出租房屋租金价格及数量分布
df_geo['Persq']=df_geo['Price']/df_geo['Area']
region_group_price = df_geo.groupby('District')['Price'].count().sort_values(ascending=False).to_frame().reset_index()
region_group_Persq = df_geo.groupby('District')['Persq'].mean().sort_values(ascending=False).to_frame().reset_index()
region_group = pd.merge(region_group_price, region_group_Persq, on='District')
x_region = list(region_group['District'])
y1_region = list(region_group['Price'].astype('float64'))
y2_region = list(region_group['Persq'])
bar_group = (
    Bar(opts.InitOpts(width="1000px",height="400px",theme=ThemeType.LIGHT))
    .add_xaxis(x_region)
    .add_yaxis("Num", y1_region, gap="5%")
    .add_yaxis("Persq", y2_region, gap="5%")
    .set_series_opts(label_opts=opts.LabelOpts(is_show=False))
    .set_global_opts(title_opts=opts.TitleOpts(title="各区租房数量与单位面积租金价格"),
                    legend_opts=opts.LegendOpts(type_="scroll", pos_right="middle", orient="vertical"),
                    datazoom_opts=[opts.DataZoomOpts(type_="slider")],
                    toolbox_opts=opts.ToolboxOpts(),
                    tooltip_opts=opts.TooltipOpts(is_show=True,axis_pointer_type= "line",trigger="item",formatter='{c}'))
    )
bar_group.render_notebook()
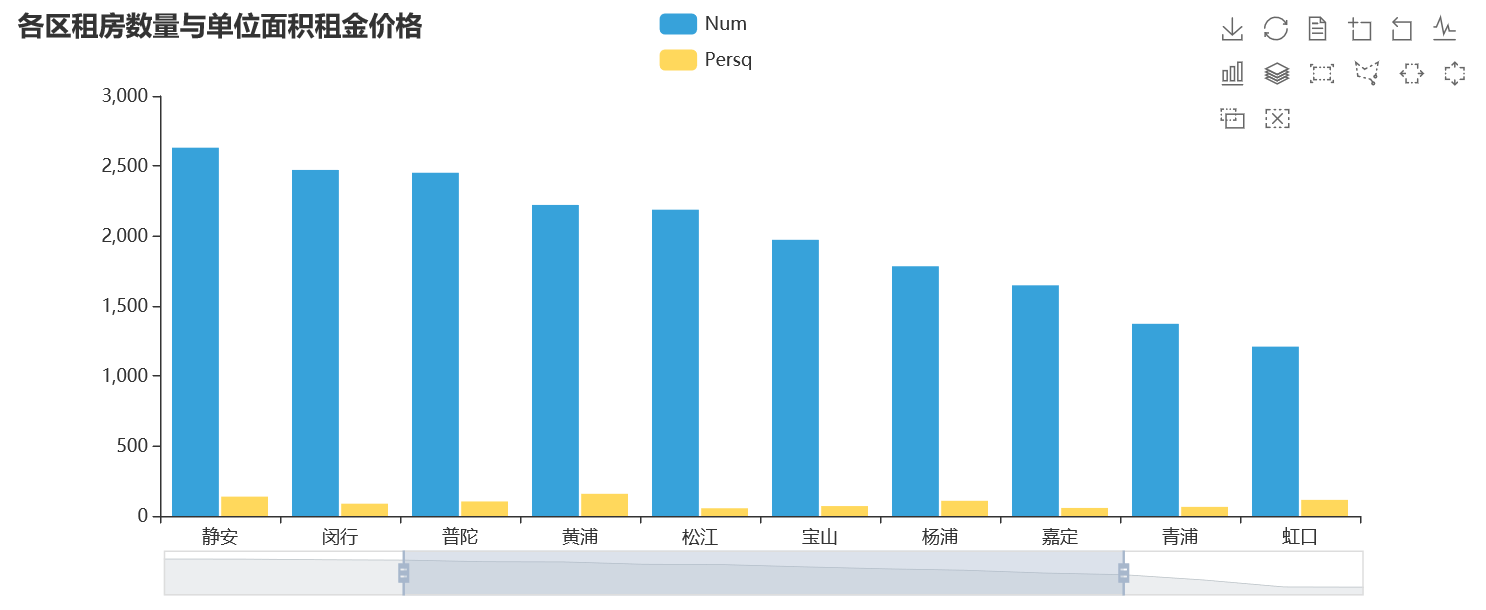
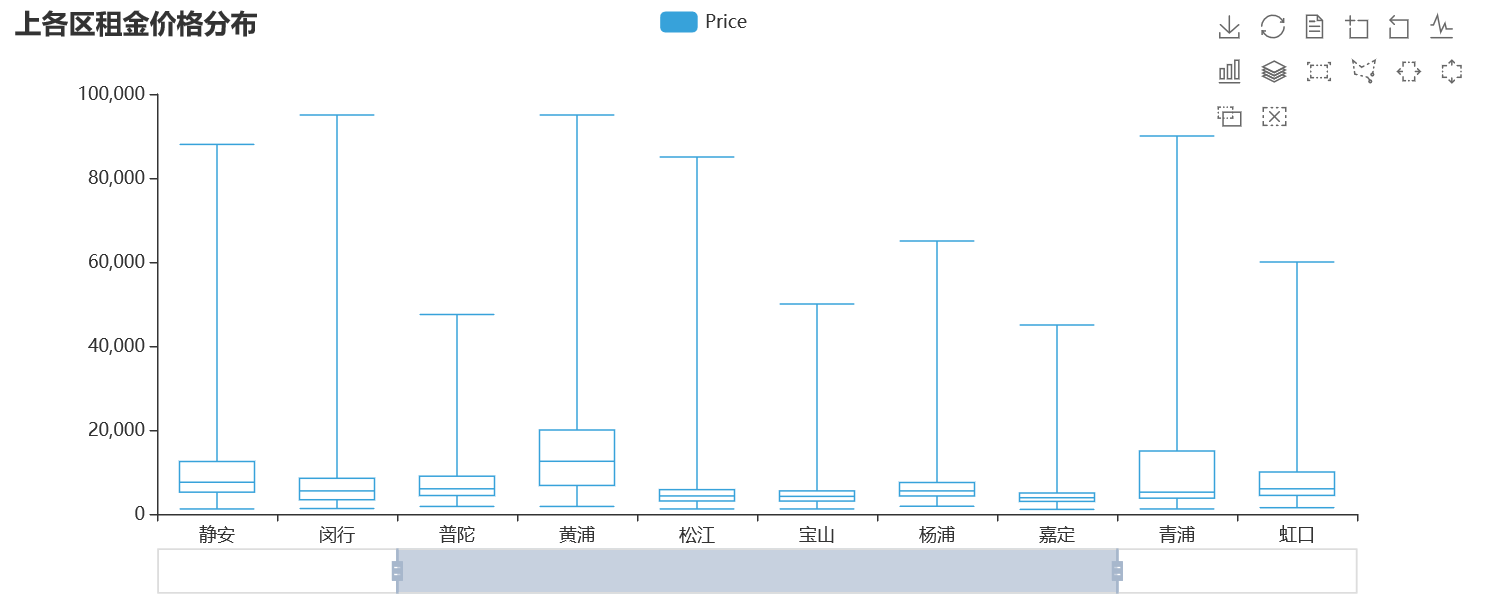
租房数量与单位面积租金价格按区域分布与按距离分布的规律比较类似,市中心区域租房数量较多,单位面积租金价格也相对较高,单位面积租金价格最高的是黄浦区为158元/平方,最低的为崇明区,为25元/平方。
region_group_price = df_geo.groupby('District')['Price']
box_data = []
for i in x_region:
    d = list(region_group_price.get_group(i))
    box_data.append(d)
# pyecharts 各区租金价格分布图
boxplot_group = Boxplot(opts.InitOpts(width="1000px",height="400px",theme=ThemeType.LIGHT))

boxplot_group.add_xaxis(x_region)
boxplot_group.add_yaxis("Price", boxplot_group.prepare_data(box_data))
boxplot_group.set_global_opts(title_opts=opts.TitleOpts(title="上各区租金价格分布"),
                        legend_opts=opts.LegendOpts(type_="scroll", pos_right="middle", orient="vertical"),
                        datazoom_opts=[opts.DataZoomOpts(),opts.DataZoomOpts(type_="slider")],
                        toolbox_opts=opts.ToolboxOpts(),
                        tooltip_opts=opts.TooltipOpts(is_show=True,axis_pointer_type= "line",trigger="item",formatter='{c}'))

boxplot_group.render_notebook()
# seaborn 各区租金价格分布图
f, ax = plt.subplots(figsize=(16,8))

sns.boxplot(x='District', y='Price', data=df_geo, palette="Set3", linewidth=2.5, order=x_region)
ax.set_title('各区租金价格分布',fontsize=15)
ax.set_xlabel('区域')
ax.set_ylabel('房屋租金')

plt.show()
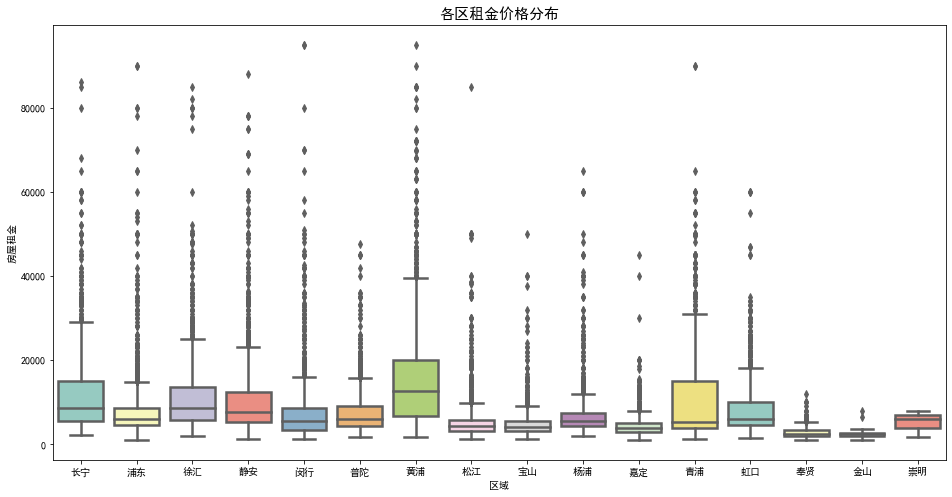
由各区租金价格分布图可知,出租房屋租金价格平均值最高的仍为黄浦区,各区都存在偏高的异常点,推测应为别墅等房间较多的房屋类型。松江、嘉定和宝山距市中心距离适中,而且价格比其他各区低,适合预算较低的上班族租住。
- 出租房屋朝向及户型分布
f, ax1 = plt.subplots(figsize=(16,25))

sns.countplot(y='Layout', data=df_geo, ax=ax1,order = df_geo['Layout'].value_counts().index)
ax1.set_title('房屋户型分布',fontsize=15)
ax1.set_xlabel('数量')
ax1.set_ylabel('户型')

f, ax2 = plt.subplots(figsize=(16,6))
sns.countplot(x='Direction', data=df_geo, ax=ax2,order = df_geo['Direction'].value_counts().index)
ax2.set_title('房屋朝向分布',fontsize=15)
ax2.set_xlabel('朝向')
ax2.set_ylabel('数量')


plt.show()
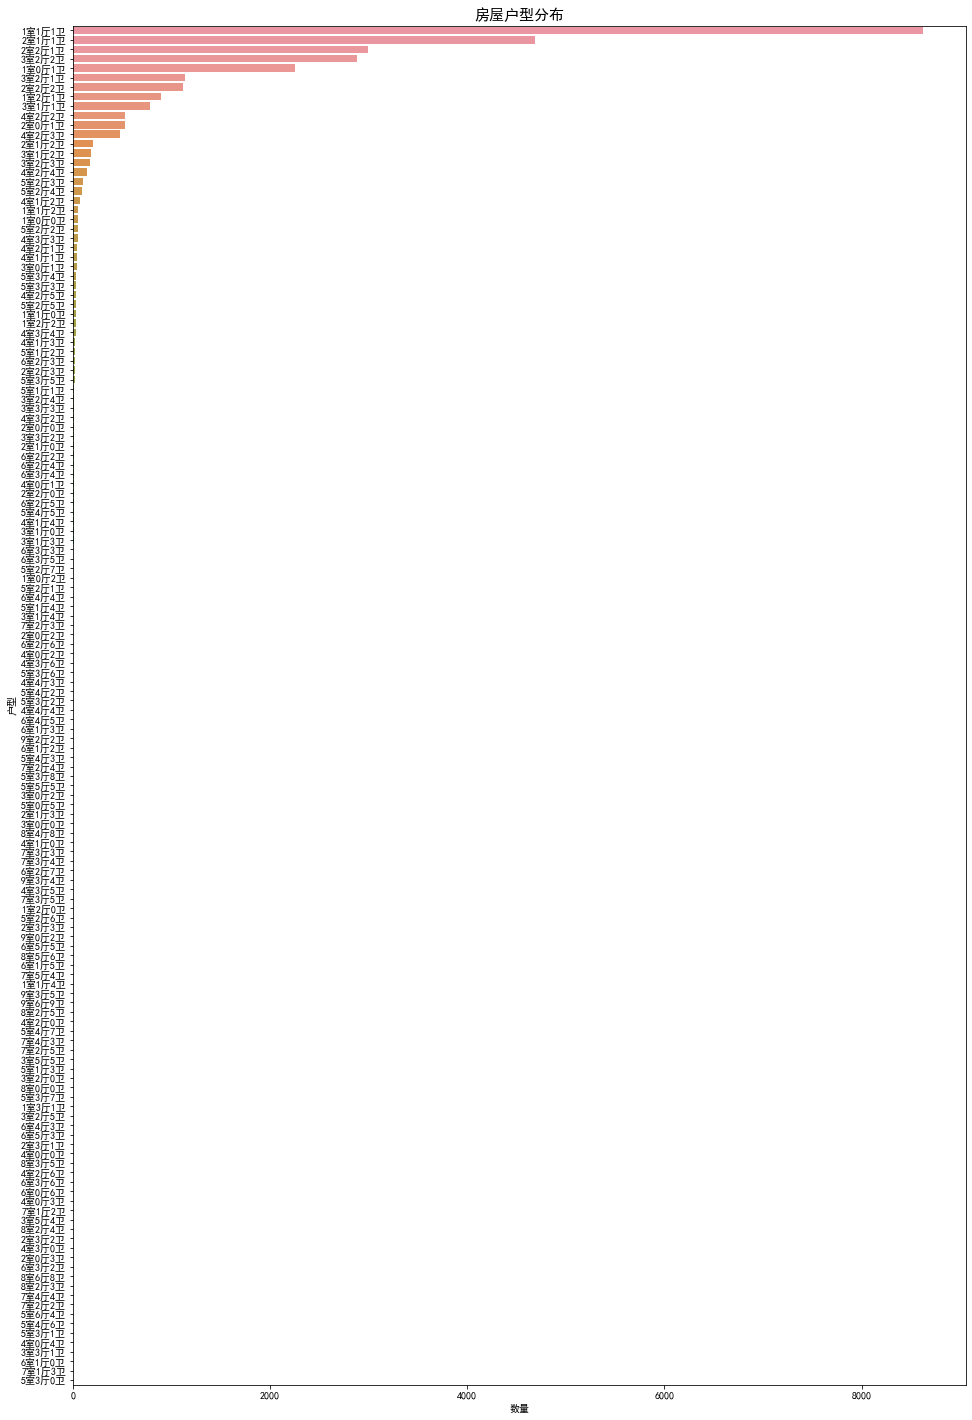
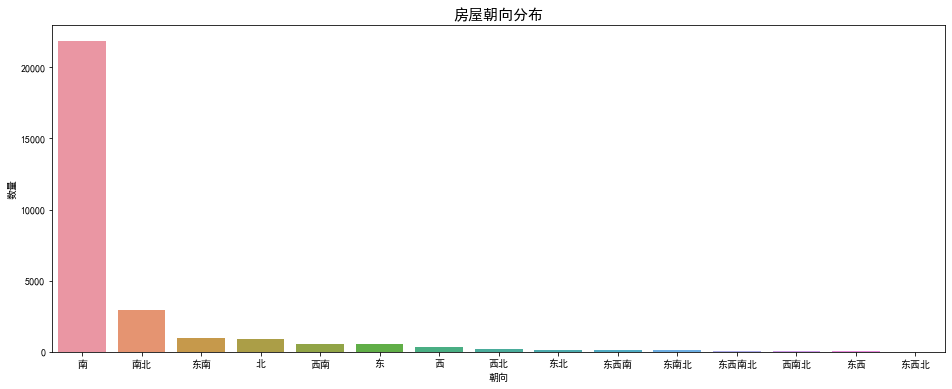
房屋的户型当中占比较多的是小户型,多房间的户型占比较少,其中一室一厅一卫的户型最多,也符合现在很多人想有自己私密空间的趋势,其次是两室一厅。房屋朝向以朝南居多,符合建筑设计常识,其中余下南北等复合朝向应为不同房间朝向的叠加,仍以朝向中含南的房屋数量最多。
- 出租房屋租金价格与电梯、地铁、装修、公寓字段之间关系
sns.catplot(x='Elevator',y='Price',hue='Metro',row='Apartment',
            col='Decoration',data=df_geo,kind="box",palette="husl")
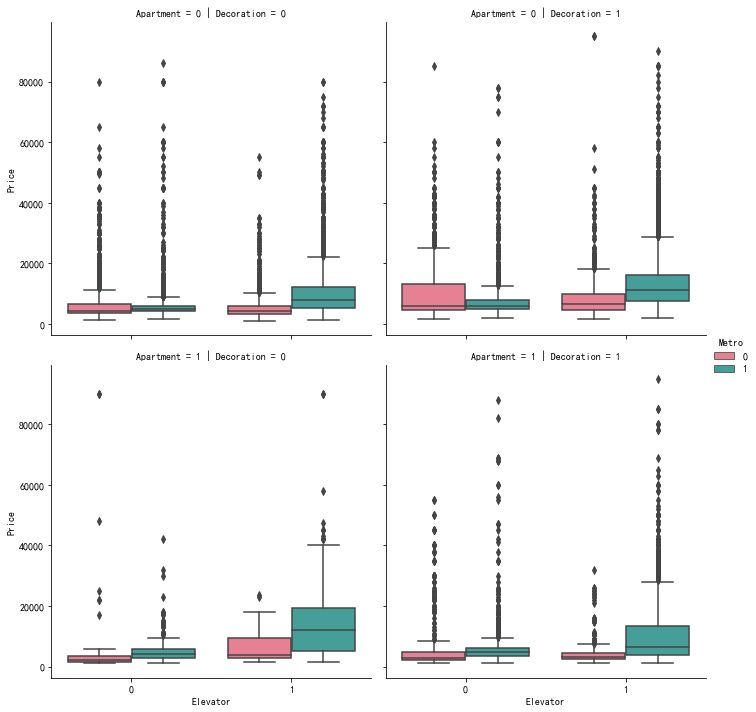
有电梯的房屋租金价格普遍比没电梯的房屋租金价格高,同样有地铁这个因素也使房屋租金变高。大部分情况下精装房屋租金价格较高,是否是公寓对发房屋租金价格影响没有规律。
- 出租房屋租金价格与房屋层高之间关系
f, ax1 = plt.subplots(figsize=(16, 4))
sns.countplot(df_geo['Relative height'], ax=ax1, palette="husl")
ax1.set_title('不同层高出租房屋数量分布')
f, ax2 = plt.subplots(figsize=(16, 8))
sns.boxplot(x='Relative height', y='Price', data=df_geo, ax=ax2, palette="husl")
ax2.set_title('不同层高出租房屋租金价格分布')
plt.show()

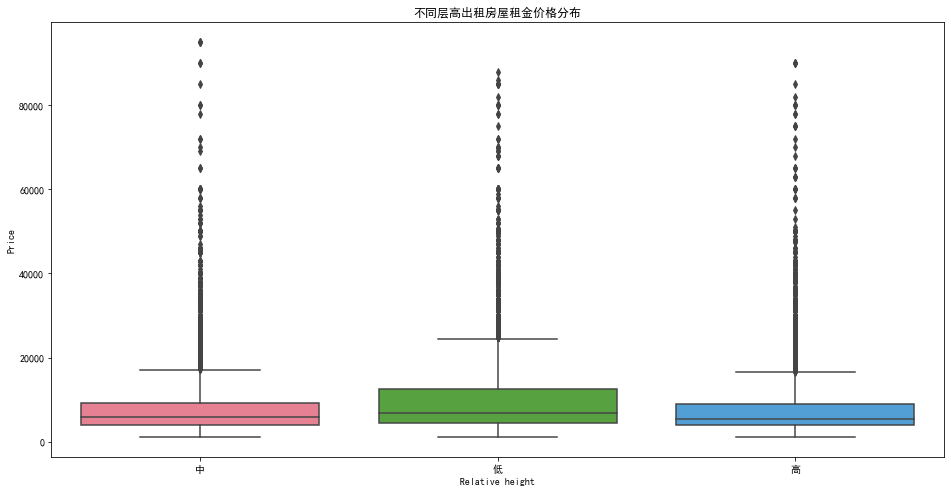
中等高度楼层出租房数量最多,低楼层出租房数量最少。平均租金价格低楼层反而最高,高楼层最低,推测因为低楼层生活便利程度较高的缘故。
- 各区出租房屋租金价格分布热力图
# 导入相关模块
from pyecharts.charts import Geo
from pyecharts.globals import ChartType
from pyecharts.globals import GeoType
# 构造数据集
region = df_geo['District'] + df_geo['Street'] + df_geo['Community']
region = region.reset_index(drop=True)
data_pair = [(region[i], df_geo.iloc[i]['Price']) for i in range(len(region))]
pieces=[
      {'max': 1000,'label': '1000以下','color':'#50A3BA'},  #有上限无下限,label和color自定义
      {'min': 1000, 'max': 1800,'label': '1000-1800','color':'#81AE9F'},
      {'min': 1800, 'max': 2300,'label': '1800-2300','color':'#E2C568'},
      {'min': 2300, 'max': 2800,'label': '2300-2800','color':'#FCF84D'},
      {'min': 2800, 'max': 5000,'label': '2800-5000','color':'#E49A61'},
      {'min': 5000, 'max': 8000,'label': '5000-8000','color':'#DD675E'},
      {'min': 8000, 'label': '8000以上','color':'#D94E5D'}#有下限无上限
]
# 各区出租房屋租金价格分布热力图
geo = Geo(opts.InitOpts(width="600px",height="600px",theme=ThemeType.LIGHT))
geo.add_schema(maptype = "上海",emphasis_label_opts=opts.LabelOpts(is_show=True,font_size=16))
for i in range(len(region)):
    geo.add_coordinate(region[i],df_geo.iloc[i]['lng'],df_geo.iloc[i]['lat'])
geo.add("",data_pair,type_=GeoType.HEATMAP)
geo.set_global_opts(
                    title_opts=opts.TitleOpts(title="上海房租分布"),
                    visualmap_opts=opts.VisualMapOpts(min_ = 0,max_ = 30000,split_number = 20,range_text=["High", "Low"],is_calculable=True,range_color=["lightskyblue", "yellow", "orangered"]),
                    toolbox_opts=opts.ToolboxOpts(),
                    tooltip_opts=opts.TooltipOpts(is_show=True)
                  )
geo.set_series_opts(label_opts=opts.LabelOpts(is_show=False))
geo.render_notebook()
#geo.render("HEATMAP.html")
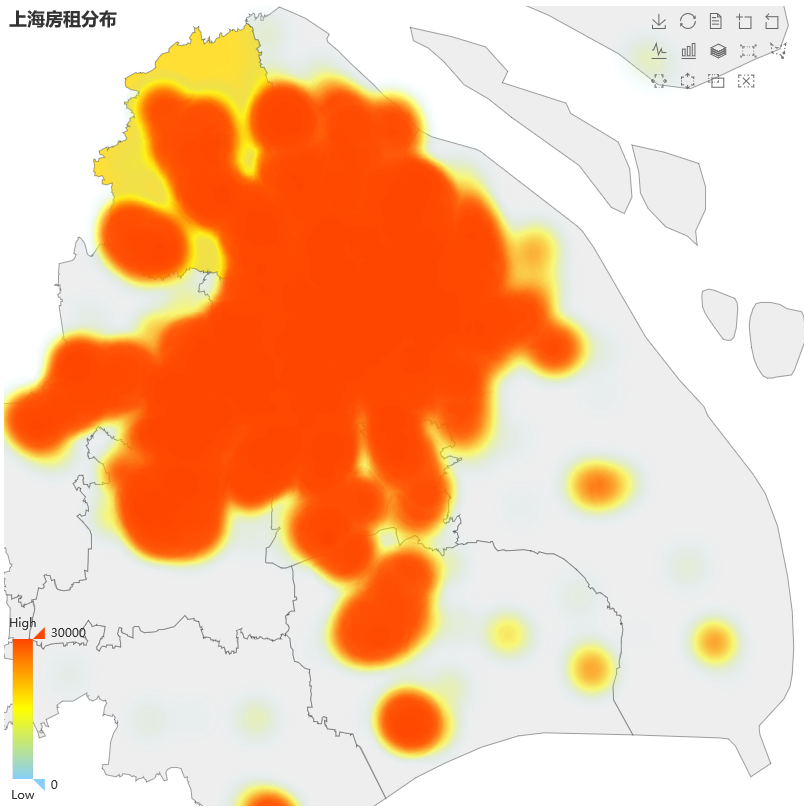
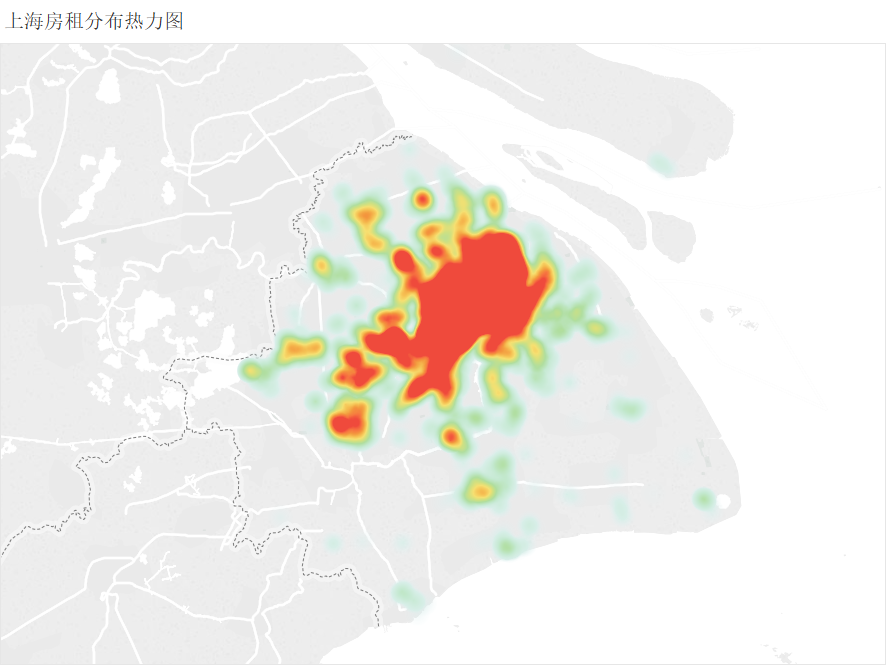
房屋租金价格热力图反映了一个区域租金高低以及房屋数量密集程度,pyecharts做出的热力图显示效果不是太好,因此又用pyecharts做了价格分布散点图作为补充,两张图表达的意思一致,后续又导出至tableau做了一版,显示效果较pyecharts好一些。
# 各区出租房屋租金价格分布散点图
geo = Geo(opts.InitOpts(width="600px",height="600px",theme=ThemeType.LIGHT))
geo.add_schema(maptype = "上海")
for i in range(len(region)):
    geo.add_coordinate(region[i],df_geo.iloc[i]['lng'],df_geo.iloc[i]['lat'])
geo.add("",data_pair,type_=GeoType.EFFECT_SCATTER,symbol_size=5)
geo.set_global_opts(
                    title_opts=opts.TitleOpts(title="上海房租分布"),
                    visualmap_opts=opts.VisualMapOpts(is_piecewise=True, pieces=pieces),
                    toolbox_opts=opts.ToolboxOpts()
                  )
geo.set_series_opts(label_opts=opts.LabelOpts(is_show=False))
geo.render_notebook()
#geo.render("SCATTER.html")
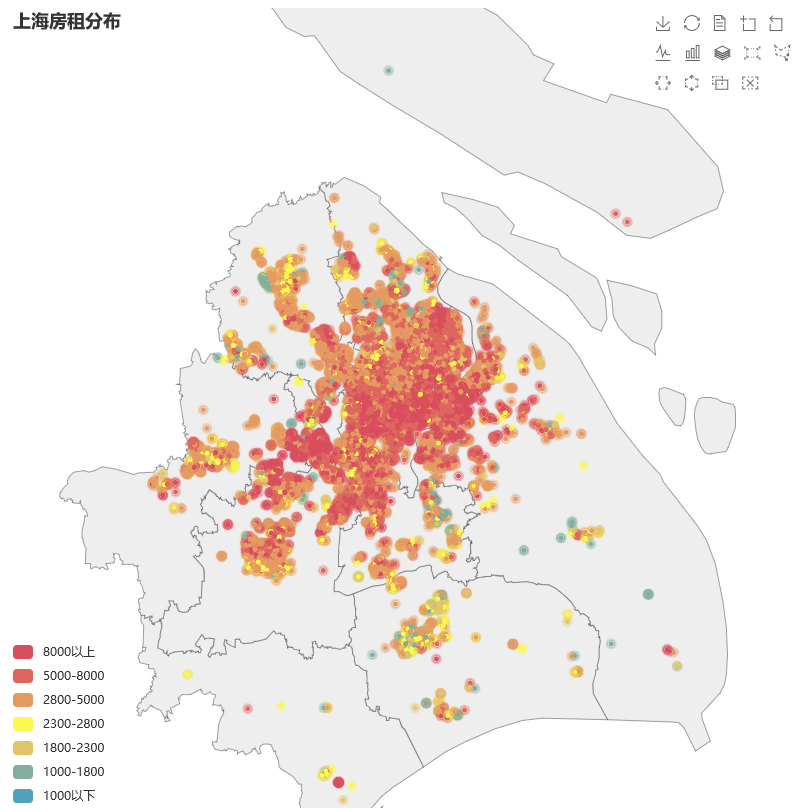
七、数据建模
- 特征工程
# 读取数据
data=pd.read_csv("df_geo_df.csv",index_col=0)
# 去掉与建模无关特征
data = data.drop(['Street', 'Community', 'Renting modes', 'Total floors', 'lng', 'lat', 'cats', 'Persq'], axis=1)
# Distance字段为连续变量,将其离散分箱后去除。
bins = [0, 5, 10, 20, 70]
cats = pd.cut(data.distance,bins)
data['cats'] = cats
data = data.drop(['distance'], axis=1)
如果每个不同的 Year 值都作为特征值,我们并不能找出 Year 对 Price 有什么影响,因为年限划分的太细了。因此,我们只有将连续数值型特征 Year 离散化,做分箱处理。 特征离散化后,模型会更稳定,降低了模型过拟合的风险。
# 房屋布局这个特征不能直接作为模型输入,从中提取出房间数、厅数、卫生间数
data['room_num'] =  data['Layout'].str.extract('(^\d).*', expand=False).astype('int64')
data['hall_num'] =   data['Layout'].str.extract('^\d.*?(\d).*', expand=False).astype('int64')
data['bathroom_num'] =  data['Layout'].str.extract('^\d.*?\d.*?(\d).*', expand=False).astype('int64')
#本篇数据比较规整,可以直接.str[0] .str[2] .str[4]
# 创建新特征
# 主要思路是考虑每个租客均摊的居住面积、厅和卫生间被共享的程度,
# 处理生成一个表示居住舒适度的新字段‘convenience’,数值越大表示居住舒适度越高
data['area_per_capita'] = data['Area'] / data['room_num']
data['area_per_capita_norm'] = data[['area_per_capita']].apply(lambda x: (x - np.min(x)) / (np.max(x) - np.min(x)))
data['convenience'] = data['area_per_capita_norm'] + (data['hall_num'] / data['room_num']) + (data['bathroom_num'] / data['room_num'])
# 去掉建模无关特征
data = data.drop(['Layout', 'area_per_capita', 'area_per_capita_norm'], axis=1)
# 重置索引
data = data.reset_index(drop = True)
# 将区域、相对高度和朝向特征数据由中文改为简写
district_nums = {"嘉定":"JD","奉贤":"FX","宝山":"BS","崇明":"CM",
                 "徐汇":"XH","普陀":"PT","杨浦":"YP","松江":"SJ",
                 "浦东":"PD","虹口":"HK","金山":"JS","长宁":"CN",
                 "闵行":"MH","青浦":"QP","静安":"JA","黄浦":"HP"}
relative_height_nums = {"高":"H","中":"M","低":"L"}
direction_nums = {"东":"E","东北":"EN","东南":"ES","东南北":"ESN",
                  "东西":"EW","东西北":"EWN","东西南":"EWS",
                  "东西南北":"EWSN","北":"N","南":"S","南北":"SN",
                  "西":"W","西北":"WN","西南":"WS","西南北":"WSN"}
data['District'].replace(district_nums,inplace=True)
data['Relative height'].replace(relative_height_nums,inplace=True)
data['Direction'].replace(direction_nums,inplace=True)
# 重命名字段名
data_columns = {"Relative height":"rh","cats":"distance_cat"}
data.rename(columns = data_columns,inplace = True)
data.columns = data.columns.str.lower()
# 最后查看各字段数据类型是否合理
data.info()
# OUTPUT
<class 'pandas.core.frame.DataFrame'>
RangeIndex: 28799 entries, 0 to 28798
Data columns (total 14 columns):
district        28799 non-null object
elevator        28799 non-null int64
rh              28799 non-null object
area            28799 non-null float64
direction       28799 non-null object
metro           28799 non-null int64
decoration      28799 non-null int64
apartment       28799 non-null int64
price           28799 non-null float64
distance_cat    28733 non-null category
room_num        28799 non-null int64
hall_num        28799 non-null int64
bathroom_num    28799 non-null int64
convenience     28799 non-null float64
dtypes: category(1), float64(3), int64(7), object(3)
memory usage: 2.9+ MB
# 对数据集列重新排序,方便查看
data_order = ['price','area','convenience','district','elevator','rh',
              'direction','metro','decoration','apartment','distance_cat',
              'room_num','hall_num','bathroom_num' ]
data = data[data_order]
# 取出数值类型的特征做可视化
numeric_dtypes = ['int16', 'int32', 'int64', 'float16', 'float32', 'float64']
numeric = []
for i in data.columns:
    if data[i].dtype in numeric_dtypes:
        if i in ['elevator','metro','decoration','apartment']:
            pass
        else:
            numeric.append(i)
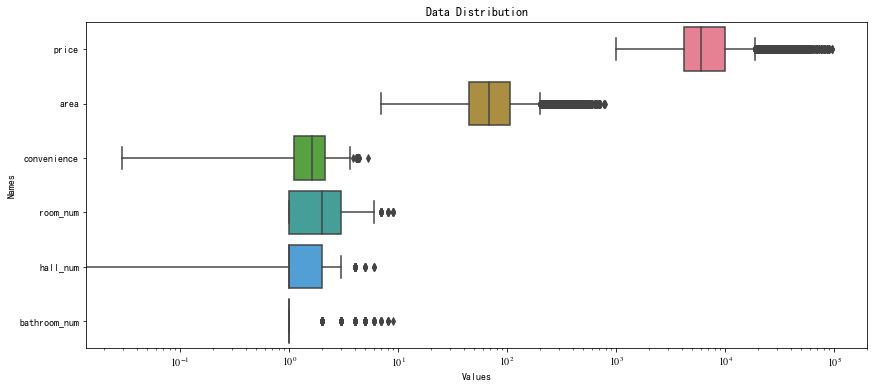
# 数值类型数据可视化
f, ax = plt.subplots(figsize=(14, 6))
ax.set_xscale("log")
ax = sns.boxplot(data=data[numeric], orient="h", palette="husl")
ax.xaxis.grid(False)
ax.set(ylabel="Names")
ax.set(xlabel="Values")
ax.set(title="Data Distribution")
for tick in ax.xaxis.get_major_ticks():
        tick.label1.set_fontproperties('stixgeneral')
# 纠偏处理
from scipy.stats import skew, norm
from scipy.special import boxcox1p
from scipy.stats import boxcox_normmax
# 找出偏态数据
skew_col = data[numeric].apply(lambda x: skew(x))
high_skew = skew_col[skew_col > 0.5]
high_skew_index = high_skew.index
high_skew_index = high_skew_index.drop('price')
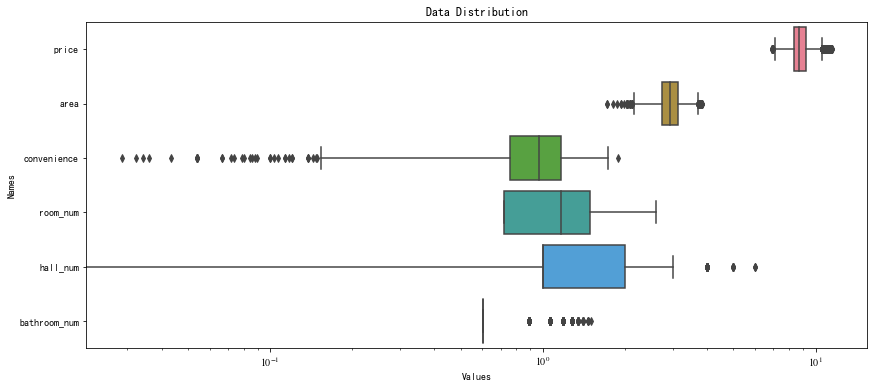
# 纠偏处理
data['price'] = np.log1p(data['price'])
for i in high_skew_index:
    data[i] = boxcox1p(data[i], boxcox_normmax(data[i] + 1))
# 纠偏后各数值数据分布图
f, ax = plt.subplots(figsize=(14, 6))
ax.set_xscale("log")
ax = sns.boxplot(data=data[numeric], orient="h", palette="husl")
ax.xaxis.grid(False)
ax.set(ylabel="Names")
ax.set(xlabel="Values")
ax.set(title="Data Distribution")
for tick in ax.xaxis.get_major_ticks():
        tick.label1.set_fontproperties('stixgeneral')
# 取出面积和价格查看数据分布
cols = ['area','price']
fig, axs = plt.subplots(ncols=1, nrows=0, figsize=(14, 14))
plt.subplots_adjust(right=1)
plt.subplots_adjust(top=1)
sns.color_palette("husl")

for i, col in enumerate(cols, 1):
    plt.subplot(len(cols), 2, i)
    sns.distplot(data[col], bins=30)
    plt.xlabel('{}'.format(col), size=15,labelpad=12.5)
    for j in range(2):
        plt.tick_params(axis='x', labelsize=12)
        plt.tick_params(axis='y', labelsize=12)

plt.show()
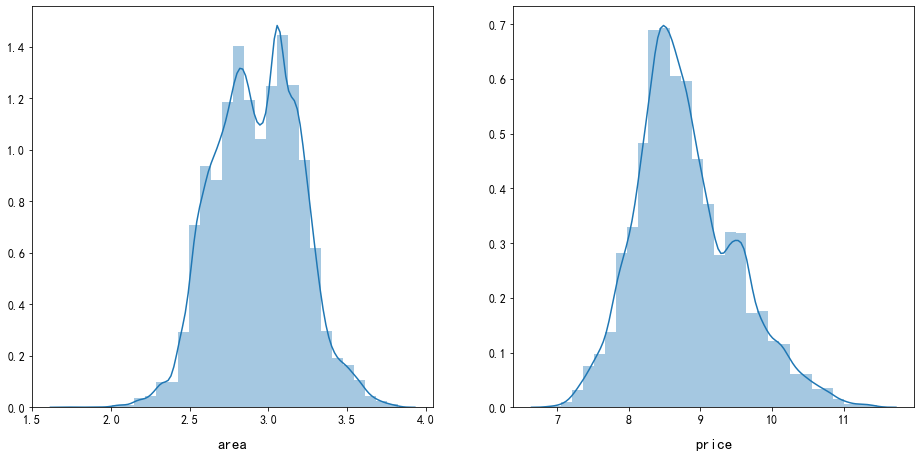
面积和价格特征经过处理后基本呈正态分布。
# 对于区域和朝向等不能作为模型输入的特征,需要将这些非数值量化,处理方法为使用独热编码,处理为01格式。
for cols in data.columns:
    if (data[cols].dtype == np.object) or (cols == 'distance_cat'):
        data = pd.concat((data, pd.get_dummies(data[cols], prefix=cols, dtype=np.int64)), axis=1)
        del data[cols]
data.info()
# OUTPUT
<class 'pandas.core.frame.DataFrame'>
RangeIndex: 28799 entries, 0 to 28798
Data columns (total 48 columns):
price                    28799 non-null float64
area                     28799 non-null float64
convenience              28799 non-null float64
elevator                 28799 non-null int64
metro                    28799 non-null int64
decoration               28799 non-null int64
apartment                28799 non-null int64
room_num                 28799 non-null float64
hall_num                 28799 non-null int64
bathroom_num             28799 non-null float64
district_BS              28799 non-null int64
district_CM              28799 non-null int64
district_CN              28799 non-null int64
district_FX              28799 non-null int64
district_HK              28799 non-null int64
district_HP              28799 non-null int64
district_JA              28799 non-null int64
district_JD              28799 non-null int64
district_JS              28799 non-null int64
district_MH              28799 non-null int64
district_PD              28799 non-null int64
district_PT              28799 non-null int64
district_QP              28799 non-null int64
district_SJ              28799 non-null int64
district_XH              28799 non-null int64
district_YP              28799 non-null int64
rh_H                     28799 non-null int64
rh_L                     28799 non-null int64
rh_M                     28799 non-null int64
direction_E              28799 non-null int64
direction_EN             28799 non-null int64
direction_ES             28799 non-null int64
direction_ESN            28799 non-null int64
direction_EW             28799 non-null int64
direction_EWN            28799 non-null int64
direction_EWS            28799 non-null int64
direction_EWSN           28799 non-null int64
direction_N              28799 non-null int64
direction_S              28799 non-null int64
direction_SN             28799 non-null int64
direction_W              28799 non-null int64
direction_WN             28799 non-null int64
direction_WS             28799 non-null int64
direction_WSN            28799 non-null int64
distance_cat_(0, 5]      28799 non-null int64
distance_cat_(5, 10]     28799 non-null int64
distance_cat_(10, 20]    28799 non-null int64
distance_cat_(20, 70]    28799 non-null int64
dtypes: float64(5), int64(43)
memory usage: 10.5 MB
data.shape
# OUTPUT
(28799, 48)
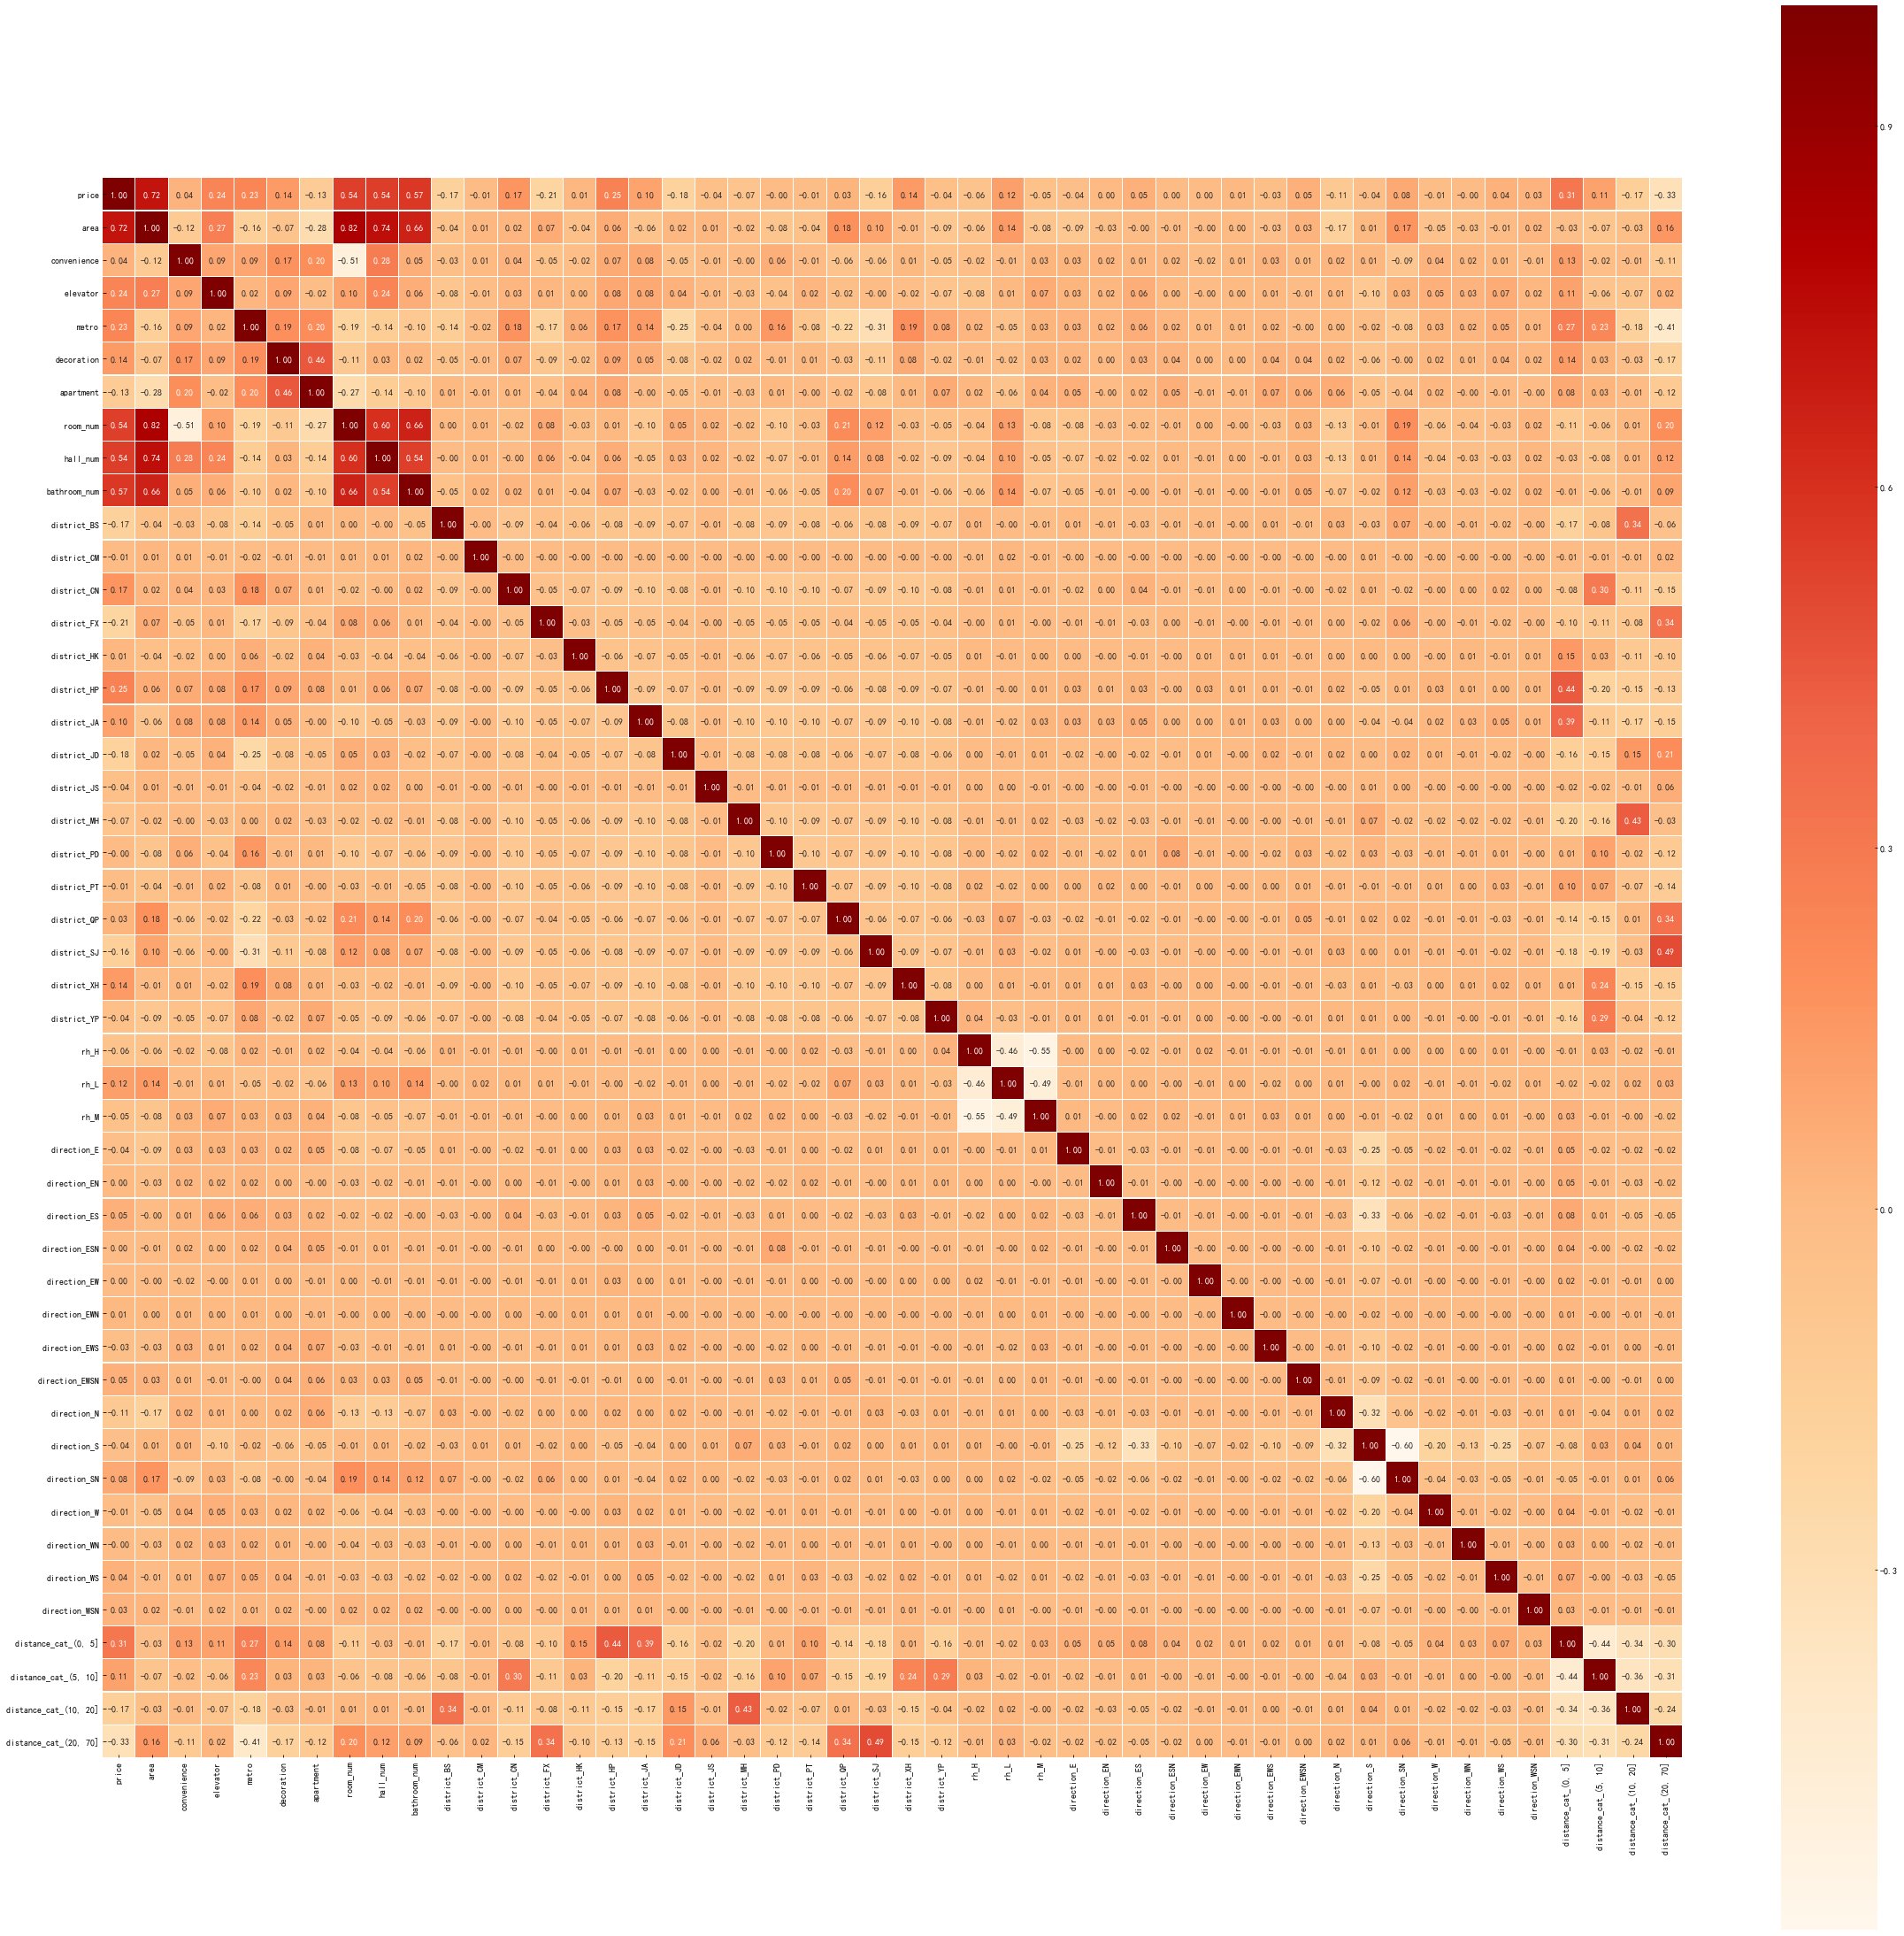
# 对特征相关性进行可视化
colormap = plt.cm.OrRd
plt.figure(figsize=(40,40))
sns.heatmap(data.corr(),cbar=True,linewidths=0.1,vmax=1.0, square=True,
            fmt='.2f',cmap=colormap, linecolor='white', annot=True)
# 数据导出备份
data.to_csv("all_data.csv", sep=',')
all_data=pd.read_csv("all_data.csv",index_col=0)
- 模型训练
# 导入相关包
# 本项目采用带剪枝的决策树来对模型进行训练
from sklearn.model_selection import KFold
from sklearn.ensemble import RandomForestRegressor
from sklearn.metrics import make_scorer, mean_squared_error
from sklearn.model_selection import GridSearchCV
from sklearn.pipeline import make_pipeline


from sklearn.model_selection import learning_curve, validation_curve
from sklearn.model_selection import cross_val_score
from sklearn.metrics import r2_score
from sklearn.model_selection import ShuffleSplit
plt.style.use('bmh')

import warnings
warnings.filterwarnings(action="ignore")
# 创建特征集
X = all_data.drop('price', axis=1)
X.shape
# OUTPUT
(28799, 47)
# 创建标签集
y = all_data['price']
y.shape
# OUTPUT
(28799,)
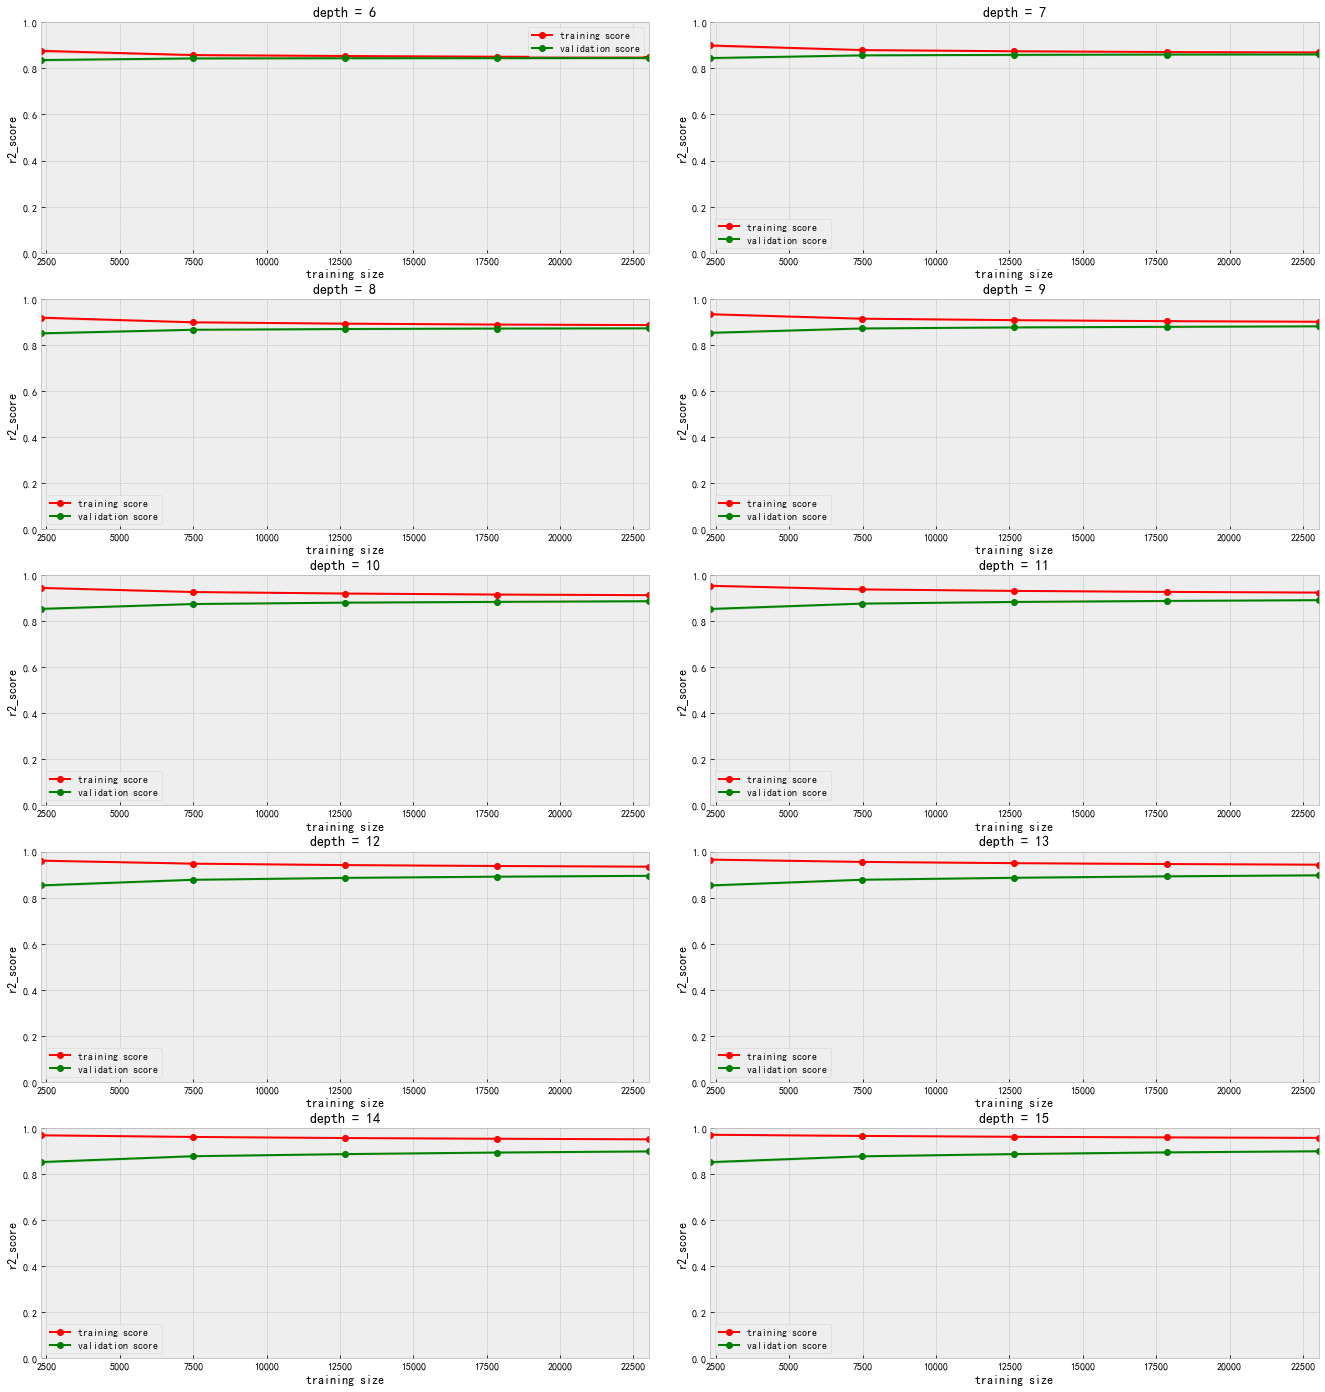
# 学习曲线 在不同的模型参数下,显示随着训练数据量的增加,模型训练集得分和验证集得分的变化,
# 本次重点关注决策树模型在不同最大深度下的表现。
# r2_score:目标变量的预测值和实际值之间的相关程度平方的百分比,数值表示该模型中目标变量中有百分之多少能够用特征来解释
# 复杂度曲线 在全部数据集训练的情况下,随着模型参数变化,模型训练集得分和验证集得分的变化,
# 本次本次重点关注决策树模型在不同最大深度下的表现。
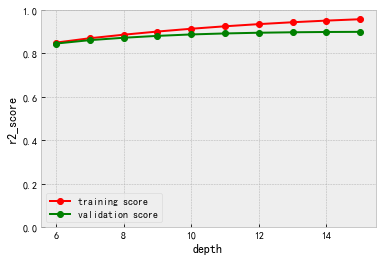
由学习曲线可知,随着训练数据量增加,训练集得分减少,验证集得分增加,当数据量达到一定规模时,训练集得分与验证集得分趋于平稳,之后数据量再增加也无法提升模型的表现。当模型最大深度为11时,模型预测的偏差和方差达到了均衡。 从复杂度曲线可知,当最大深度大于11以后,模型验证集得分平稳后下降,方差越来越大,已出现过拟合趋势。 结合两个曲线结果,认为模型最大深度为11预测效果最好。
# 划分训练集和测试集
from sklearn.model_selection import train_test_split
X_train, X_test, y_train, y_test = train_test_split(X, y, test_size=0.2, random_state=42)
# 利用网格搜索来寻找使模型性能最好的参数组合
# 通过交叉验证得到每个参数组合的得分,以确定最优的参数组合

# 寻优参数取值范围
param_grid = {
    'max_depth': list(range(6, 16)),
    'min_samples_split': [70, 80, 90],
    'max_features': [8, 10, 12],
    'min_samples_leaf':[14, 16, 18]
    }
# 交叉验证
cv = ShuffleSplit(n_splits = 10, test_size = 0.2, random_state = 0)
# 定义训练模型
rf = RandomForestRegressor(random_state=42)
# 网格搜索
grid_search = GridSearchCV(estimator = rf, param_grid = param_grid,
                           scoring='r2', cv = cv, n_jobs = 4, verbose = 1)
grid_search.fit(X_train, y_train)
# 最优参数
grid_search.best_params_
# OUTPUT
{'max_depth': 14,
 'max_features': 12,
 'min_samples_leaf': 14,
 'min_samples_split': 70}
# 评分函数
def evaluate(model, test_features, test_labels):
    predictions = model.predict(test_features)
    score = r2_score(test_labels, predictions)
    print('R2_score = {:0.4f}'.format(score))
# 用最优参数对数据集进行训练并评分
best_grid = grid_search.best_estimator_
evaluate(best_grid, X_test, y_test)
# OUTPUT
R2_score = 0.8828
改进:尝试使用多种回归模型进行预测,比较计算效率及准确度,尝试模型融合。在数据集中增加新的字段如:周边生活便利程度,装修状况更细分一些(精装简装毛坯),加入房屋建成年份,水电是否民用,配套设施是否齐全等。