Eacharts使用方法
vue中使用 echarts
1. 下载echarts
- 使用npm下载
npm install echarts --save
首先需要全局引入 在main.js中
// 引入echarts import echarts from 'echarts' Vue.prototype.$echarts = echarts
在Echarts.vue中
<div id="myChart" :style="{width: '300px', height: '300px'}"></div>
export default {
name: 'hello',
data () {
return {
msg: 'Welcome to Your Vue.js App'
}
},
mounted(){
this.drawLine();
},
methods: {
drawLine(){
// 基于准备好的dom,初始化echarts实例
let myChart = this.$echarts.init(document.getElementById('myChart'))
// 绘制图表
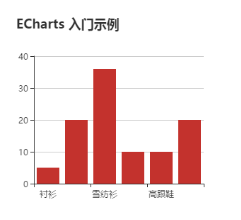
myChart.setOption({
title: { text: '在Vue中使用echarts' },
tooltip: {},
xAxis: {
data: ["衬衫","羊毛衫","雪纺衫","裤子","高跟鞋","袜子"]
},
yAxis: {},
series: [{
name: '销量',
type: 'bar',
data: [5, 20, 36, 10, 10, 20]
}]
});
}
}
}
-
或者引用线上地址
-
设置一个容器(必须有宽度和高度)
<div id="box" style="width:600px;height:600px;"></div> -
获取盒子元素操作
let box = echarts.init(document.getElementById("box")) -
在Echarts官网上进行引入所需的数据
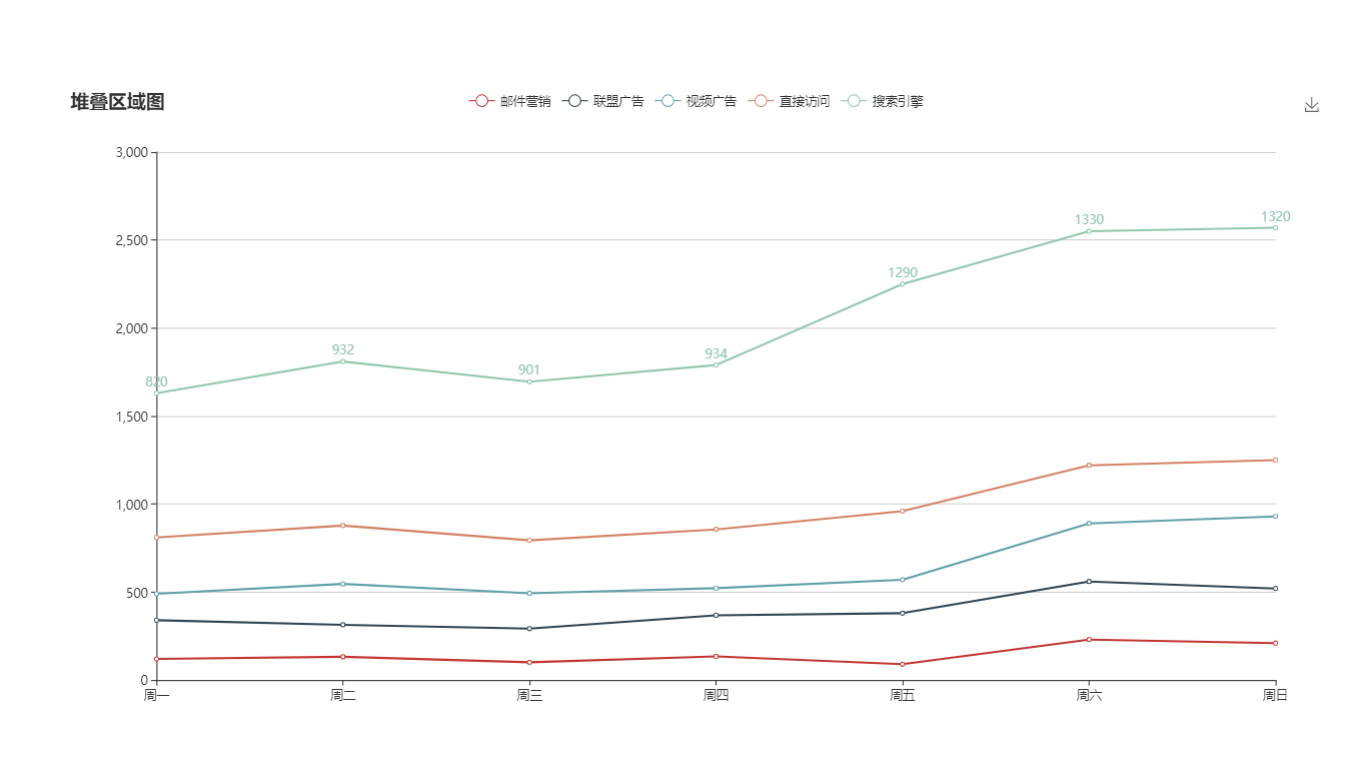
option = { title: { text: '堆叠区域图' }, tooltip: { trigger: 'axis', axisPointer: { type: 'cross', label: { backgroundColor: '#6a7985' } } }, legend: { data: ['邮件营销', '联盟广告', '视频广告', '直接访问', '搜索引擎'] }, toolbox: { feature: { saveAsImage: {} } }, grid: { left: '4%', right: '4%', bottom: '3%', containLabel: true }, xAxis: [ { type: 'category', boundaryGap: false, data: ['周一', '周二', '周三', '周四', '周五', '周六', '周日'] } ], yAxis: [ { type: 'value' } ], series: [ { name: '邮件营销', type: 'line', stack: '总量', areaStyle: {}, data: [120, 132, 101, 134, 90, 230, 210] }, { name: '联盟广告', type: 'line', stack: '总量', areaStyle: {}, data: [220, 182, 191, 234, 290, 330, 310] }, { name: '视频广告', type: 'line', stack: '总量', areaStyle: {}, data: [150, 232, 201, 154, 190, 330, 410] }, { name: '直接访问', type: 'line', stack: '总量', areaStyle: {}, data: [320, 332, 301, 334, 390, 330, 320] }, { name: '搜索引擎', type: 'line', stack: '总量', label: { normal: { show: true, position: 'top' } }, areaStyle: {}, data: [820, 932, 901, 934, 1290, 1330, 1320] } ] }; -
给元素绑定数据
ech.setOption(option)
- 图表效果