

画仪表盘的需要用到echarts的画饼图(type:pie)的功能和一些技巧:
(1)series设置data,data是一段均匀的数字
(2)series设置radius,设置表盘(环形)的宽度或者厚度
(3)serias设置label,formatter属性设置文字的内容(刻度),position设置文字位置。echarts的默认outside或inside都丑,可以使用另一组_data_数据,用于专门展示文字,而且默认文字是居中的,不好改,需要用一些技巧帮助展示到边缘。
(4)serias设置itemStyle的color属性设置表盘背景色,可以设置透明色或者渐变色哦
(5)可以通过对每项(表盘的每个子单元)设置样式,包括backgroundColor,borderColor,borderSize,shadowColor等
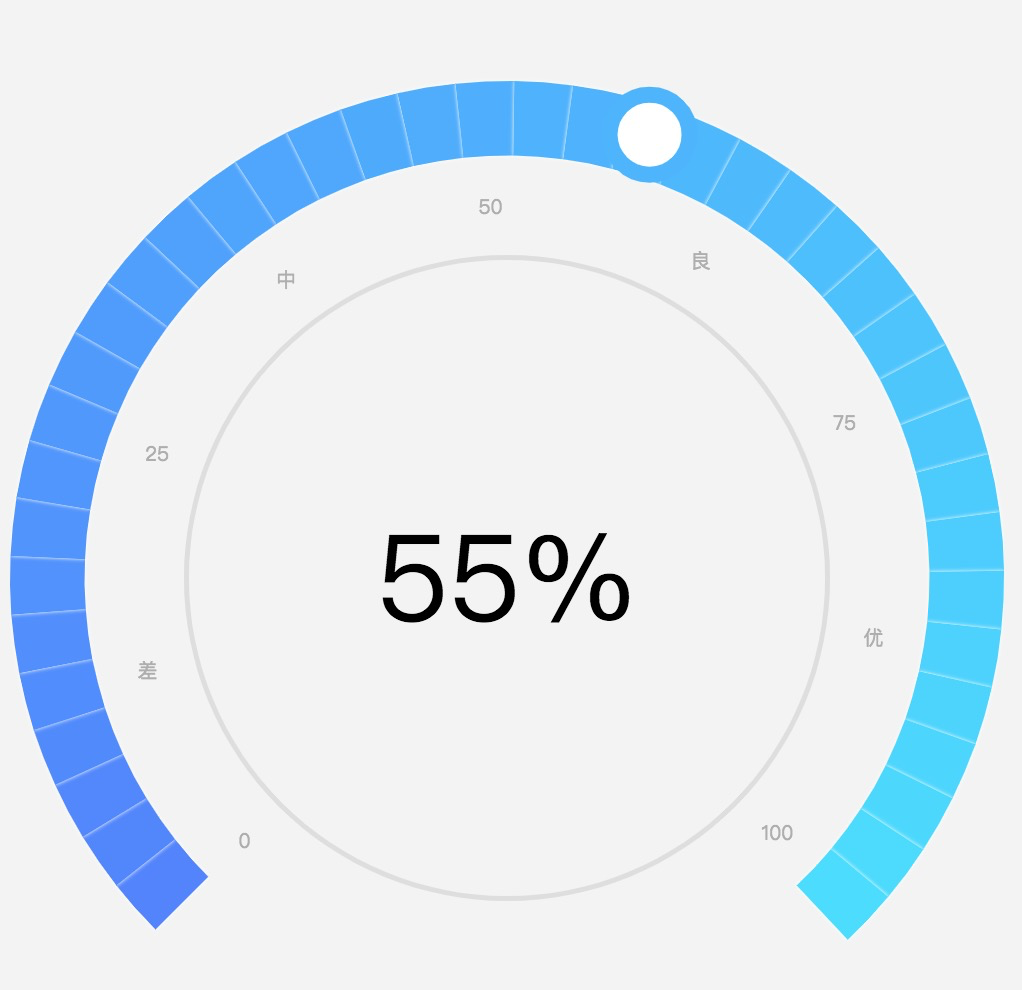
案例1
const TotalShowBlocks = 40 //默认展示的块数40,始终表示不变
const LevelTexts = ['0', '差', '25', '中', '50', '良', '75', '优', '100']//用于展示的刻度
const ShowPercent = .75 //用于展示的仪表盘角度的百分比,剩下的是透明的
const TotalBlocks = Math.floor(40/ ShowPercent)
const StartAngle = -180 + 90 - (360*(1-ShowPercent) / 2)
const KeduLength=5 //每5个显示一个刻度
const Value = 55//表示目标数值
const Kedu = 100/TotalShowBlocks

function rgbToHex(r, g, b) {
    var hex = ((r << 16) | (g << 8) | b).toString(16);
    return "#" + new Array(Math.abs(hex.length - 7)).join("0") + hex;
}

// hex to rgb
function hexToRgb(hex) {
    var rgb = [];
    for (var i = 1; i < 7; i += 2) {
        rgb.push(parseInt("0x" + hex.slice(i, i + 2)));
    }
    return rgb;
}

// 计算渐变过渡色 startColor:初始色号,endColor最终色号,step渐变步数
function gradient(startColor, endColor, step) {
    // 将 hex 转换为rgb
    var sColor = hexToRgb(startColor),
        eColor = hexToRgb(endColor);

    // 计算R\G\B每一步的差值
    var rStep = (eColor[0] - sColor[0]) / step;
    gStep = (eColor[1] - sColor[1]) / step;
    bStep = (eColor[2] - sColor[2]) / step;

    var gradientColorArr = [];
    for (var i = 0; i < step; i++) {
        // 计算每一步的hex值
        gradientColorArr.push(rgbToHex(parseInt(rStep * i + sColor[0]), parseInt(gStep * i + sColor[1]), parseInt(bStep * i + sColor[2])));
    }
    return gradientColorArr;
}

let grades = []
let grades_txt=[]
const objValue = Math.ceil(Value /Kedu )//55表示目标数值,2.5是仪表盘上每个单位代表的数值
const colorArr = gradient('#5081FF',"#3DFEFF",TotalBlocks)

for(let i=0;i<TotalBlocks;i++){//取40作为需要设置的块数
    let item = {
         name:i === objValue?'55.5%':'',
         value:1,
    }
    if(i===objValue){//目标位置,需要被选中的
        // item.selected = true  选中后默认有位移
        item.label={
            borderColor:colorArr[objValue],
            borderWidth:8,
            width:40,
            height:40,
            borderRadius:20,
            color:'transparent',
            backgroundColor:'#fff'
        }
    }
    grades.push(item)
    grades_txt.push({
        name:'',
        value:1
    })
}

option = {
    grid:{
      top:40,
    },
    series: [//用于画一个圆形的线,修饰用
        {
            name:'',
            type:'pie',
            radius:['64%','65%'],
            data:[//长度为1一位数组,画单色线
            {   value:1,
                name:'55%',label:{
                color:'#000',
                fontSize:60
            }}],
            itemStyle:{
                color:'#dedede',//线的颜色
            },
            label:{
                position:'center',//内容展示在圆形正中间
            }
        },
        {
          name:'',//刻度文字
          type:'pie',
          radius: ['65%', '82%'],
          data:grades_txt.concat([1/1000]), //越小越好,更接近起点
          startAngle:StartAngle,
          label:{
              position:'inside',
              formatter:(props={value})=>{
                    const {value,dataIndex}=props
                    // console.log(props,dataIndex)
                    const labels = ['0','差','25','中','50','良','75','优','100']
                    //5
                    console.log(dataIndex)
                    if((dataIndex+1) % KeduLength===0 && dataIndex<TotalShowBlocks){

                        return labels[(dataIndex+1)/KeduLength]
                    }

                    else if(dataIndex===TotalBlocks){
                        return '0'
                    }
                    return null
                },
                color:'#AEAEAE',
                fontSize:10
          },
          itemStyle:{
              color:'transparent',
          }

        },
        {
            name: '',
            type: 'pie',
            radius: ['85%', '100%'],
            startAngle:StartAngle,
            itemStyle:{
                shadowColor: 'rgba(255, 255, 255, 1)',
                shadowBlur: 2,
                borderWidth:1,
                color:(props)=>{
                  const  {seriesIndex, dataIndex, data, value}=props
                    if(dataIndex>=TotalShowBlocks){
                        return 'transparent'
                    }else {
                        return colorArr[dataIndex]
                    }
                },
            },
            selectedMode:'single',
            label: {
                position:'inner',
                backgroundColor: 'transparent',
                rich: {
                    a: {
                        color: 'transparent',
                        lineHeight: 22,
                        align: 'center'
                    },
                }
            },
            data:grades
        }
    ]
}
展示效果如下: evernotecid://E6FB590A-664F-47BB-8E48-D99D9C95AA62/appyinxiangcom/29499089/ENResource/p39
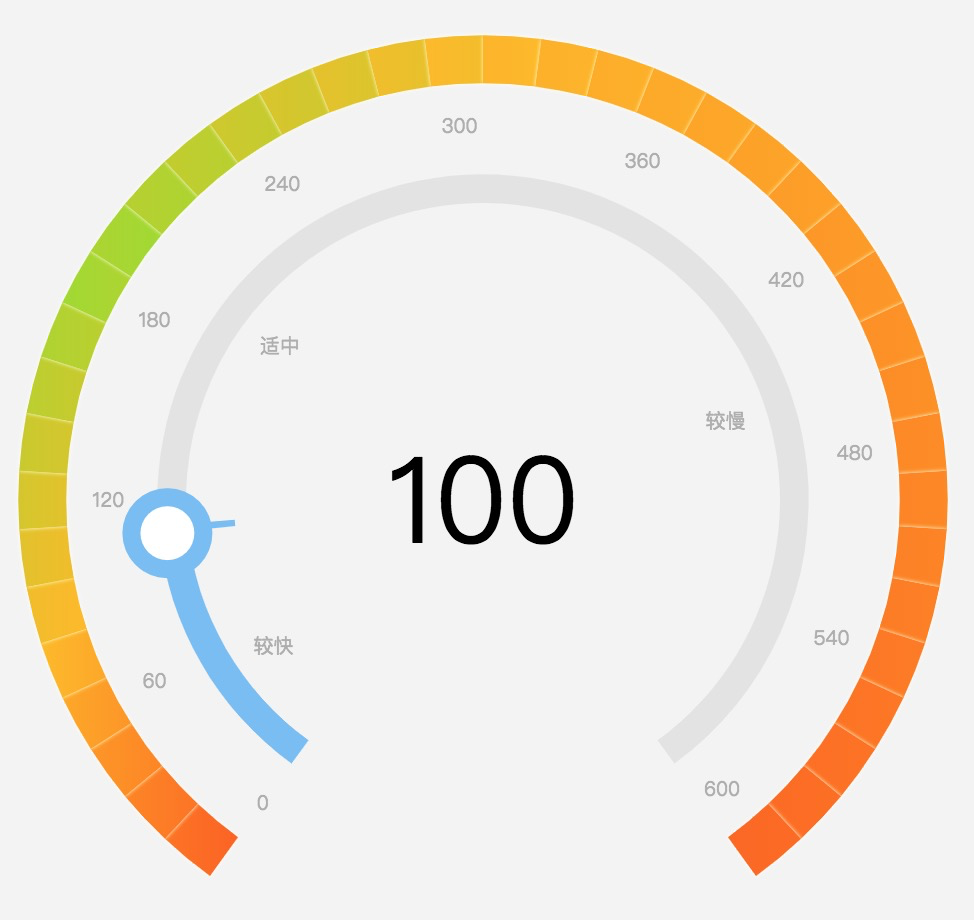
案例2
const Length = 40 //默认分割40份(显示的扇形部分)
const showPercent = 0.8
const props = {
max:600,
value:100,
low:80,
high:300
}
const radius = 600//直径
const c1 = '#FF630D'
const c2 = '#FFBA00'
const c3 = '#A0DB1B'
const c_blue = '#77BCF4'//画圈的颜色
const FontSize = 10
function rgbToHex(r, g, b) {
var hex = ((r << 16) | (g << 8) | b).toString(16);
return "#" + new Array(Math.abs(hex.length - 7)).join("0") + hex;
}
// hex to rgb
function hexToRgb(hex) {
var rgb = [];
for (var i = 1; i < 7; i += 2) {
rgb.push(parseInt("0x" + hex.slice(i, i + 2)));
}
return rgb;
}
// 计算渐变过渡色 startColor:初始色号,endColor最终色号,step渐变步数
function gradient(startColor, endColor, step) {
// 将 hex 转换为rgb
var sColor = hexToRgb(startColor),
eColor = hexToRgb(endColor);
// 计算R\G\B每一步的差值
var rStep = (eColor[0] - sColor[0]) / step;
gStep = (eColor[1] - sColor[1]) / step;
bStep = (eColor[2] - sColor[2]) / step;
var gradientColorArr = [];
for (var i = 0; i < step; i++) {
// 计算每一步的hex值
gradientColorArr.push(rgbToHex(parseInt(rStep * i + sColor[0]), parseInt(gStep * i + sColor[1]), parseInt(bStep * i + sColor[2])));
}
return gradientColorArr;
}
function formatData() {
const { max, value } = props
if (value > max) {
console.error('超出最大值,请检查是否出错')
}
const MaxNum = max * (1 + 30 / 600)
const CriticalValue = max
const showNum = max
const TotalNum = max / showPercent
const hideNum = TotalNum - showNum
const unit = showNum / 600
const kedu = showNum / Length //默认 60对应4格,则一个刻度=15
const startAngle = -180 + 90 - ((360 * (1 - showPercent) / 2))
return { MaxNum, CriticalValue, showNum, hideNum, TotalNum, unit, kedu, startAngle }
}
function getColors() {
const { low, high } = props
const { showNum, unit, kedu } = formatData()// metricData
const p1 = Math.floor(low / kedu)
const p2 = Math.floor(high / kedu)
if (p1 < Length) {
if (p2 < Length) {
let ss = gradient(c1, c2, p1)
.concat(gradient(c2, c3, Math.floor((p2 - p1) / 2)))
.concat(gradient(c3, c2, Math.ceil((p2 - p1) / 2)))
.concat(gradient(c2, c1, (Length - p2 + 1)))
console.log('color length', ss.length)
return ss
} else {
console.error('较慢值已经超出限定值' + Length)
}
} else {
console.error('较快值已经超出限定值' + Length)
}
return []
}
function getData() {
const { low, high } = props
const { showNum, unit, hideNum } = formatData()//metricData
const p1 = low
const p2 = high
return [
{ value: p1, name: '较快' },
{ value: p2 - p1, name: '适中' },
{ value: showNum - p2, name: '较慢' },
{ value: hideNum, name: '' }
]
}
function getCircleSelectedLabel() {
const per = 0.06
return {
borderColor: c_blue,
borderWidth: radius * per / 4,
width: radius * per,
height: radius * per,
borderRadius: radius * per / 2,
color: 'transparent',
backgroundColor: '#fff',
position: 'inner'
}
}
function getGradesText() {
let grades_txt = []
const { showNum, TotalNum } = formatData()
for (let i = 0; i < Length * (TotalNum / showNum); i++) {
const item = {
value: 1,
name: ''
}
grades_txt.push(item)
}
// console.log('grades_txt length', grades_txt.length)
return grades_txt
}
function getOption() {
const { max,value } = props
const { MaxNum, showNum, TotalNum, hideNum, kedu, unit, startAngle } = formatData(props)
let objValue = Math.floor(value / unit)
objValue = objValue > showNum ? MaxNum : objValue
const colorArr = getColors()
const data___ = getGradesText()
return {
series: [
{
name:'',
type:'pie',
radius:['64%','65%'],
data:[//长度为1一位数组,画单色线
{ value:1,
name:props.value,label:{
color:'#000',
fontSize:60
}}],
itemStyle:{
color:'transparent',//线的颜色
},
label:{
position:'center',//内容展示在圆形正中间
}
},
{
name: '',//文字较快-适中-较慢
type: 'pie',
radius: ['42%', '62%'],
startAngle: startAngle,
data: getData(),
label: {
position: 'inside',
color: '#AEAEAE',
fontSize: FontSize,
},
itemStyle: {
color: 'transparent',
},
},
{//画圆圈⭕️ 背景 蓝灰
name: '',
type: 'pie',
radius: ['62%', '68%'],
startAngle: startAngle,
itemStyle: {
color: (props) => {
const { dataIndex } = props
if (value <= showNum) {
if (dataIndex === 0) {
return c_blue
}
if (dataIndex === 1) return '#e3e3e3'
else return 'transparent'
} else {
if (dataIndex === 0 || dataIndex === 1) {
return c_blue
}
else return 'transparent'
}
},
},
label: {
position: 'inner',
rich: {}
},
data: value <= showNum ?
[value, showNum - value, hideNum] :
[showNum, MaxNum - showNum, TotalNum - MaxNum]
},
{//仅仅是⭕️
name: '',//蓝色,灰色部分的环形
type: 'pie',
radius: ['62%', '68%'],
startAngle: startAngle,
label: {
position: 'inside',
rich: {},
},
itemStyle: {
color: (props) => {
const { dataIndex } = props
return 'transparent'
},
},
data: TotalNum - value * 2 >= 0 ? [
{ value: value * 2, name: '1', label: getCircleSelectedLabel() },
{ value: TotalNum - value * 2 }]
:
[
{ value: TotalNum / 2 },
{ value: ((value > showNum ? MaxNum : value) - TotalNum / 2) * 2, name: '1', label: getCircleSelectedLabel() },
{ value: TotalNum - TotalNum / 2 - ((value > showNum ? MaxNum : value) - TotalNum / 2) * 2 }
]
},
{//⭕️下面的指示线
name: '',//蓝色,灰色部分的环形
type: 'pie',
radius: ['52%', '70%'],
startAngle: startAngle,
markPoint: {
symbol: 'circle'
},
label: {
position: 'inside',
rich: {},
},
labelLine: {
show: true,
length: 20,
},
itemStyle: {
color: (props) => {
const { dataIndex } = props
if (value <= showNum) {
if (dataIndex === 1) return c_blue
} else {
if (dataIndex === 1) {
return c_blue
}
}
return 'transparent'
},
},
data: value <= showNum ? [value, unit * 3, TotalNum - value - unit * 3]
:
[MaxNum, unit * 3, TotalNum - MaxNum - unit * 3]
},
{
name: '',//文字
type: 'pie',
radius: ['67%', '87%'],//20%
data: data___.concat([1 / MaxNum]), // 为了将最后一项标记为A
startAngle: startAngle,
label: {
position: 'inside',
formatter: (props = { value }) => {
const { value, dataIndex } = props
// const num = (dataIndex + 1) * kedu
const num = (dataIndex + 1) * kedu
const OneKedu = kedu * 4 //用于显示文字
if ((dataIndex + 1) % 4 === 0 && num <= showNum) {
return Math.floor(num * 100) / 100
}
if (dataIndex === data___.length) return '0'
if (max > showNum || props.value > props.max) {
if (MaxNum === num) {
return '其他'
}
}
return null
},
color: '#AEAEAE',
fontSize: FontSize
},
itemStyle: {
color: 'transparent',
}
},
{
name: '',
type: 'pie',
radius: ['87%', '97%'],
startAngle: startAngle,
itemStyle: {
shadowColor: 'rgba(255, 255, 255, 1)',
shadowBlur: 2,
borderWidth: 1,
color: (props) => {
const { dataIndex } = props
const num = dataIndex * kedu
const setGridentColor = (dataIndex_) => {
if (colorArr[dataIndex_] && colorArr[dataIndex_ + 1])
return new echarts.graphic.LinearGradient(1, 0, 0, 0, [{ //颜色渐变函数 前四个参数分别表示四个位置依次为左、下、右、上
offset: 0,
color: colorArr[dataIndex_]
}, {
offset: 1,
color: colorArr[dataIndex_ + 1]
}])
return null
}
if (num < showNum) {
console.log(`dataIndex:${dataIndex}---num:${num},showNum:${showNum},MaxNum${MaxNum}`)
// return colorArr[dataIndex] ? colorArr[dataIndex] : 'transparent'
return setGridentColor(dataIndex) || 'transparent'
}
if (max > showNum || props.value > props.max) {
console.log(`dataIndex:${dataIndex}---num:${num},showNum:${showNum},MaxNum${MaxNum}`)
if (num < MaxNum) {
return colorArr[colorArr.length - 1]
}
}
return 'transparent'
// return colorArr[dataIndex] ? colorArr[dataIndex] : 'transparent'
},
},
label: {
position: 'inner',
backgroundColor: '',
rich: {}
},
data: data___
}
]
};
}
option = getOption()
展示效果如下:
evernotecid://E6FB590A-664F-47BB-8E48-D99D9C95AA62/appyinxiangcom/29499089/ENResource/p40
(1)该案例有用到渐变方法,如下:
new echarts.graphic.LinearGradient(1, 0, 0, 0, [{ //颜色渐变函数 前四个参数分别表示四个位置依次为左、下、右、上
                                        offset: 0,
                                        color: colorArr[dataIndex_]
                                    }, {
                                        offset: 1,
                                        color: colorArr[dataIndex_ + 1]
                                    }])
