kubernetes作为一个复杂的系统,其性能指标体系需要DevOps团队好好地梳理。
kubernetes SLI/SLO
什么是SLI/SLO
SLI:service level indicator,测量指标。SLI的建立需要回答:
- 要测量的指标是什么?
- 测量时的系统状态?
- 如何汇总处理测量的指标?
- 测量指标能否准确描述服务质量?
- 测量指标的可靠度(trustworthy)?
SLO:service level objects,偏重于目标,即服务提供功能的期望状态。
SLA:service level aggrement,一个涉及2方的合约,双方必须都要同意并遵守这个合约。当需要对外提供服务时,SLA是非常重要的一个服务质量信号,需要产品和法务部门的同时介入。
通俗的来说,SLI定义了我要测试什么,SLO定义了长期来看什么指标要有哪些规范,而SLA定义了与用户的协议。
参考资料:
official SLI/SLO
参考社区的SLO标准。由于社区在这方面的建设还在推进中,目前只有三个official的SLO,摘录如下
| Status | SLI | SLO |
|---|---|---|
| Official | Latency of mutating API calls for single objects for every (resource, verb) pair, measured as 99th percentile over last 5 minutes | In default Kubernetes installation, for every (resource, verb) pair, excluding virtual and aggregated resources and Custom Resource Definitions, 99th percentile per cluster-day <= 1s |
| Official | Latency of non-streaming read-only API calls for every (resource, scope pair, measured as 99th percentile over last 5 minutes | In default Kubernetes installation, for every (resource, scope) pair, excluding virtual and aggregated resources and Custom Resource Definitions, 99th percentile per cluster-day (a) <= 1s if scope=resource (b) <= 5s if scope=namespace (c) <= 30s if scope=cluster |
| Official | Startup latency of schedulable stateless pods, excluding time to pull images and run init containers, measured from pod creation timestamp to when all its containers are reported as started and observed via watch, measured as 99th percentile over last 5 minutes | In default Kubernetes installation, 99th percentile per cluster-day <= 5s |
社区还定义了SLO满足的前提:
In order to meet SLOs, system must run in the environment satisfying the following criteria:
Runs a single or more appropriately sized master machines Events are stored in a separate etcd instance (or cluster) All etcd instances are running on master machine(s) Kubernetes version is at least X.Y.Z To make the cluster eligible for SLO, users also can't have too many objects in their clusters. More concretely, the number of different objects in the cluster MUST satisfy thresholds defined in thresholds file.
In order to meet SLOs, you have to use extensibility features "wisely". The more precise formulation is to-be-defined, but this includes things like:
webhooks have to provide high availability and low latency CRDs and CRs have to be kept within thresholds
总结起来大致有三点:
- etcd的events单独存储
- 资源负载不超标
- webhook保证高性能
如果仅仅play with kubernetes,不做任何调优,那么大概率会有一些SLO无法满足,但也不会太差。何况只有大规模场景下讨论性能才足够有意义。
这里粗略的说一下我遇到的SLO的问题:
- etcd的性能在虚拟机上是个大问题
- 涉及到U面操作,如CRI, CNI上的操作,有时会导致SLO无法满足
- etcd自己的性能问题与相应优化
perf-tests/clusterloader2
社区的perf-tests包含了一系列测试工具。
-
benchmark: This tool enables comparing performance of a given kubemark test against that of the corresponding real cluster test. The comparison is based on the API request latencies and pod startup latency metrics.
-
clusterloader2 :测试大规模高负载下调度器的吞吐量(pod/s),以及集群的资源消耗情况,具体的测试指标不额外列出了
-
compare: This tool is able to analyze data embedded in Kubernetes e2e test results and show differences between runs.
-
dns: 测试DNS性能
-
network: 用iperf和netperf测网络性能
-
perfdash:有一个UI界面,尝试后无法直接运行
-
probes: Probes are simple jobs running inside kubernetes cluster measuring SLIs that could not be measured through other means。只能监测网络的性能,并且注意到clusterloader2测试时会自动安装probes组件。
-
SLO monitor: This tool monitors Performance SLOs that are unavailable from the API server and exposes Prometheus metrics for them.
这些零零碎碎的组件中,最有价值的是clusterloader2,其次是SLO monitor。
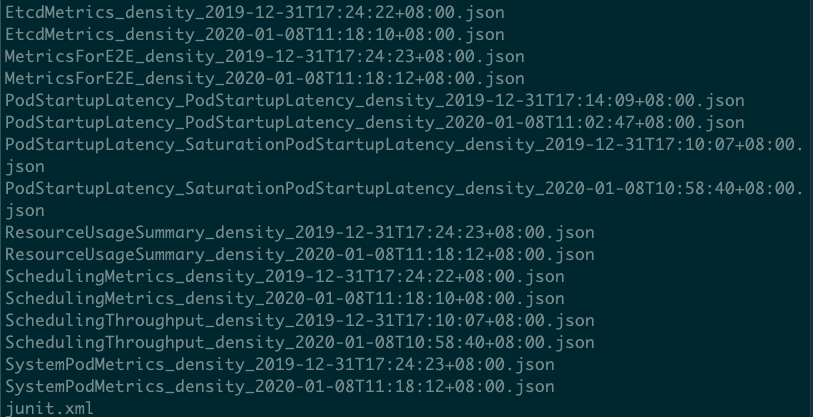
clusterloader2测试之后的样例结果如下:

具体的指标、每个指标代表什么意思,以及为了跑通clusterloader2,需要做哪些配置,有什么坑,我会另外写一篇更深入的文章。
要注意的是:clusterloader2即可在物理集群测试,也可以在kubemark进行。进行大规模的控制面验证时,采用kubemark + clusterloader2 是一个比较理想的方案。对kubemark不熟的童鞋可以参考我之前的文章可能是最实用的kubemark攻略。
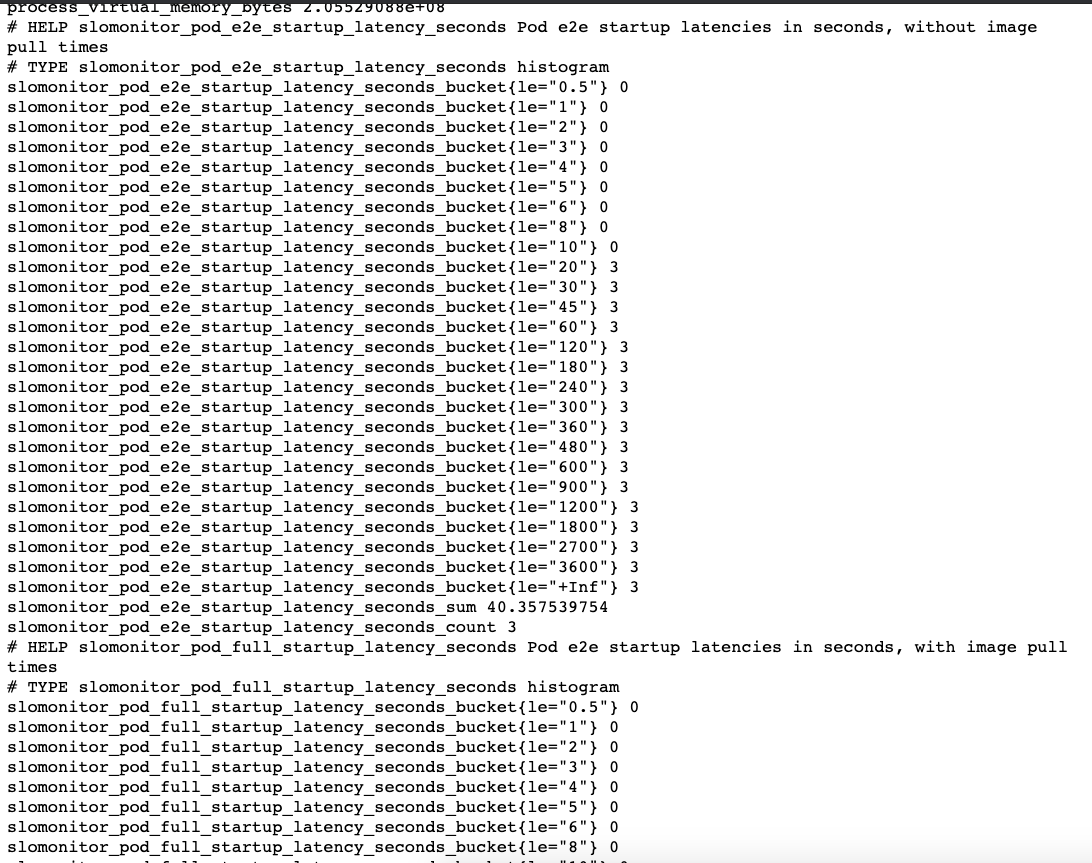
SLO monitor使用后的效果如下:

结合监控系统食用风味更佳。
综上所述,在进行性能指标的测试与baseline的制定时,我们会以clusterloader2为主要的测试工具。
虽然这里说的轻飘飘的,但是clusterloader2还是有很多坑要踩的,踩坑过程就下一篇再说咯。