

最后更新时间
2020.02.15 15时
背景
在 Android 开发工作中,内存泄露一直是让人比较头疼的问题。首先内存泄露并不是一个 Java 异常,所以我们并不能实时感知到它,一般只有等到内存溢出的时候,我们才会去排除是否发生了内存泄露问题。而往往导致抛异常的代码并不是内存泄露的凶手,而只是压死骆驼的最后一根稻草而已,这是第一个问题。第二个问题则是,当我们想要分析内存问题时,首先需要先 dump 内存快照,通常是以 .hprof 结尾的文件,接着再使用 MAT 等内存分析工具去检测大内存可疑对象,分析对象到 GC Roots 节点的可达性等等。整个流程相对繁琐,这时候我们可能会考虑是否有自动化工具,来帮助我们去分析那些常见的内存泄露场景呢。
LeakCanary
LeakCanary 就是为了解决以上问题而诞生的。2019 年 11 月 的时候,LeakCanary2 正式版发布,和 LeakCanary1 相比,LeakCanary2 有以下改动:
其中,将 Heap 分析模块作为一个独立的模块,是一个非常不错的改动。这意味着,可以基于 Shark 来做很多有意思的事情,比如,用于线上分析或者开发一个"自己"的 LeakCanary。
整体架构
在分析源码之前,我们先看 LeakCanary 的整体结构,这有助于我们对项目整体设计上有一定理解。LeakCanary2 有以下几个模块:
-
leakcanary-android
集成入口模块,提供 LeakCanary 安装,公开 API 等能力
-
leakcanary-android-core
核心模块
-
leakcanary-android-process
和 leakcanary-android 一样,区别是会在单独的进程进行分析
-
leakcanary-android-instrumentation
用于 Android Test 的模块
-
leakcanary-object-watcher-android,leakcanary-object-watcher-android-androidx,leakcanary-watcher-android-support-fragments
对象实例观察模块,在 Activity,Fragment 等对象的生命周期中,注册对指定对象实例的观察,有 Activity,Fragment,Fragment View,ViewModel 等
-
shark-android
提供特定于 Android 平台的分析能力。例如设备的信息,Android 版本,已知的内存泄露问题等
-
shark,shark-test
hprof 文件解析与分析的入口模块,还有对应的 Test 模块
-
shark-graph
分析堆中对象的关系图模块
-
shark-hprof,shark-hprof-test
解析 hprof 文件模块,还有对应的 Test 模块
-
shark-log
日志模块
-
shark-cli
shark-android 的 cli 版本
集成方式
首先,我们从集成方式入手,LeakCanary1 的依赖为:
dependencies {
  debugImplementation 'com.squareup.leakcanary:leakcanary-android:1.6.3'
  releaseImplementation 'com.squareup.leakcanary:leakcanary-android-no-op:1.6.3'
}
接着在 Application 中调用 LeakCanary.install() 方法。而 LeakCanary2 集成则要简单不少,只需要增加以下依赖即可:
dependencies {
  debugImplementation 'com.squareup.leakcanary:leakcanary-android:2.2'
}
也就是说 LeakCanary2 实现了自动调用 install() 方法,实现方式可能大部分人都能猜到,就是使用的 ContentProvider,相关代码位于 leakcanary-object-watcher-android 模块中的 AppWatcherInstaller.kt 中。
AppWatcherInstaller 继承 ContentProvider,重写了 onCreate() 方法,这里利用的是,注册在 Manifest 文件中的 ContentProvider,会在应用启动时,由 ActivityThread 创建并初始化。
override fun onCreate(): Boolean {
  val application = context!!.applicationContext as Application
  InternalAppWatcher.install(application)
  return true
}
AppWatcherInstaller 有两个实现类,一个是 MainProcess,当我们使用 leakcanary-android 模块时,会默认使用这个,表示在当前 App 进程中使用 LeakCanary。另外一个类为 LeakCanaryProcess,当使用 leakcanary-android-process 模块代替 leakcanary-android 模块时,则会使用这个类,我们可以看下 leakcanary-android-process 的 Manifest 文件:
这里利用的 leakcanary-android-process Manifest 优先级要高于 leakcanary-object-watcher-android
<manifest xmlns:android="http://schemas.android.com/apk/res/android"
    package="com.squareup.leakcanary">

  <application>
    <service
        android:name="leakcanary.internal.HeapAnalyzerService"
        android:exported="false"
        android:process=":leakcanary" />

    <provider
        android:name="leakcanary.internal.AppWatcherInstaller$LeakCanaryProcess"
        android:authorities="${applicationId}.leakcanary-process.installer"
        android:process=":leakcanary"
        android:exported="false"/>
  </application>

</manifest>
可以看到,HeapAnalyzerService 和 LeakCanaryProcess 都会在运行在 :leakcanary 进程,关于 HeapAnalyzerService 的作用,我们后面会讲到。
这里有个需要注意的是,如果使用 LeakCanaryProcess,默认会禁用 Watcher 功能,这个也很好理解,处于不同进程,是没办法观察到 APP 进程的对象。
internal class LeakCanaryProcess : AppWatcherInstaller() {
  override fun onCreate(): Boolean {
    super.onCreate()
    AppWatcher.config = AppWatcher.config.copy(enabled = false)
    return true
  }
}
AppWatcher
Watcher 功能的入口位于 InternalAppWatcher.install() 方法中,这个方法的调用时机则是我们上面说到的 AppWatcherInstaller.onCreate() 中。
fun install(application: Application) {
  ActivityDestroyWatcher.install(application, objectWatcher, configProvider)
  FragmentDestroyWatcher.install(application, objectWatcher, configProvider)
  onAppWatcherInstalled(application)
}
这里主要做了两件事,首先是 Activity 和 Fragment 对象的注册观察,这里我们以 ActivityDestroyWatcher 为例,Fragment 的处理也是类似的。
ActivityDestroyWatcher
fun install(
  application: Application,
  objectWatcher: ObjectWatcher,
  configProvider: () -> Config
) {
  val activityDestroyWatcher =
    ActivityDestroyWatcher(objectWatcher, configProvider)
  application.registerActivityLifecycleCallbacks(activityDestroyWatcher.lifecycleCallbacks)
}
调用 registerActivityLifecycleCallbacks() 方法注册 Activity 生命周期回调。
override fun onActivityDestroyed(activity: Activity) {
  if (configProvider().watchActivities) {
    objectWatcher.watch(
        activity, "${activity::class.java.name} received Activity#onDestroy() callback"
    )
  }
}
在每个 Activity.onDestory 回调中,将每个 Activity 对象加到观察列表中。
private val watchedObjects = mutableMapOf<String, KeyedWeakReference>()

private val queue = ReferenceQueue<Any>()

@Synchronized fun watch(
  watchedObject: Any,
  description: String
) {
  if (!isEnabled()) {
    return
  }
  removeWeaklyReachableObjects()
  val key = UUID.randomUUID()
      .toString()
  val watchUptimeMillis = clock.uptimeMillis()
  val reference =
    KeyedWeakReference(watchedObject, key, description, watchUptimeMillis, queue)

  watchedObjects[key] = reference
  checkRetainedExecutor.execute {
    moveToRetained(key)
  }
}

private fun removeWeaklyReachableObjects() {
  var ref: KeyedWeakReference?
  do {
    ref = queue.poll() as KeyedWeakReference?
    if (ref != null) {
      watchedObjects.remove(ref.key)
    }
  } while (ref != null)
}
首先我们要知道 KeyedWeakReference 继承于 WeakReference,弱引用是不会阻止 GC 回收对象的,同时我们可以在构造函数中传递一个 ReferenceQueue,用于对象被 GC 后存放的队列。
class KeyedWeakReference(
  referent: Any,
  val key: String,
  val description: String,
  val watchUptimeMillis: Long,
  referenceQueue: ReferenceQueue<Any>
) : WeakReference<Any>
所以 removeWeaklyReachableObjects() 方法的作用就是将已经被 GC 的对象从 watchedObjects 集合中删除。
当我们调用 watch() 方法时,先清理已经被 GC 的对象,接着将需要观察的对象,存储为一个 KeyedWeakReference 的弱引用对象,再存放到 watchedObjects 集合中,最后使用 checkRetainedExecutor 安排一次 moveToRetained 任务。
checkRetainedExecutor 是使用 Handler 实现,默认延迟 5s 执行任务。
val watchDurationMillis: Long = TimeUnit.SECONDS.toMillis(5)
private val checkRetainedExecutor = Executor {
  mainHandler.postDelayed(it, AppWatcher.config.watchDurationMillis)
}
接下来,我们再来看下 moveToRetained() 的代码:
@Synchronized private fun moveToRetained(key: String) {
  removeWeaklyReachableObjects()
  val retainedRef = watchedObjects[key]
  if (retainedRef != null) {
    retainedRef.retainedUptimeMillis = clock.uptimeMillis()
    onObjectRetainedListeners.forEach { it.onObjectRetained() }
  }
}
同样的,先调用一次 removeWeaklyReachableObjects() 删除已经 GC 的对象,那么剩下的对象就可以认为是被保留(没办法 GC)的对象,会调通知事件。
onAppWatcherInstalled
在 InternalAppWatcher.install() 方法的最后,还有一个 onAppWatcherInstalled 的调用,它是一个方法对象,在 Kotlin 中一切皆对象,包括方法,它的赋值在 init 块中:
init {
  val internalLeakCanary = try {
    val leakCanaryListener = Class.forName("leakcanary.internal.InternalLeakCanary")
    leakCanaryListener.getDeclaredField("INSTANCE")
        .get(null)
  } catch (ignored: Throwable) {
    NoLeakCanary
  }
  @kotlin.Suppress("UNCHECKED_CAST")
  onAppWatcherInstalled = internalLeakCanary as (Application) -> Unit
}
这段代码对不熟悉 Kotlin 的小伙伴来说可能有点绕,首先 internalLeakCanary 是一个方法对象,它的方法签名转化为 Java 代码为:
void invoke(Application) {

}
而这个对象的值是通过反射获取的 InternalLeakCanary.INSTANCE 这是一个单例对象。InternalLeakCanary 位于 leakcanary-android-core 模块,这也是需要反射的原因,这样的处理值得商榷。
当调用 onAppWatcherInstalled() 方法时,实际会调用 InternalLeakCanary.invoke() 方法:
override fun invoke(application: Application) {
  this.application = application

  AppWatcher.objectWatcher.addOnObjectRetainedListener(this)

  val heapDumper = AndroidHeapDumper(application, leakDirectoryProvider)

  val gcTrigger = GcTrigger.Default

  val configProvider = { LeakCanary.config }

  val handlerThread = HandlerThread(LEAK_CANARY_THREAD_NAME)
  handlerThread.start()
  val backgroundHandler = Handler(handlerThread.looper)

  heapDumpTrigger = HeapDumpTrigger(
      application, backgroundHandler, AppWatcher.objectWatcher, gcTrigger, heapDumper,
      configProvider
  )
  application.registerVisibilityListener { applicationVisible ->
    this.applicationVisible = applicationVisible
    heapDumpTrigger.onApplicationVisibilityChanged(applicationVisible)
  }
  registerResumedActivityListener(application)
  addDynamicShortcut(application)

  disableDumpHeapInTests()
}
这里做的事情比较多,首先是 addOnObjectRetainedListener() 方法,这里会注册一个 OnObjectRetainedListener 事件,也就是我们上面说到的在 moveToRetained() 方法中的回调事件。
AndroidHeapDumper 则是通过调用 Debug.dumpHprofData() 方法从虚拟机中 dump hprof 文件。
GcTrigger 通过调用 Runtime.getRuntime().gc() 方法触发虚拟机进行 GC 操作。
HeapDumpTrigger 管理触发 Heap Dump 的逻辑,有两个地方会触发 Heap Dump:
-
保留对象超过阙值
这个阙值默认为 5(应用可见的情况下),可以通过
Config配置:val retainedVisibleThreshold: Int = 5当
ObjectWatcher回调onObjectRetained()方法时,HeapDumpTrigger.onObjectRetained()方法会被调用:fun onObjectRetained() { scheduleRetainedObjectCheck( reason = "found new object retained", rescheduling = false ) } private fun scheduleRetainedObjectCheck( reason: String, rescheduling: Boolean, delayMillis: Long = 0L ) { val checkCurrentlyScheduledAt = checkScheduledAt if (checkCurrentlyScheduledAt > 0) { // 同时只会有一个任务 val scheduledIn = checkCurrentlyScheduledAt - SystemClock.uptimeMillis() return } checkScheduledAt = SystemClock.uptimeMillis() + delayMillis backgroundHandler.postDelayed({ checkScheduledAt = 0 checkRetainedObjects(reason) }, delayMillis) } private fun checkRetainedObjects(reason: String) { val config = configProvider() if (!config.dumpHeap) { return } var retainedReferenceCount = objectWatcher.retainedObjectCount if (retainedReferenceCount > 0) { // 先执行一次 GC gcTrigger.runGc() retainedReferenceCount = objectWatcher.retainedObjectCount } // 检测当前保留对象数量 if (checkRetainedCount(retainedReferenceCount, config.retainedVisibleThreshold)) return if (!config.dumpHeapWhenDebugging && DebuggerControl.isDebuggerAttached) { // 默认 debug 时不执行,重新安排到 20s 后 scheduleRetainedObjectCheck( reason = "debugger is attached", rescheduling = true, delayMillis = WAIT_FOR_DEBUG_MILLIS ) return } val now = SystemClock.uptimeMillis() val elapsedSinceLastDumpMillis = now - lastHeapDumpUptimeMillis if (elapsedSinceLastDumpMillis < WAIT_BETWEEN_HEAP_DUMPS_MILLIS) { // 60s 内只会执行一次,重新安排 scheduleRetainedObjectCheck( reason = "previous heap dump was ${elapsedSinceLastDumpMillis}ms ago (< ${WAIT_BETWEEN_HEAP_DUMPS_MILLIS}ms)", rescheduling = true, delayMillis = WAIT_BETWEEN_HEAP_DUMPS_MILLIS - elapsedSinceLastDumpMillis ) return } dismissRetainedCountNotification() // 执行 dump heap dumpHeap(retainedReferenceCount, retry = true) } private fun checkRetainedCount( retainedKeysCount: Int, retainedVisibleThreshold: Int ): Boolean { val countChanged = lastDisplayedRetainedObjectCount != retainedKeysCount lastDisplayedRetainedObjectCount = retainedKeysCount if (retainedKeysCount == 0) { // 没有保留对象 return true } if (retainedKeysCount < retainedVisibleThreshold) { // 低于阙值 if (applicationVisible || applicationInvisibleLessThanWatchPeriod) { // 当前应用可见,或者不可见时间间隔少于 5s,重新安排到 2s 后 scheduleRetainedObjectCheck( reason = "found only $retainedKeysCount retained objects (< $retainedVisibleThreshold while app visible)", rescheduling = true, delayMillis = WAIT_FOR_OBJECT_THRESHOLD_MILLIS ) return true } } return false }上面的代码稍微有点长,所以在关键代码处添加了注释。在执行 heap dump 之前,需要处理几种情况,比如当前是不是处于调试模式,距离上一次执行有没有超过 60s,当前应用是否处于可见状态等等,最终执行的方法是
dumpHeap():private fun dumpHeap( retainedReferenceCount: Int, retry: Boolean ) { val heapDumpFile = heapDumper.dumpHeap() // 因为这些对象我们已经 dump 出来分析了,所以没必要保留它们了 objectWatcher.clearObjectsWatchedBefore(heapDumpUptimeMillis) HeapAnalyzerService.runAnalysis(application, heapDumpFile) } // ObjectWatcher.kt @Synchronized fun clearObjectsWatchedBefore(heapDumpUptimeMillis: Long) { val weakRefsToRemove = watchedObjects.filter { it.value.watchUptimeMillis <= heapDumpUptimeMillis } weakRefsToRemove.values.forEach { it.clear() } watchedObjects.keys.removeAll(weakRefsToRemove.keys) }首先调用
HeapDumper.dumpHeap()获取 hprof 文件,接着调用ObjectWatcher.clearObjectsWatchedBefore()方法清理,最后调用HeapAnalyzerService.runAnalysis()进行分析。
小结
从 ObjectWatcher 保存弱引用对象,再到 HeapDumpTrigger 触发 heap dump,整个过程是非常清晰的。
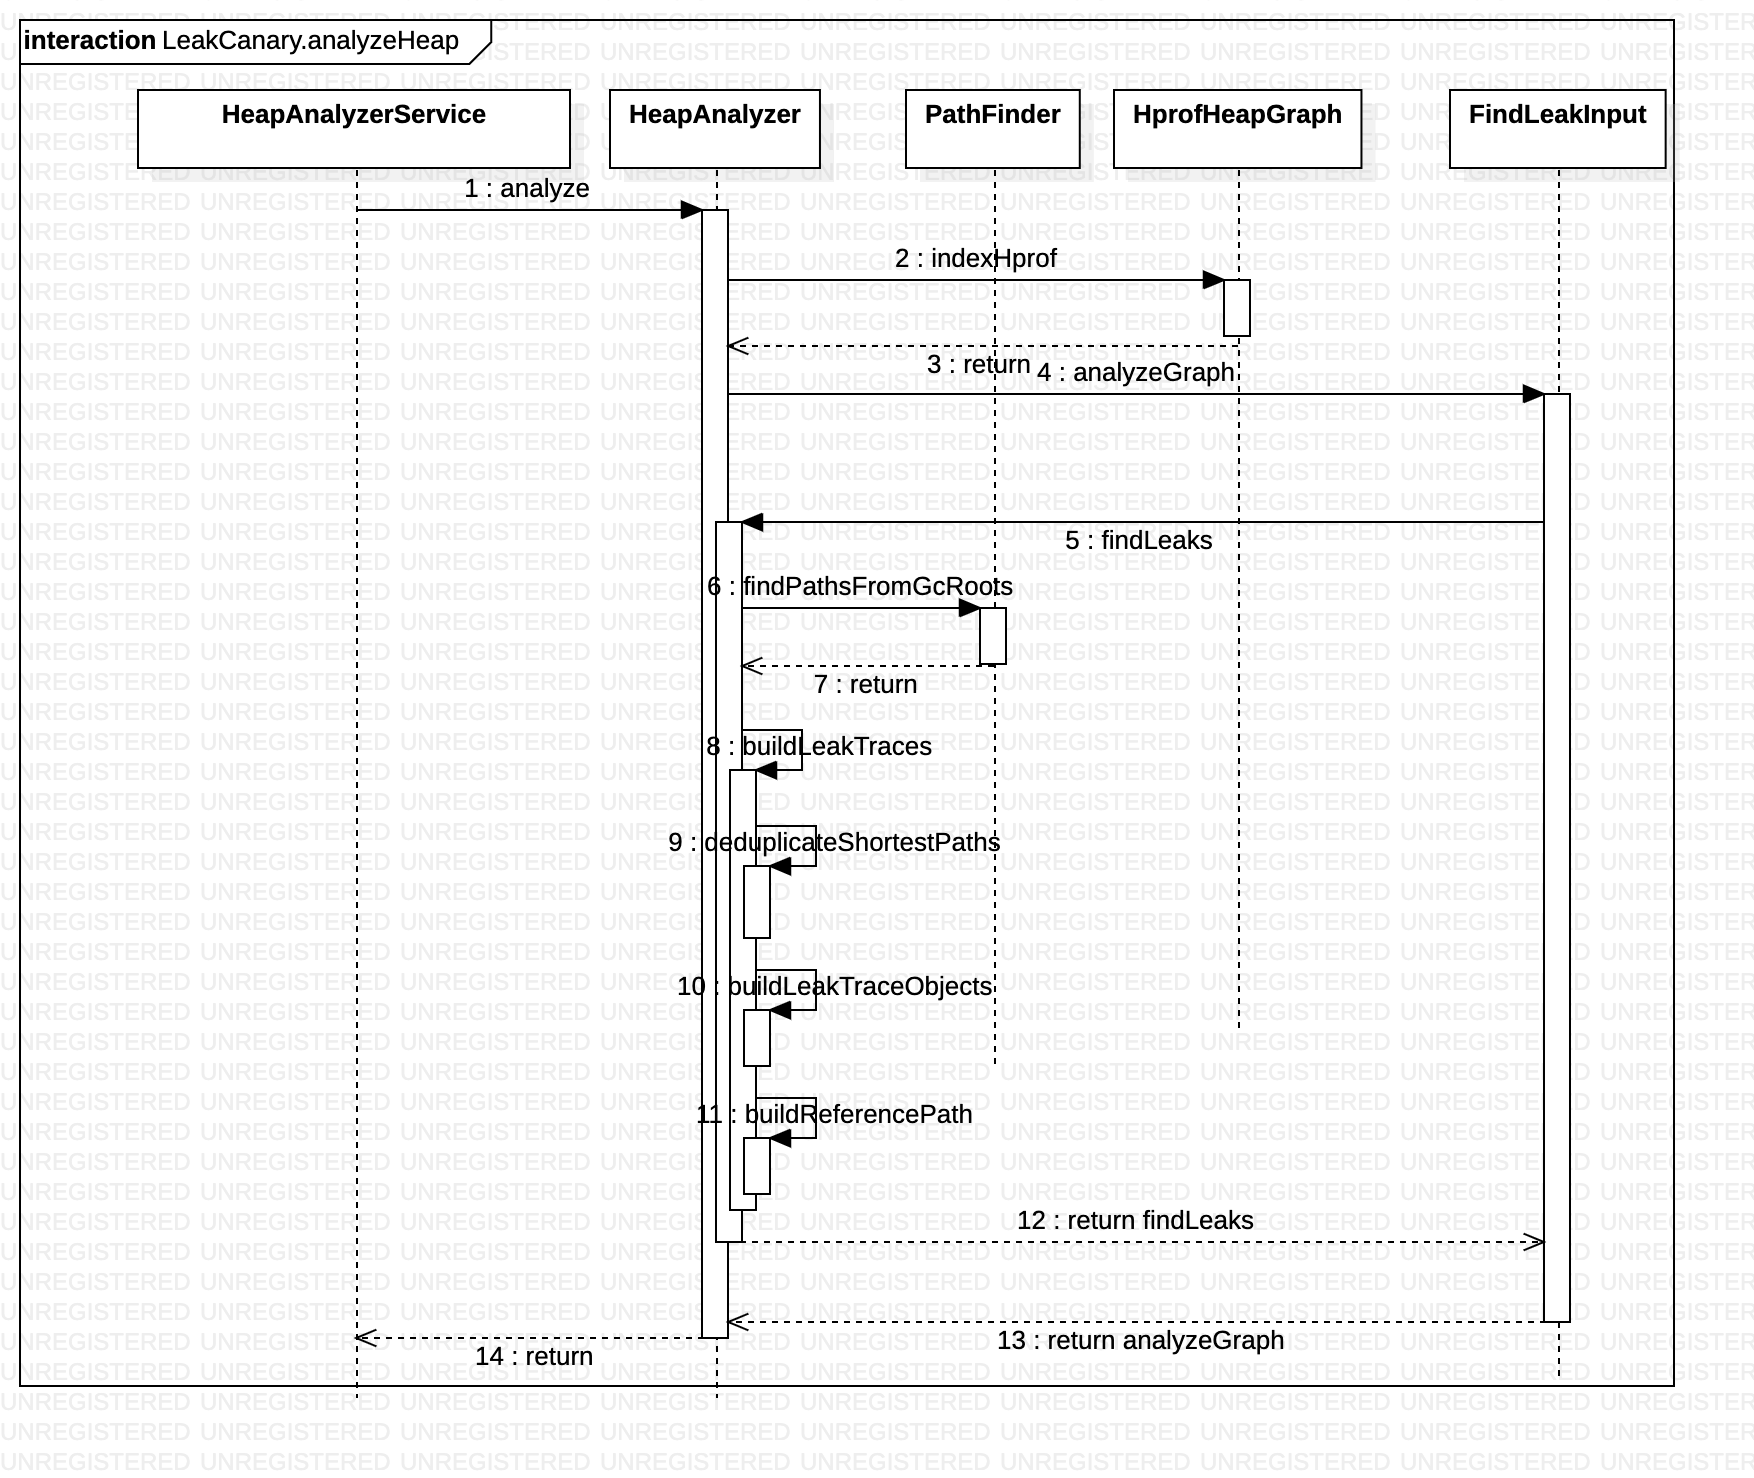
HeapAnalyzerService
HeapAnalyzerService 是继承于 IntentService,调用 runAnalysis() 方法最终会调用到 analyzeHeap() 方法:
private fun analyzeHeap(
  heapDumpFile: File,
  config: Config
): HeapAnalysis {
  val heapAnalyzer = HeapAnalyzer(this)

  val proguardMappingReader = try {
    ProguardMappingReader(assets.open(PROGUARD_MAPPING_FILE_NAME))
  } catch (e: IOException) {
    null
  }
  return heapAnalyzer.analyze(
      heapDumpFile = heapDumpFile,
      leakingObjectFinder = config.leakingObjectFinder,
      referenceMatchers = config.referenceMatchers,
      computeRetainedHeapSize = config.computeRetainedHeapSize,
      objectInspectors = config.objectInspectors,
      metadataExtractor = config.metadataExtractor,
      proguardMapping = proguardMappingReader?.readProguardMapping()
  )
}
proguardMappingReader 是用于处理代码混淆的,支持在测试版本打开代码混淆开关,PROGUARD_MAPPING_FILE_NAME 表示 Mapping 文件,这个文件在 leakcanary-deobfuscation-gradle-plugin 模块处理的,具体的可以看 CopyObfuscationMappingFileTask。
HeapAnalyzer.analyze() 这个方法的作用是:从 hprof 文件中搜索泄露对象,然后计算它们到 GC Roots 的最短路径。
Hprof.open(heapDumpFile)
    .use { hprof ->
      val graph = HprofHeapGraph.indexHprof(hprof, proguardMapping)
      val helpers =
        FindLeakInput(graph, referenceMatchers, computeRetainedHeapSize, objectInspectors)
      helpers.analyzeGraph(
          metadataExtractor, leakingObjectFinder, heapDumpFile, analysisStartNanoTime
      )
    }
解析 hprof 文件
首先,通过调用 Hprof.open() 读取 hprof 文件:
fun open(hprofFile: File): Hprof {
  val fileLength = hprofFile.length()
  if (fileLength == 0L) {
    throw IllegalArgumentException("Hprof file is 0 byte length")
  }
  val inputStream = hprofFile.inputStream()
  val channel = inputStream.channel
  val source = Okio.buffer(Okio.source(inputStream))

  val endOfVersionString = source.indexOf(0)
  val versionName = source.readUtf8(endOfVersionString)

  val hprofVersion = supportedVersions[versionName]

  // Skip the 0 at the end of the version string.
  source.skip(1)
  val identifierByteSize = source.readInt()

  // heap dump timestamp
  val heapDumpTimestamp = source.readLong()

  val byteReadCount = endOfVersionString + 1 + 4 + 8

  val reader = HprofReader(source, identifierByteSize, byteReadCount)

  return Hprof(
      channel, source, reader, heapDumpTimestamp, hprofVersion, fileLength
  )
}
关于 hprof 文件
hprof 是由 JVM TI Agent HPROF 生成的一种二进制文件,关于 hprof 文件格式可以看这里。
hprof 文件可以分为以下几个部分:
header
header 中有以下三个部分组成:
文件格式名和版本号
JDK 1.6 的值为 "JAVA PROFILE 1.0.2",在此之前还有 "JAVA PROFILE 1.0" 和 “JAVA PROFILE 1.0.1”,如果是 Android 平台的话,这个值为 "JAVA PROFILE 1.0.3",这也是为什么 MAT 不支持直接解析 Android 平台生成的 hprof 文件了。
identifiers
4 字节,表示 ID 的大小,它的值可能为 4 或者 8,表示一个 ID 需要用 4 字节或者 8 字节来表示。
时间戳
高位 4 字节 + 低位 4 字节
records
record 表示文件中记录的信息,每个 record 都由以下 4 个部分组成:
tag
1 字节,表示 record 的类型,支持的值可以看文档。
time
4 字节,表示 record 的时间戳。
length
4 字节,表示 body 的字节长度。
body
表示 record 中存储的数据。
JVM TI(JVM tool interface)表示虚拟机工具接口,用于提供查询和控制虚拟机中运行的程序。
Agent 表示代理程序,用于调用 JVM TI 的,会运行在 JVM 的进程中,一般通过
java -agentlib或java -agentpath启动。
在了解完 hprof 文件的格式后,我们再来看 LeakCanary 的解析 hprof 文件的代码,同样的,先依次读取 versionName、identifierByteSize、heapDumpTimestamp 后,再创建一个 HprofReader 用于读取 records。HprofReader 的工作方式也是类似的,根据 tag 的值去读取不同的 record,这里我们以 "STRING IN UTF8" 为例:
 when (tag) {
   STRING_IN_UTF8 -> {
     if (readStringRecord) {
       val recordPosition = position
       val id = readId()
       val stringLength = length - identifierByteSize
       val string = readUtf8(stringLength)
       val record = StringRecord(id, string)
       listener.onHprofRecord(recordPosition, record)
     } else {
       skip(length)
     }
   }
 }
生成 heap graph
HeapGraph 用于表示 heap 中的对象关系图,通过调用 HprofHeapGraph.indexHprof() 生成:
fun indexHprof(
  hprof: Hprof,
  proguardMapping: ProguardMapping? = null,
  indexedGcRootTypes: Set<KClass<out GcRoot>> = setOf(
      JniGlobal::class,
      JavaFrame::class,
      JniLocal::class,
      MonitorUsed::class,
      NativeStack::class,
      StickyClass::class,
      ThreadBlock::class,
      ThreadObject::class,
      JniMonitor::class
  )
): HeapGraph {
  val index = HprofInMemoryIndex.createReadingHprof(hprof, proguardMapping, indexedGcRootTypes)
  return HprofHeapGraph(hprof, index)
}
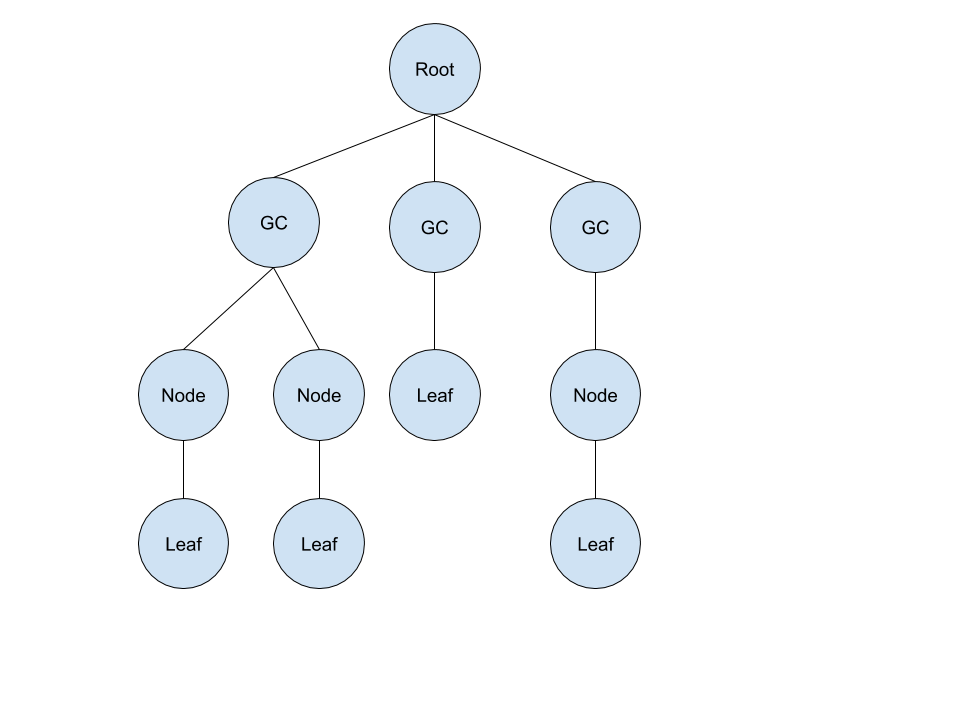
indexedGcRootTypes 表示我们要收集的 GC Roots 节点,可以作为 GC Roots 节点的有以下对象:
  // Traditional.
  HPROF_ROOT_UNKNOWN = 0xFF,
  // native 中的全局变量
  HPROF_ROOT_JNI_GLOBAL = 0x01,
  // native 中的局部变量
  HPROF_ROOT_JNI_LOCAL = 0x02,
  // java 中的局部变量
  HPROF_ROOT_JAVA_FRAME = 0x03,
  // native 中的入参和出参
  HPROF_ROOT_NATIVE_STACK = 0x04,
  // 系统类
  HPROF_ROOT_STICKY_CLASS = 0x05,
  // 活动线程引用的对象
  HPROF_ROOT_THREAD_BLOCK = 0x06,
  // 调用 wait() 或者 notify(),或者 synchronized 的对象
  HPROF_ROOT_MONITOR_USED = 0x07,
  // 活动线程
  HPROF_ROOT_THREAD_OBJECT = 0x08,

  // Android.
  // 调用 String.intern() 的对象
  HPROF_ROOT_INTERNED_STRING = 0x89,
  // 等待 finalizer 调用的对象
  HPROF_ROOT_FINALIZING = 0x8a,  // Obsolete.
  // 用于连接 debugger 的对象
  HPROF_ROOT_DEBUGGER = 0x8b,
  // 未知
  HPROF_ROOT_REFERENCE_CLEANUP = 0x8c,  // Obsolete.
  // 未知
  HPROF_ROOT_VM_INTERNAL = 0x8d,
  // 未知
  HPROF_ROOT_JNI_MONITOR = 0x8e,
  // 不可达,但不是 GC Root
  HPROF_UNREACHABLE = 0x90,  // Obsolete.
上面的是 JVM 定义的,下面的是 Android 平台特有的,具体可以看 hprof.cc。
虽然存在不少 GC Roots 节点,但 LeakCanary 只选取了部分:
-
HPROF_ROOT_JNI_GLOBAL
native 中的全局变量
-
HPROF_ROOT_JAVA_FRAME
java 中的局部变量
-
HPROF_ROOT_JNI_LOCAL
native 中的局部变量
-
HPROF_ROOT_MONITOR_USED
调用 wait() 或者 notify(),或者 synchronized 的对象
-
HPROF_ROOT_NATIVE_STACK
native 中的入参和出参
-
HPROF_ROOT_STICKY_CLASS
系统类
-
HPROF_ROOT_THREAD_BLOCK
活动线程引用的对象
-
HPROF_ROOT_THREAD_OBJECT
活动线程
-
HPROF_ROOT_JNI_MONITOR
未知,可能是 native 中的同步对象
接着会从 hprof 文件中读取 records,读取原理可以参考 hprof 文件格式。这里有个小细节,LeakCanary 只会读取以下几种类型的 record:
-
STRING IN UTF8
0x01,UTF8 格式的字符串
-
LOAD CLASS
0x02,虚拟机中加载的类
-
HEAP DUMP 中的 CLASS DUMP
0x0C 和 0x20,dump 出来内存中的类实例
hprof 1.0.2 版本会用 HEAP DUMP SEGMENT 0x1C 作用是一样的
-
HEAP DUMP 中的 INSTANCE DUMP
0x0C 和 0x21,dump 出来内存中的对象实例
-
HEAP DUMP 中的 OBJECT ARRAY DUMP
0x0C 和 0x22,dump 出来内存中的对象数组实例
-
HEAP DUMP 中的 PRIMITIVE ARRAY DUMP
0x0C 和 0x23,dump 出来内存中的原始类型数组实例
-
HEAP 中 GC Roots
这里包括了上面定义的所有 GC Roots 对象实例
查询泄露对象
在生成 heap graph 后,我们就可以根据它,来获取泄露对象的 objectIds:
// FindLeakInput.analyzeGraph()
val leakingObjectIds = leakingObjectFinder.findLeakingObjectIds(graph)
LeakingObjectFinder 用于查询泄露对象,它的实现有两个:KeyedWeakReferenceFinder 和 FilteringLeakingObjectFinder,默认为 KeyedWeakReferenceFinder,即通过 KeyedWeakReference 引用的对象,关于 KeyedWeakReference 的作用我们在 AppWatcher 那里有说到。
internal fun findKeyedWeakReferences(graph: HeapGraph): List<KeyedWeakReferenceMirror> {
  return graph.context.getOrPut(KEYED_WEAK_REFERENCE.name) {
    val addedToContext: List<KeyedWeakReferenceMirror> = graph.instances
        .filter { instance ->
          val className = instance.instanceClassName
          className == "leakcanary.KeyedWeakReference" || className == "com.squareup.leakcanary.KeyedWeakReference"
        }
        .map {
          KeyedWeakReferenceMirror.fromInstance(
              it, heapDumpUptimeMillis
          )
        }
        .filter { it.hasReferent }
        .toList()
    graph.context[KEYED_WEAK_REFERENCE.name] = addedToContext
    addedToContext
  }
}
KeyedWeakReferenceFinder 通过过滤 heap dump 中的所有 KeyedWeakReference 实例,来获取泄露对象实例。
而 FilteringLeakingObjectFinder 则是用于我们自定义的泄露对象判断逻辑:
override fun findLeakingObjectIds(graph: HeapGraph): Set<Long> {
  return graph.objects
      .filter { heapObject ->
        filters.any { filter ->
          filter.isLeakingObject(heapObject)
        }
      }
      .map { it.objectId }
      .toSet()
}
生成泄露对象报告
LeakCanary 定义了两个泄露类型:ApplicationLeak 和 LibraryLeak:
-
ApplicationLeak
表示应用本身导致内存泄露
-
LibraryLeak
表示依赖库导致的内存泄露,例如 Android Framework 等
以上两种泄露都是通过调用 FindLeakInput.findLeaks() 方法来获取的:
private fun FindLeakInput.findLeaks(leakingObjectIds: Set<Long>): Pair<List<ApplicationLeak>, List<LibraryLeak>> {
  val pathFinder = PathFinder(graph, listener, referenceMatchers)
  val pathFindingResults =
    pathFinder.findPathsFromGcRoots(leakingObjectIds, computeRetainedHeapSize)
  return buildLeakTraces(pathFindingResults)
}
查询泄露对象到 GC Roots 的路径
这是通过 PathFinder.findPathsFromGcRoots() 方法实现的:
fun findPathsFromGcRoots(
  leakingObjectIds: Set<Long>,
  computeRetainedHeapSize: Boolean
): PathFindingResults {

  val sizeOfObjectInstances = determineSizeOfObjectInstances(graph)

  val state = State(leakingObjectIds, sizeOfObjectInstances, computeRetainedHeapSize)

  return state.findPathsFromGcRoots()
}

private fun State.findPathsFromGcRoots(): PathFindingResults {
  enqueueGcRoots()
                                                                                           // 省略
  return PathFindingResults(shortestPathsToLeakingObjects, dominatedObjectIds)
}
State.findPathsFromGcRoots() 的代码有点长,我们一点点分析。
首先是 enqueueGcRoots() 方法,它的作用是将所有 GC Roots 节点放入到队列中:
private fun State.enqueueGcRoots() {
  // 将 GC Roots 进行排序
  // 排序是为了确保 ThreadObject 在 JavaFrames 之前被访问,这样可以通过 ThreadObject.threadsBySerialNumber 获取它的线程信息
  val gcRoots = sortedGcRoots()
  // 存储线程名称
  val threadNames = mutableMapOf<HeapInstance, String>()
  // 存储线程的 SerialNumber,可以通过 SerialNumber 访问对应的线程信息
  val threadsBySerialNumber = mutableMapOf<Int, Pair<HeapInstance, ThreadObject>>()
  gcRoots.forEach { (objectRecord, gcRoot) ->
    if (computeRetainedHeapSize) {
      // 计算泄露对象而保留的内存大小
      undominateWithSkips(gcRoot.id)
    }
    when (gcRoot) {
      is ThreadObject -> {
        // 活动的 Thread 实例
        // 缓存 threadsBySerialNumber
        threadsBySerialNumber[gcRoot.threadSerialNumber] = objectRecord.asInstance!! to gcRoot
        // 入列 NormalRootNode
        enqueue(NormalRootNode(gcRoot.id, gcRoot))
      }
      is JavaFrame -> {
        // Java 局部变量
        val threadPair = threadsBySerialNumber[gcRoot.threadSerialNumber]
        if (threadPair == null) {
          // Could not find the thread that this java frame is for.
          enqueue(NormalRootNode(gcRoot.id, gcRoot))
        } else {

          val (threadInstance, threadRoot) = threadPair
          val threadName = threadNames[threadInstance] ?: {
            val name = threadInstance[Thread::class, "name"]?.value?.readAsJavaString() ?: ""
            threadNames[threadInstance] = name
            name
          }()

          // RefreshceMatchers 用于匹配已知的引用节点
          // IgnoredReferenceMatcher 表示忽略这个引用节点
          // LibraryLeakReferenceMatcher 表示这是库内存泄露对象
          val referenceMatcher = threadNameReferenceMatchers[threadName]

          if (referenceMatcher !is IgnoredReferenceMatcher) {
            val rootNode = NormalRootNode(threadRoot.id, gcRoot)

            val refFromParentType = LOCAL
            val refFromParentName = ""

            val childNode = if (referenceMatcher is LibraryLeakReferenceMatcher) {
              LibraryLeakChildNode(
                  objectId = gcRoot.id,
                  parent = rootNode,
                  refFromParentType = refFromParentType,
                  refFromParentName = refFromParentName,
                  matcher = referenceMatcher
              )
            } else {
              NormalNode(
                  objectId = gcRoot.id,
                  parent = rootNode,
                  refFromParentType = refFromParentType,
                  refFromParentName = refFromParentName
              )
            }
            // 入列 LibraryLeakChildNode 或 NormalNode
            enqueue(childNode)
          }
        }
      }
      is JniGlobal -> {
       // Native 全局变量
        // 是否匹配已知引用节点
        val referenceMatcher = when (objectRecord) {
          is HeapClass -> jniGlobalReferenceMatchers[objectRecord.name]
          is HeapInstance -> jniGlobalReferenceMatchers[objectRecord.instanceClassName]
          is HeapObjectArray -> jniGlobalReferenceMatchers[objectRecord.arrayClassName]
          is HeapPrimitiveArray -> jniGlobalReferenceMatchers[objectRecord.arrayClassName]
        }
        if (referenceMatcher !is IgnoredReferenceMatcher) {
          if (referenceMatcher is LibraryLeakReferenceMatcher) {
          // 入列 LibraryLeakRootNode
            enqueue(LibraryLeakRootNode(gcRoot.id, gcRoot, referenceMatcher))
          } else {
          // 入列 NormalRootNode
            enqueue(NormalRootNode(gcRoot.id, gcRoot))
          }
        }
      }
      // 其他 GC Roots,入列 NormalRootNode
      else -> enqueue(NormalRootNode(gcRoot.id, gcRoot))
    }
  }
}
在将 GC Roots 节点入列的过程,有两个地方值得注意:
-
ReferenceMatcher
ReferenceMatcher用于匹配引用节点,判断是否要忽略它。LeakCanary 支持 4 种类型的匹配:-
类实例字段
缓存在
fieldNameByClassName里,例如,android.os.Message中的obj字段 -
类静态字段
缓存在
staticFieldNameByClassName里,例如,android.app.ActivityManager的mContext字段 -
指定线程
缓存在
threadNames里,例如,FinalizerWatchdogDaemon线程 -
Native 全局变量
缓存在
jniGlobals里,例如,android.widget.Toast\$TN类
内置的引用节点匹配为
AndroidReferenceMatchers.appDefaults。 -
-
VisitQueue
PathFinder中有两个队列,一个优先级更高的toVisitQueue,另外一个是toVisitLastQueue,同时提供toVisitSet和toVisitLastSet用于提供常数级查询。队列中的节点分为两种:
-
RootNode
根节点,它有两个实现类:
-
LibraryLeakRootNode
依赖库的泄露根节点
-
NormalRootNode
普通的根节点
-
-
ChildNode
子节点,可以通过
parent字段访问父节点。它有两个实现类:-
LibraryLeakChildNode
依赖库的泄露子节点
-
NormalNode
普通的字节点
-
以下 3 种情况会将节点放入到
toVisitLastQueue中:- LibraryLeakNode
- GC Root 为 ThreadObject
- 父节点的 GC Root 为 JavaFrame
因为这 3 种导致的内存泄露情况比较少,所以降低它们的访问优先级。
val visitLast = node is LibraryLeakNode || // We deprioritize thread objects because on Lollipop the thread local values are stored // as a field. (node is RootNode && node.gcRoot is ThreadObject) || (node is NormalNode && node.parent is RootNode && node.parent.gcRoot is JavaFrame) -
在将所有的 GC Roots 节点入列后,使用广度优先遍历所有的节点,当访问节点是泄露节点,则添加到 shortestPathsToLeakingObjects 中:
val shortestPathsToLeakingObjects = mutableListOf<ReferencePathNode>()
visitingQueue@ while (queuesNotEmpty) {
  val node = poll()

  if (checkSeen(node)) {
    throw IllegalStateException(
        "Node $node objectId=${node.objectId} should not be enqueued when already visited or enqueued"
    )
  }

  if (node.objectId in leakingObjectIds) {
    shortestPathsToLeakingObjects.add(node)
    // Found all refs, stop searching (unless computing retained size)
    if (shortestPathsToLeakingObjects.size == leakingObjectIds.size) {
      if (computeRetainedHeapSize) {
        listener.onAnalysisProgress(FINDING_DOMINATORS)
      } else {
        break@visitingQueue
      }
    }
  }

  when (val heapObject = graph.findObjectById(node.objectId)) {
    is HeapClass -> visitClassRecord(heapObject, node)
    is HeapInstance -> visitInstance(heapObject, node)
    is HeapObjectArray -> visitObjectArray(heapObject, node)
  }
}
在遍历子节点时,有 3 种情况需要考虑:
-
HeapClass
当节点表示 HeapClass,我们将它的静态变量入列:
val node = when (val referenceMatcher = ignoredStaticFields[fieldName]) { null -> NormalNode( objectId = objectId, parent = parent, refFromParentType = STATIC_FIELD, refFromParentName = fieldName ) is LibraryLeakReferenceMatcher -> LibraryLeakChildNode( objectId = objectId, parent = parent, refFromParentType = STATIC_FIELD, refFromParentName = fieldName, matcher = referenceMatcher ) // 忽略 IgnoredReferenceMatcher is IgnoredReferenceMatcher -> null } if (node != null) { enqueue(node) } -
HeapInstance
当节点表示 HeapInstance,我们将它的实例变量入列:
val fieldNamesAndValues = instance.readFields() .filter { it.value.isNonNullReference } .toMutableList() fieldNamesAndValues.sortBy { it.name } fieldNamesAndValues.forEach { field -> val objectId = field.value.asObjectId!! if (computeRetainedHeapSize) { updateDominatorWithSkips(parent.objectId, objectId) } val node = when (val referenceMatcher = fieldReferenceMatchers[field.name]) { null -> NormalNode( objectId = objectId, parent = parent, refFromParentType = INSTANCE_FIELD, refFromParentName = field.name ) is LibraryLeakReferenceMatcher -> LibraryLeakChildNode( objectId = objectId, parent = parent, refFromParentType = INSTANCE_FIELD, refFromParentName = field.name, matcher = referenceMatcher ) // 忽略 IgnoredReferenceMatcher is IgnoredReferenceMatcher -> null } if (node != null) { enqueue(node) } } -
HeapObjectArray
当节点表示 HeapObjectArray,我们将它的非空元素入列:
val nonNullElementIds = record.elementIds.filter { objectId ->
  objectId != ValueHolder.NULL_REFERENCE && graph.objectExists(objectId)
}
nonNullElementIds.forEachIndexed { index, elementId ->
  if (computeRetainedHeapSize) {
    updateDominatorWithSkips(parent.objectId, elementId)
  }
  val name = index.toString()
  enqueue(
      NormalNode(
          objectId = elementId,
          parent = parent,
          refFromParentType = ARRAY_ENTRY,
          refFromParentName = name
      )
  )
}
这里不需要考虑 HeapPrimitiveArray 的情况,因为原始类型不能导致内存泄露。
至此,我们通过调用 findPathsFromGcRoots() 方法将所有泄露对象的引用节点都查询出来了。
最短路径
在通过 findPathsFromGcRoots() 获取的节点中,一个泄露对象可能会有多个引用路径,所以我们还需要做一次遍历,找到每个泄露对象的最短路径(导致泄露的可能性最大)。
private fun deduplicateShortestPaths(inputPathResults: List<ReferencePathNode>): List<ReferencePathNode> {
  val rootTrieNode = ParentNode(0)

  for (pathNode in inputPathResults) {
    // Go through the linked list of nodes and build the reverse list of instances from
    // root to leaking.
    val path = mutableListOf<Long>()
    var leakNode: ReferencePathNode = pathNode
    while (leakNode is ChildNode) {
    	// 从父节点 -> 子节点
      path.add(0, leakNode.objectId)
      leakNode = leakNode.parent
    }
    path.add(0, leakNode.objectId)

    // 这里的作用是构建树
    updateTrie(pathNode, path, 0, rootTrieNode)
  }

  val outputPathResults = mutableListOf<ReferencePathNode>()
  findResultsInTrie(rootTrieNode, outputPathResults)
  return outputPathResults
}

private fun updateTrie(
  pathNode: ReferencePathNode,
  path: List<Long>,
  pathIndex: Int,
  parentNode: ParentNode
) {
  val objectId = path[pathIndex]
  if (pathIndex == path.lastIndex) {
    // 当前已经是叶子节点
    // 替换已存在的节点,当前路径更短
    parentNode.children[objectId] = LeafNode(objectId, pathNode)
  } else {
    val childNode = parentNode.children[objectId] ?: {
      val newChildNode = ParentNode(objectId)
      parentNode.children[objectId] = newChildNode
      newChildNode
    }()
    if (childNode is ParentNode) {
      // 递归更新
      updateTrie(pathNode, path, pathIndex + 1, childNode)
    }
  }
}
通过遍历泄露对象节点的父节点,构建出一棵树,多个相同泄露对象节点的不同路径,最终获取最短路径的树。多条最短路径(不同泄露对象)最终合并成一棵树。
生成 LeakTrace
从上面生成泄露对象路径 ReferencePathNode 到最终的 LeakTrace,这里只是又做了一层包装,比如通过 HeapGraph.findObjectById() 将 objectId 转成对应的 HeapObject:
  var node: ReferencePathNode = retainedObjectNode
  while (node is ChildNode) {
    shortestChildPath.add(0, node)
    pathHeapObjects.add(0, graph.findObjectById(node.objectId))
    node = node.parent
  }
  val rootNode = node as RootNode
  pathHeapObjects.add(0, graph.findObjectById(rootNode.objectId))
有两个地方需要注意下:
-
ObjectInspector
通过调用
ObjectInspector.inspect(),可以对每个ObjectReporter添加一些说明。例如,判断Activity对象是否泄露:override fun inspect( reporter: ObjectReporter ) { reporter.whenInstanceOf("android.app.Activity") { instance -> val field = instance["android.app.Activity", "mDestroyed"] if (field != null) { if (field.value.asBoolean!!) { leakingReasons += field describedWithValue "true" } else { notLeakingReasons += field describedWithValue "false" } } } }我们也可以通过
Config.objectInspectors添加自定义的ObjectInspector。 -
LeakingStatus
通过调用
HeapAnalyzer.computeLeakStatuses()来计算路径上每个节点的泄露状态:private fun computeLeakStatuses(leakReporters: List<ObjectReporter>): List<Pair<LeakingStatus, String>> { val lastElementIndex = leakReporters.size - 1 var lastNotLeakingElementIndex = -1 var firstLeakingElementIndex = lastElementIndex val leakStatuses = ArrayList<Pair<LeakingStatus, String>>() for ((index, reporter) in leakReporters.withIndex()) { // 通过判断是否存在 leakingReasons 来判断是否为泄露节点 val resolvedStatusPair = resolveStatus(reporter, leakingWins = index == lastElementIndex).let { statusPair -> if (index == lastElementIndex) { // 叶子节点肯定为泄露状态 when (statusPair.first) { LEAKING -> statusPair UNKNOWN -> LEAKING to "This is the leaking object" NOT_LEAKING -> LEAKING to "This is the leaking object. Conflicts with ${statusPair.second}" } } else statusPair } leakStatuses.add(resolvedStatusPair) val (leakStatus, _) = resolvedStatusPair // firstLeakingElementIndex 第一个泄露节点的下标 // lastNotLeakingElementIndex 最后一个非泄露节点的下标 if (leakStatus == NOT_LEAKING) { lastNotLeakingElementIndex = index // Reset firstLeakingElementIndex so that we never have // firstLeakingElementIndex < lastNotLeakingElementIndex firstLeakingElementIndex = lastElementIndex } else if (leakStatus == LEAKING && firstLeakingElementIndex == lastElementIndex) { firstLeakingElementIndex = index } } val simpleClassNames = leakReporters.map { reporter -> recordClassName(reporter.heapObject).lastSegment('.') } // lastNotLeakingElementIndex 之前节点不会是泄露状态 for (i in 0 until lastNotLeakingElementIndex) { val (leakStatus, leakStatusReason) = leakStatuses[i] val nextNotLeakingIndex = generateSequence(i + 1) { index -> if (index < lastNotLeakingElementIndex) index + 1 else null }.first { index -> leakStatuses[index].first == NOT_LEAKING } // Element is forced to NOT_LEAKING val nextNotLeakingName = simpleClassNames[nextNotLeakingIndex] leakStatuses[i] = when (leakStatus) { UNKNOWN -> NOT_LEAKING to "$nextNotLeakingName↓ is not leaking" NOT_LEAKING -> NOT_LEAKING to "$nextNotLeakingName↓ is not leaking and $leakStatusReason" LEAKING -> NOT_LEAKING to "$nextNotLeakingName↓ is not leaking. Conflicts with $leakStatusReason" } } // firstLeakingElementIndex 之后的节点为泄露状态 if (firstLeakingElementIndex < lastElementIndex - 1) { // We already know the status of firstLeakingElementIndex and lastElementIndex for (i in lastElementIndex - 1 downTo firstLeakingElementIndex + 1) { val (leakStatus, leakStatusReason) = leakStatuses[i] val previousLeakingIndex = generateSequence(i - 1) { index -> if (index > firstLeakingElementIndex) index - 1 else null }.first { index -> leakStatuses[index].first == LEAKING } // Element is forced to LEAKING val previousLeakingName = simpleClassNames[previousLeakingIndex] leakStatuses[i] = when (leakStatus) { UNKNOWN -> LEAKING to "$previousLeakingName↑ is leaking" LEAKING -> LEAKING to "$previousLeakingName↑ is leaking and $leakStatusReason" NOT_LEAKING -> throw IllegalStateException("Should never happen") } } } return leakStatuses }
小结
至此,我们已经把 HeapAnalyzerService.analyzeHeap() 方法分析完了,下面我们用时序图把这个调用关系再加深下印象:
UI 展现
在默认实现的 DefaultOnHeapAnalyzedListener 中,当前 hprof 文件分析成功后,会回调 onHeapAnalyzed() 方法:
override fun onHeapAnalyzed(heapAnalysis: HeapAnalysis) {
  // 入库
  val id = LeaksDbHelper(application).writableDatabase.use { db ->
    HeapAnalysisTable.insert(db, heapAnalysis)
  }

  val (contentTitle, screenToShow) = when (heapAnalysis) {
    is HeapAnalysisFailure -> application.getString(
        R.string.leak_canary_analysis_failed
    ) to HeapAnalysisFailureScreen(id)
    is HeapAnalysisSuccess -> {
      val retainedObjectCount = heapAnalysis.allLeaks.sumBy { it.leakTraces.size }
      val leakTypeCount = heapAnalysis.applicationLeaks.size + heapAnalysis.libraryLeaks.size
      application.getString(
          R.string.leak_canary_analysis_success_notification, retainedObjectCount, leakTypeCount
      ) to HeapDumpScreen(id)
    }
  }

  if (InternalLeakCanary.formFactor == TV) {
    showToast(heapAnalysis)
    printIntentInfo()
  } else {
    // 显示通知栏消息
    showNotification(screenToShow, contentTitle)
  }
}
当点击通知栏消息后,再跳转到 LeakActivity:
val pendingIntent = LeakActivity.createPendingIntent(
    application, arrayListOf(HeapDumpsScreen(), screenToShow)
)
总结
从源码把 LeakCanary 的核心流程分析下来,可以看到整个项目中,不管是模块的划分,代码的风格都是非常清晰,特别是用了 kotlin 重写后,具备了很多 Java 没有的语法糖,让代码的篇幅也非常精简。总的来说,这个是一个非常不错的学习项目。
