

本文从以下几个问题着手,分析内存泄漏的问题,以及检测内存泄漏的leakcanary的相关源码解析。
- 什么是内存泄漏
- 什么是JAVA垃圾回收机制
- 什么操作会导致泄漏
- leakcanary怎么检测到内存泄漏的
- leakcanary如何找到引用链
- 如何获取GC Root最短路径
首先探讨第一个问题:
一、什么是内存泄漏?
一句话概括就是:没有用的对象无法回收的现象就是内存泄露
android 系统为每个应用分配的内存是有限的,当一个对象已经不需要再使用了,本该被回收时,而有另外一个正在使用的对象持有它的引用从而导致它不能被回收,这导致本该被回收的对象不能被回收而停留在堆内存中,这就产生了内存泄漏
堆内存引申:JVM内存模型
- 模型
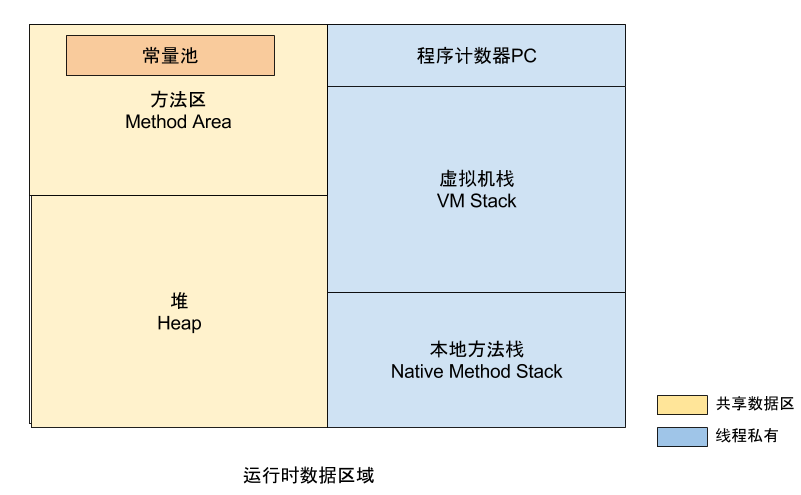
粗浅的概念:堆与栈,实际情况要复杂的多,下面给出一张图来表示
主要详解:
1.1 虚拟机栈要点:
- 这个区域就是我们平时说的堆栈中的栈
- 线程私有的,与线程的声明周期相同
- 每个java方法被执行的时候,这个区域都会产生一个栈帧
- 栈帧中存放的局部变量有8种基本数据类型以及引用类型
- java方法运行的过程就是栈帧在虚拟机栈中入栈和出栈的过程
- 当线程请求的栈的深度超出了虚拟机允许的深度时,会抛出StackOverFlow的错误
- 当Java虚拟机动态扩展到无法申请足够内存时会抛出OutOfMemory的错误
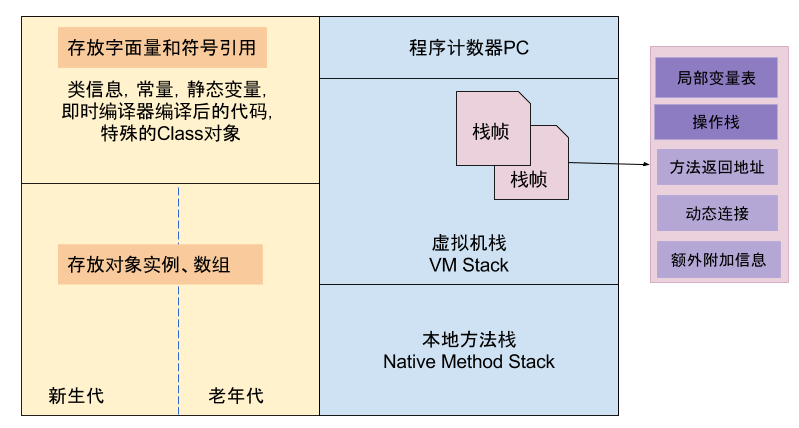
1.2 Java堆要点:
- 性能优化主要针对这部分内存,GC的主要操作场所,存放所有对象实例和数组数据
- Java堆属于线程共享区域,所有的线程共享这一块内存区域
- 从内存回收角度,Java堆可被分为新生代和老年代,这样分能够更快的回收内存,下面会详细介绍新生代、老年代
- 从内存分配角度,Java堆可划分出线程私有的分配缓存区(Thread Local Allocation Buffer,TLAB),这样能够更快的分配内存
- 当Java虚拟机动态扩展到无法申请足够内存时会抛出OutOfMemory的错误
1.3 方法区:
方法区主要存放的是已被虚拟机加载的类信息、常量、静态变量、编译器编译后的代码等数据。GC在该区域出现的比较少
1.4 运行时常量池:
运行时常量池也是方法区的一部分,用于存放编译器生成的各种字面量和符号引用。
讲到回收对象那么就引出了第二个问题:
二、什么是JAVA垃圾回收机制?
前面说过堆内存的特点是“进程独立,线程共享”。换句话说,每个JVM实例都拥有它们自己的Heap空间,从而保证了程序间的安全性,不过需要注意的是进程内部的各个线程会共享一个堆空间的情况下的代码同步问题。
JAVA相较其他语言的一个重要区别就是它具备垃圾自动回收功能——这同时也是堆内存管理系统最关键的一个功能。随着JVM的不断更新换代,其所支持的垃圾回收算法也在不停地推陈出新。这里就简述下最流行的算法之一,即“分代垃圾回收”算法
分代垃圾回收算法
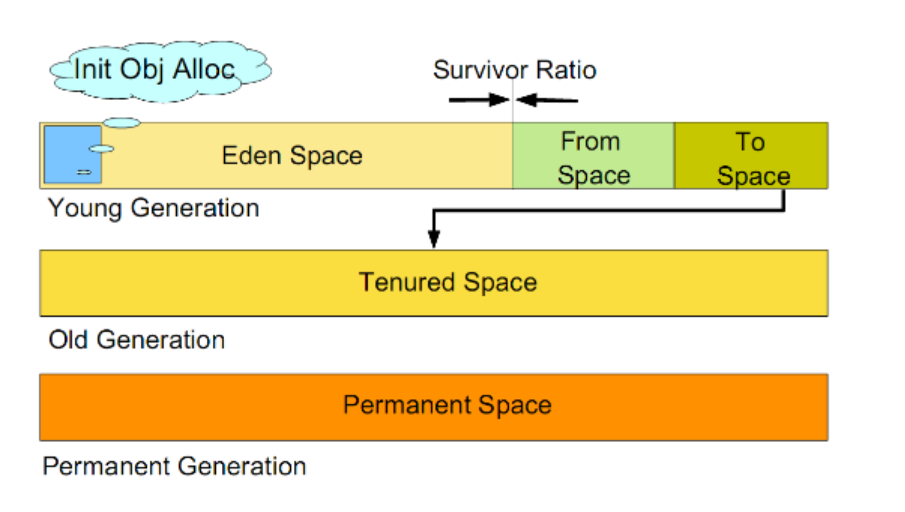
简而言之,分代回收机制会将内存划分为如下“三代”来区别管理:
- Yong Generation 即年轻代内存,又可以分成eden/s0/s1三种,其后2者也被称之为“from space”和“to space”。所有新生成的对象首先都是放在年轻代的。年轻代的目标就是尽可能快速的收集掉那些生命周期短的对象
- Old Generation 老年代内存又被称之为“Tenured Space”,在年轻代中经历了N次垃圾回收后仍然存活的对象,就会被放到年老代中。因此,可以认为年老代中存放的都是一些生命周期较长的对象。
- Permanent Generation 永久代内存,用于存储和类、方法相关的Meta Data,并不属于Heap的范畴,在某些情况下可以不予以考虑
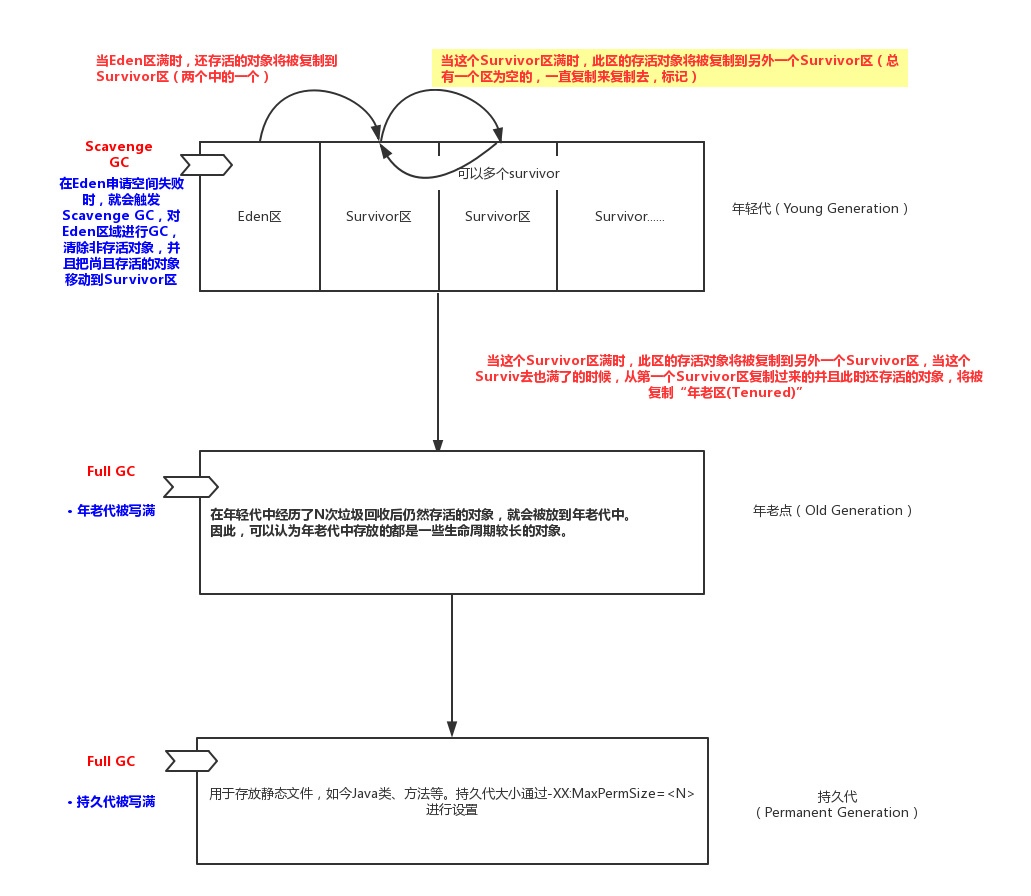
工作流程:
JVM对于不同代中的内存锁采用的垃圾回收算法也是有区别的。
- 所有内存空间申请请求首先考虑从“Eden”区分配。
- 新生代内存按照8:1:1的比例分为一个eden区和两个survivor(survivor0,survivor1)区。一个Eden区,两个 Survivor区(一般而言)。大部分对象在Eden区中生成。回收时先将eden区存活对象复制到一个survivor0区,然后清空eden区,当这个survivor0区也存放满了时,则将eden区和survivor0区存活对象复制到另一个survivor1区,然后清空eden和这个survivor0区,此时survivor0区是空的,然后将survivor0区和survivor1区交换,即保持survivor1区为空, 如此往复。
- 当survivor1区不足以存放 eden和survivor0的存活对象时,就将存活对象直接存放到老年代。若是老年代也满了就会触发一次Full GC,也就是新生代、老年代都进行回收
何为GC?
垃圾回收机制是由垃圾收集器Garbage Collection GC来实现的,GC是后台的守护进程。它的特别之处是它是一个低优先级进程,但是可以根据内存的使用情况动态的调整他的优先级。因此,它是在内存中低到一定限度时才会自动运行,从而实现对内存的回收。这就是垃圾回收的时间不确定的原因。
为何要这样设计:因为GC也是进程,也要消耗CPU等资源,如果GC执行过于频繁会对java的程序的执行产生较大的影响(java解释器本来就不快),因此JVM的设计者们选着了不定期的gc。
GC的根节点是什么?
每个应用程序都包含一组根(root)。每个根都是一个存储位置,其中包含指向引用类型对象的一个指针。该指针要么引用托管堆中的一个对象,要么为null。
在应用程序中,只要某对象变得不可达,也就是没有根(root)引用该对象,这个对象就会成为垃圾回收器的目标。
接下来看看哪些操作会造成内存泄漏,以及处理办法:
三、什么操作会导致泄漏
可以简单的做如下归类:
- 长期持有(Activity)Context导致
- 忘记注销监听器或者观察者
- 由非静态内部类导致的
例子
- 长时间持有Activity实例
比如我们有一个叫做AppSettings的类,它是一个单例模式
public class AppSettings {
    private Context mAppContext;
    private static AppSettings sInstance = new AppSettings();

    //some other codes
    public static AppSettings getInstance() {
        return sInstance;
    }

    public final void setup(Context context) {
        mAppContext = context;
    }
}
当我们传入Activity作为Context参数时,AppSettings实例会持有这个Activity的实例。 又当我们旋转设备时,Android系统会销毁当前的Activity,创建新的Activity来加载合适的布局。如果出现Activity被单例实例持有,那么旋转过程中的旧Activity无法被销毁掉。就发生了内存泄漏。
解决办法:
那就是使用Application的Context对象,因为它和AppSettings实例具有相同的生命周期。这里是通过使用Context.getApplicationContext()方法来实现。
- 忘记反注册监听器
在Android中我们会使用很多listener,observer。这些都是作为观察者模式的实现。当我们注册一个listener时,这个listener的实例会被Activity所引用。如果listener的生命周期要明显大于Activity,那么就有可能发生内存泄漏。
public class MainActivity extends AppCompatActivity implements OnNetworkChangedListener {

    @Override
    protected void onCreate(Bundle savedInstanceState) {
        super.onCreate(savedInstanceState);
        setContentView(R.layout.activity_main);
        NetworkManager.getInstance().registerListener(this);
    }

    @Override
    public void onNetworkUp() {

    }

    @Override
    public void onNetworkDown() {

    }
}
解决办法: 在Activity onDestroy()时调用unregisterListener方法,解绑。
- 非静态内部类导致的内存泄漏
见下面的代码:
public class MainActivity extends AppCompatActivity
{
	private static Leak leak;
	@Override
	protected void onCreate( @Nullable Bundle savedInstanceState )
	{
		super.onCreate( savedInstanceState );
		setContentView( R.layout.activity_main );
		leak = new Leak();
	}

	private class Leak{

	}
}
非静态内部类会默认持有外部类的引用,当MainActivity销毁重建后由于其内部类Leak持有了它的引用,并且Leak是静态的,生命周期和应用一样长,因此导致LeakActivity无法被销毁,因此一直存在于内存中。 要销毁MainActivity,必须先销毁leak,但是要销毁mLeak,必须先销毁LeakActivity,所以一个也不能销毁。就造成了内存泄漏。
通过反编译后就能清楚的看出来了
解决办法: 1.及时销毁 2.放到Application中
下面主要分析下内存泄漏检测工具leakcanary
四、leakcanary怎么检测到内存泄漏的
引入方法,只需下面两步:
debugImplementation 'com.squareup.leakcanary:leakcanary-android:1.6.3'
releaseImplementation 'com.squareup.leakcanary:leakcanary-android-no-op:1.6.3'

public class StudyApplication extends Application
{
	@Override
	public void onCreate()
	{
		super.onCreate();
		if( LeakCanary.isInAnalyzerProcess( this ) )
		{
			return;
		}
		LeakCanary.install( this );
	}
}
从LeakCanary.install( this );开始
/**
   * Creates a {@link RefWatcher} that works out of the box, and starts watching activity
   * references (on ICS+).
   */
  public static @NonNull RefWatcher install(@NonNull Application application) {
    return refWatcher(application).listenerServiceClass(DisplayLeakService.class)
        .excludedRefs(AndroidExcludedRefs.createAppDefaults().build())
        .buildAndInstall();
  }
- 第一步
refWatcher(application)创建AndroidRefWatcherBuilder对象 - 第二步
listenerServiceClass(DisplayLeakService.class)创建解析内存泄漏信息的服务,这里也可以传递继承AbstractAnalysisResultService的自定义对象,用于上传内存泄漏信息 - 第三步
excludedRefs(AndroidExcludedRefs.createAppDefaults().build())设置过滤,过滤掉安卓系统本身出现的内存泄漏现象,只保留用户app出现的内存泄漏 - 第四步
buildAndInstall()构造RefWatcher对象,并返回
public @NonNull RefWatcher buildAndInstall() {
    ...
    RefWatcher refWatcher = build();
    if (refWatcher != DISABLED) {
      ...
      if (watchActivities) {
        ActivityRefWatcher.install(context, refWatcher);
      }
      if (watchFragments) {
        FragmentRefWatcher.Helper.install(context, refWatcher);
      }
    }
    ...
    return refWatcher;
  }
这里有2个重要的操作build();,ActivityRefWatcher.install(context, refWatcher);第一个方法用于生成RefWatcher
它是用来监控引用的工具,第二个方法,创建了ActivityRefWatcher,这个就是用来监控Activity泄漏状况的其中:
 public static void install(@NonNull Context context, @NonNull RefWatcher refWatcher) {
    Application application = (Application) context.getApplicationContext();
    ActivityRefWatcher activityRefWatcher = new ActivityRefWatcher(application, refWatcher);

    application.registerActivityLifecycleCallbacks(activityRefWatcher.lifecycleCallbacks);
  }
监控的远离就是在application中注册了一个ActivitylifecycleCallbacks的回调函数,用来监听Application整个生命周期中所有Activity的lifecycle事件。而这个lifecycleCallbacks,就是
private final Application.ActivityLifecycleCallbacks lifecycleCallbacks =
    new ActivityLifecycleCallbacksAdapter() {
    @Override public void onActivityDestroyed(Activity activity) {
      refWatcher.watch(activity);
    }
};
public abstract class ActivityLifecycleCallbacksAdapter
    implements Application.ActivityLifecycleCallbacks {
  @Override public void onActivityCreated(Activity activity, Bundle savedInstanceState) {
  }

  @Override public void onActivityStarted(Activity activity) {
  }

  @Override public void onActivityResumed(Activity activity) {
  }

  @Override public void onActivityPaused(Activity activity) {
  }

  @Override public void onActivityStopped(Activity activity) {
  }

  @Override public void onActivitySaveInstanceState(Activity activity, Bundle outState) {
  }

  @Override public void onActivityDestroyed(Activity activity) {
  }
}
它只监听了所有Activity的onActivityDestroyed事件,当Activity被destroy时,调用refWatcher.watch(activity);函数,将目标activity对象传递到RefWatcher,让它去监控这个activity是否被回收了,如果没有被回收,则发生了内存泄漏事件。
深入refWatcher.watch(activity)方法
  public void watch(Object watchedReference, String referenceName) {
    if (this == DISABLED) {
      return;
    }
    checkNotNull(watchedReference, "watchedReference");
    checkNotNull(referenceName, "referenceName");
    final long watchStartNanoTime = System.nanoTime();
    String key = UUID.randomUUID().toString();
    retainedKeys.add(key);
    final KeyedWeakReference reference =
        new KeyedWeakReference(watchedReference, key, referenceName, queue);

    ensureGoneAsync(watchStartNanoTime, reference);
  }
checkNotNull(watchedReference, "watchedReference")判断watchedReference是否为空,如果为空,就不需要继续进行下去了,接下来是构造了一个唯一key,并传入retainedKeys中,我们想要观测的activity对应的唯一key都会存放到集合里面,之后把我们传入的activity包装成一个KeyedWeakReference(可以当作WeakReference),然后执行ensureGoneAsync这个方法最后会执行一个Runnable,调用ensureGone(reference, watchStartNanoTime);
我们知道watch函数本身就是用来监听activity是否被回收掉了,这就涉及到两个问题:
- 何时检查它是否回收?
- 如何有效检查它真的被回收了
对于这个ensureGone(reference, watchStartNanoTime);函数它做的事情就是确保reference被回收掉了,否则就意味着内存泄漏
 private void ensureGoneAsync(final long watchStartNanoTime, final KeyedWeakReference reference) {
    watchExecutor.execute(new Retryable() {
      @Override public Retryable.Result run() {
        return ensureGone(reference, watchStartNanoTime);
      }
    });
  }
这个watchExecutor在LeakCanary中是AndroidWatchExecutor的实例,调用它的execute方法实际上就是向主线程的消息队列中插入了一个IdleHandler消息,这个消息只有在对应的消息队列为空的时候才会去执行,因此RefWatcher的watch方法就保证了在主线程空闲的时候才会去执行ensureGone方法,防止因为内存泄漏检查任务而严重影响应用的正常执行.
在说下面之前,先解释下WeakReference和ReferenceQueue的工作原理
-
弱引用WeakReference 被强引用的对象就算发生 OOM 也永远不会被垃圾回收机回收;被弱引用的对象,只要被垃圾回收器发现就会立即被回收;被软引用的对象,具备内存敏感性,只有内存不足时才会被回收,常用来做内存敏感缓存器;虚引用则任意时刻都可能被回收,使用较少。
-
引用队列 ReferenceQueue 我们常用一个 WeakReference reference = new WeakReference(activity);,这里我们创建了一个 reference 来弱引用到某个 activity,当这个 activity 被垃圾回收器回收后,这个 reference 会被放入内部的 ReferenceQueue 中。也就是说,从队列 ReferenceQueue 取出来的所有 reference,它们指向的真实对象都已经成功被回收了。
探究ensureGone(reference, watchStartNanoTime)检测回收方法
先看实现的代码:
@SuppressWarnings("ReferenceEquality") // Explicitly checking for named null.
  Retryable.Result ensureGone(final KeyedWeakReference reference, final long watchStartNanoTime) {
    long gcStartNanoTime = System.nanoTime();
    long watchDurationMs = NANOSECONDS.toMillis(gcStartNanoTime - watchStartNanoTime);

    removeWeaklyReachableReferences();

    // 如果正在debug断点调试,则延迟执行检查(因为断点会影响准确性)
    if (debuggerControl.isDebuggerAttached()) {
      // The debugger can create false leaks.
      return RETRY;
    }

    if (gone(reference)) {
      return DONE;
    }
    // 如果没有被回收,则触发一次GC
    gcTrigger.runGc();
    // 再次将已回收的对象对应的key从retainedKeys中移除
    removeWeaklyReachableReferences();
    if (!gone(reference)) {
      long startDumpHeap = System.nanoTime();
      long gcDurationMs = NANOSECONDS.toMillis(startDumpHeap - gcStartNanoTime);

      // 获取堆内存镜像文件
      File heapDumpFile = heapDumper.dumpHeap();
      if (heapDumpFile == RETRY_LATER) {
        // Could not dump the heap.
        return RETRY;
      }
      long heapDumpDurationMs = NANOSECONDS.toMillis(System.nanoTime() - startDumpHeap);

      HeapDump heapDump = heapDumpBuilder.heapDumpFile(heapDumpFile).referenceKey(reference.key)
          .referenceName(reference.name)
          .watchDurationMs(watchDurationMs)
          .gcDurationMs(gcDurationMs)
          .heapDumpDurationMs(heapDumpDurationMs)
          .build();

      heapdumpListener.analyze(heapDump);
    }
    return DONE;
  }
基于我们对ReferenceQueue的了解,只要把队列中所有的reference取出来,并把对应的retainedKeys 里的 key 移除,剩下的 key 对应的对象都没有被回收。
具体步骤就是:
- 调用
removeWeaklyReachableReferences();把已被回收的对象key从retainedKeys中移除,剩下的key都是未被回收的对象 if (gone(reference))来判断某个reference的key是否还在retainedKey集合中,若不在,表示以及被回收了,否则继续gcTrigger.runGc();手动触发gc,立即把所有WeakReference 引用的对象回收removeWeaklyReachableReferences();再次清理retainedKeys,如果该 reference 还在 retainedKeys 里(if (!gone(reference))),表示泄漏- 调用
heapDumper.dumpHeap()将内存情况dump成文件,并发送Notification,以及Toast - 将文件以及reference.key等其他信息封装成HeapDump对象,并调用
heapdumpListener.analyze(heapDump);进行分析
至此Leakcanary检测到内存泄漏的流程就看完了。
小结
- 利用 application.registerActivityLifecycleCallbacks(lifecycleCallbacks) 来监听整个生命周期内的 Activity onDestoryed 事件
- 某个 Activity 被 destory 后,将它传给 RefWatcher 去做观测,确保其后续会被正常回收;
- RefWatcher 首先把 Activity 使用 KeyedWeakReference 引用起来,并使用一个 ReferenceQueue 来记录该 KeyedWeakReference 指向的对象是否已被回收;
- AndroidWatchExecutor 会在 5s 后,开始检查这个弱引用内的 Activity 是否被正常回收。判断条件是:若 Activity 被正常回收,那么引用它的 KeyedWeakReference 会被自动放入 ReferenceQueue 中。
- 判断方式是:先看 Activity 对应的 KeyedWeakReference 是否已经放入 ReferenceQueue 中;如果没有,则手动 GC:gcTrigger.runGc();;然后再一次判断 ReferenceQueue 是否已经含有对应的 KeyedWeakReference。若还未被回收,则认为可能发生内存泄漏。
五、leakcanary如何找到引用链
现在来主要看下调用heapdumpListener.analyze(heapDump);后进行的分析
  @Override public void analyze(@NonNull HeapDump heapDump) {
    checkNotNull(heapDump, "heapDump");
    HeapAnalyzerService.runAnalysis(context, heapDump, listenerServiceClass);
  }
这个方法最后调用HeapAnalyzerService.runAnalysis(context, heapDump, listenerServiceClass);进行分析,传递的参数context,heapDump,以及分析完毕后的回调类。HeapAnalyzerService继承自ForegroundService用于分析,并运行在另一个独立进程中,而runAnalysis方法最后调用ContextCompat.startForegroundService(context, intent);来启动这个service
在service启动后调用onHandleIntentInForeground方法
 @Override protected void onHandleIntentInForeground(@Nullable Intent intent) {
    if (intent == null) {
      CanaryLog.d("HeapAnalyzerService received a null intent, ignoring.");
      return;
    }
    String listenerClassName = intent.getStringExtra(LISTENER_CLASS_EXTRA);
    HeapDump heapDump = (HeapDump) intent.getSerializableExtra(HEAPDUMP_EXTRA);

    HeapAnalyzer heapAnalyzer =
        new HeapAnalyzer(heapDump.excludedRefs, this, heapDump.reachabilityInspectorClasses);

    AnalysisResult result = heapAnalyzer.checkForLeak(heapDump.heapDumpFile, heapDump.referenceKey,
        heapDump.computeRetainedHeapSize);
    AbstractAnalysisResultService.sendResultToListener(this, listenerClassName, heapDump, result);
  }
这里分析内存的主要操作在HeapAnalyzer当中,分析完成后获取内存泄漏点以及引用链
AbstractAnalysisResultService.sendResultToListener(this, listenerClassName, heapDump, result);获取结果后,进行回调,回调给之前设置的listenerClassName的那个类,也可以是开发者自己继承的自定义类。
深入heapAnalyzer.checkForLeak()方法进行内存分析
  public @NonNull AnalysisResult checkForLeak(@NonNull File heapDumpFile,
      @NonNull String referenceKey,
      boolean computeRetainedSize) {
   ...
    try {
      listener.onProgressUpdate(READING_HEAP_DUMP_FILE);
      HprofBuffer buffer = new MemoryMappedFileBuffer(heapDumpFile);
      HprofParser parser = new HprofParser(buffer);
      listener.onProgressUpdate(PARSING_HEAP_DUMP);
      Snapshot snapshot = parser.parse();
      listener.onProgressUpdate(DEDUPLICATING_GC_ROOTS);
      // 从内存镜像中获取所有的GC Roots,并将它们添加到一个集合中
      deduplicateGcRoots(snapshot);
      listener.onProgressUpdate(FINDING_LEAKING_REF);
       // 使用反射,通过key找到泄露的对象实例
      Instance leakingRef = findLeakingReference(referenceKey, snapshot);

      // False alarm, weak reference was cleared in between key check and heap dump.
      if (leakingRef == null) {
        String className = leakingRef.getClassObj().getClassName();
        return noLeak(className, since(analysisStartNanoTime));
      }
      //查找泄露路径
      return findLeakTrace(analysisStartNanoTime, snapshot, leakingRef, computeRetainedSize);
    } catch (Throwable e) {
      return failure(e, since(analysisStartNanoTime));
    }
  }
这个方法第一步就是利用Haha库将之前dump出来的内存文件解析成Snapshot对象,其中调用到的方法包括SnapshotFactory的parse和HprofIndexBuilder的fill方法。。解析得到的Snapshot对象直观上和我们使用MAT进行内存分析时候罗列出内存中各个对象的结构很相似,它通过对象之间的引用链关系构成了一棵树,我们可以在这个树种查询到各个对象的信息,包括它的Class对象信息、内存地址、持有的引用及被持有的引用关系等。
之后LeakCanary就需要在Snapshot中找到一条有效的到被泄漏对象之间的引用路径。首先它调用findLeakingReference方法来从Snapshot中找到被泄漏对象 重要的方法有2个
findLeakingReference(referenceKey, snapshot);获取内存泄漏实例findLeakTrace(analysisStartNanoTime, snapshot, leakingRef, computeRetainedSize);分析对应的引用链
先来看第一个findLeakingReference
private Instance findLeakingReference(String key, Snapshot snapshot) {
    ClassObj refClass = snapshot.findClass(KeyedWeakReference.class.getName());
    if (refClass == null) {
      throw new IllegalStateException(
          "Could not find the " + KeyedWeakReference.class.getName() + " class in the heap dump.");
    }
    List<String> keysFound = new ArrayList<>();
    for (Instance instance : refClass.getInstancesList()) {
      List<ClassInstance.FieldValue> values = classInstanceValues(instance);
      Object keyFieldValue = fieldValue(values, "key");
      if (keyFieldValue == null) {
        keysFound.add(null);
        continue;
      }
      String keyCandidate = asString(keyFieldValue);
      if (keyCandidate.equals(key)) {//匹配key
        return fieldValue(values, "referent");//定位泄漏对象
      }
      keysFound.add(keyCandidate);
    }
    throw new IllegalStateException(
        "Could not find weak reference with key " + key + " in " + keysFound);
  }
为了能够准确找到被泄漏对象,LeakCanary通过被泄漏对象的弱引用来在Snapshot中定位它。因为,如果一个对象被泄漏,一定也可以在内存中找到这个对象的弱引用,再通过弱引用对象的referent就可以直接定位被泄漏对象。
六、如何获取GC Root最短路径
上面的方法实现了内存泄漏的实例查找。下一步的工作就是找到一条有效的到被泄漏对象的最短的引用,这通过findLeakTrace来实现,其代码如下
private AnalysisResult findLeakTrace(long analysisStartNanoTime, Snapshot snapshot,
      Instance leakingRef, boolean computeRetainedSize) {

    listener.onProgressUpdate(FINDING_SHORTEST_PATH);
    ShortestPathFinder pathFinder = new ShortestPathFinder(excludedRefs);
    ShortestPathFinder.Result result = pathFinder.findPath(snapshot, leakingRef);

    String className = leakingRef.getClassObj().getClassName();

    // False alarm, no strong reference path to GC Roots.
    if (result.leakingNode == null) {
      return noLeak(className, since(analysisStartNanoTime));
    }

    listener.onProgressUpdate(BUILDING_LEAK_TRACE);
    // 根据查找的结果,建立泄露路径
    LeakTrace leakTrace = buildLeakTrace(result.leakingNode);

    long retainedSize;
    if (computeRetainedSize) {

      listener.onProgressUpdate(COMPUTING_DOMINATORS);
      // Side effect: computes retained size.
      snapshot.computeDominators();

      Instance leakingInstance = result.leakingNode.instance;

      retainedSize = leakingInstance.getTotalRetainedSize();

      // TODO: check O sources and see what happened to android.graphics.Bitmap.mBuffer
      if (SDK_INT <= N_MR1) {
        listener.onProgressUpdate(COMPUTING_BITMAP_SIZE);
        retainedSize += computeIgnoredBitmapRetainedSize(snapshot, leakingInstance);
      }
    } else {
      retainedSize = AnalysisResult.RETAINED_HEAP_SKIPPED;
    }

    return leakDetected(result.excludingKnownLeaks, className, leakTrace, retainedSize,
        since(analysisStartNanoTime));
  }
此方法中pathFinder.findPath(snapshot, leakingRef);用于获取最短GC ROOT路径,第一个参数是带有所有信息的snapshot对象,第二个参数是内存泄漏的那个类的封装对象,使用算法广度优先搜索法
findLeakTrace 方法总体的逻辑就是
- 建立内存泄漏点到 GC Roots 的最短引用链
- 计算整个内存泄漏的大小 retained size
- 构建 LeakTrace
- 构建 AnalysisResult 具体代码如下:
Result findPath(Snapshot snapshot, Instance leakingRef) {
    clearState();
    canIgnoreStrings = !isString(leakingRef);
    // 将上面找到的所有GC Roots添加到队列中
    enqueueGcRoots(snapshot);

    boolean excludingKnownLeaks = false;
    LeakNode leakingNode = null;
    // 如果将从GC Root开始的所有引用看做树,则这里就可以理解成使用广度优先搜索遍历引用“森林”
    // 如果将所有的引用都看做是长度为1的Edge,那么这些引用就组成了一幅有向图,
    // 这里就是使用类似Dijkstra算法的方法来寻找最短路径,越在队列后面的,距离GC Roots越远
    while (!toVisitQueue.isEmpty() || !toVisitIfNoPathQueue.isEmpty()) {
      LeakNode node;
        // 如果toVisitQueue中没有元素,则取toVisitIfNoPathQueue中的元素
        // 意思就是,如果遍历完了toVisitQueue还没有找到泄露的路径,那么就继续遍历设置了“例外”的那些对象
        // “例外”是什么情况?在后续两个方法会讲到。
      if (!toVisitQueue.isEmpty()) {
        node = toVisitQueue.poll();
      } else {
        node = toVisitIfNoPathQueue.poll();
        if (node.exclusion == null) {
          throw new IllegalStateException("Expected node to have an exclusion " + node);
        }
        excludingKnownLeaks = true;
      }

      // Termination
      if (node.instance == leakingRef) {
        leakingNode = node;
        break;
      }

      // 因为一个对象可以被多个对象引用,以GC Root为根的引用树
      // 并不是严格意义上的树,所以如果已经遍历过当前对象,就跳过
      if (checkSeen(node)) {
        continue;
      }
      // 下面是根据当前引用节点的类型,分别找到它们所引用的对象
      if (node.instance instanceof RootObj) {
        visitRootObj(node);
      } else if (node.instance instanceof ClassObj) {
        visitClassObj(node);
      } else if (node.instance instanceof ClassInstance) {
        visitClassInstance(node);
      } else if (node.instance instanceof ArrayInstance) {
        visitArrayInstance(node);
      } else {
        throw new IllegalStateException("Unexpected type for " + node.instance);
      }
    }
    // 返回查找结果
    return new Result(leakingNode, excludingKnownLeaks);
  }
其中enqueueGcRoots(snapshot);会遍历获取所有的GCROOT并放入搜索队列中
while (!toVisitQueue.isEmpty() || !toVisitIfNoPathQueue.isEmpty())循环条件优先找toVisitQueue队列,找完在找toVisitIfNoPathQueue队列,而路径中包含toVisitIfNoPathQueue里的元素则标示excludingKnownLeaks为true
为了说明excludingKnownLeaks,以visitClassInstance(node);代码为例
private void visitClassInstance(LeakNode node) {
  ClassInstance classInstance = (ClassInstance) node.instance;
  Map<String, Exclusion> ignoredFields = new LinkedHashMap<>();
  ClassObj superClassObj = classInstance.getClassObj();
  Exclusion classExclusion = null;
  // 将设置了“例外”的对象记录下来
  // 这里的“例外”就是上一个方法中提到的“例外”。是指那些低优先级的,或者说几乎不可能引发内存泄露的对象
  // 例如SDK中的一些对象,诸如Message, InputMethodManager等,一般情况下,这些对象都不会导致内存泄露。
  // 因此只有在遍历了其他对象之后,找不到泄露路径的情况下,才遍历这些对象。
  while (superClassObj != null) {
    Exclusion params = excludedRefs.classNames.get(superClassObj.getClassName());
    if (params != null) {
      // true overrides null or false.
      // 如果当前类或者其父类被设置了“例外”,则将其赋值给classExclusion
      if (classExclusion == null || !classExclusion.alwaysExclude) {
        classExclusion = params;
      }
    }

    // 如果当前类及其父类包含例外的成员,将这些成员添加到ignoredFields中
    Map<String, Exclusion> classIgnoredFields =
        excludedRefs.fieldNameByClassName.get(superClassObj.getClassName());
    if (classIgnoredFields != null) {
      ignoredFields.putAll(classIgnoredFields);
    }
    superClassObj = superClassObj.getSuperClassObj();
  }

  if (classExclusion != null && classExclusion.alwaysExclude) {
    return;
  }

  // 遍历每一个成员
  for (ClassInstance.FieldValue fieldValue : classInstance.getValues()) {
    Exclusion fieldExclusion = classExclusion;
    Field field = fieldValue.getField();
    // 如果成员不是对象,则忽略
    if (field.getType() != Type.OBJECT) {
      continue;
    }
    // 获取成员实例
    Instance child = (Instance) fieldValue.getValue();
    String fieldName = field.getName();
    Exclusion params = ignoredFields.get(fieldName);
    // 如果当前成员对象是例外的,并且当前类和所有父类都不是例外的(classExclusion = null),
    // 或,如果当前成员对象时例外的,而且是alwaysExclude,而且当前类和父类都不是alwaysExclude
    // 则认为当前成员是需要例外处理的。
    // 这个逻辑很绕,实际上“||”后面的判断是不需要的,具体在enqueue方法中讲。
    if (params != null && (fieldExclusion == null || (params.alwaysExclude
        && !fieldExclusion.alwaysExclude))) {
      fieldExclusion = params;
    }

    // 入队列
    enqueue(fieldExclusion, node, child, fieldName, INSTANCE_FIELD);
  }
}
再看下enqueue()方法
private void enqueue(Exclusion exclusion, LeakNode parent, Instance child, String referenceName,
    LeakTraceElement.Type referenceType) {
  if (child == null) {
    return;
  }
  if (isPrimitiveOrWrapperArray(child) || isPrimitiveWrapper(child)) {
    return;
  }
  // Whether we want to visit now or later, we should skip if this is already to visit.
  if (toVisitSet.contains(child)) {
    return;
  }

  // 这个exclusion就是上一个方法通过“很绕的”逻辑判断的出来的
  // 这里的作用就是如果为null则visitNow,这个boolean值在下面会用到。
  // 可以看到这里只是判断exclusion是否为null,并没有使用到alwaysExclude参数,
  // 所以说上一个方法中,“||”之后的判断是没有必要的。
  boolean visitNow = exclusion == null;
  if (!visitNow && toVisitIfNoPathSet.contains(child)) {
    return;
  }
  if (canIgnoreStrings && isString(child)) {
    return;
  }
  if (visitedSet.contains(child)) {
    return;
  }
  LeakNode childNode = new LeakNode(exclusion, child, parent, referenceName, referenceType);
  // 这里用到了boolean值visitNow,就是说如果exclusion对象为null,则表示这不是一个例外的对象(暂且称之为常规对象);
  // 如果exclusion对象不为null,则表示这个对象是例外对象,只有在遍历所有常规对象之后,还是找不到路径的情况下才会被遍历。
  if (visitNow) {
    toVisitSet.add(child);
    toVisitQueue.add(childNode);
  } else {
    toVisitIfNoPathSet.add(child);
    toVisitIfNoPathQueue.add(childNode);
  }
}
查找最短强引用路径的流程如下图:
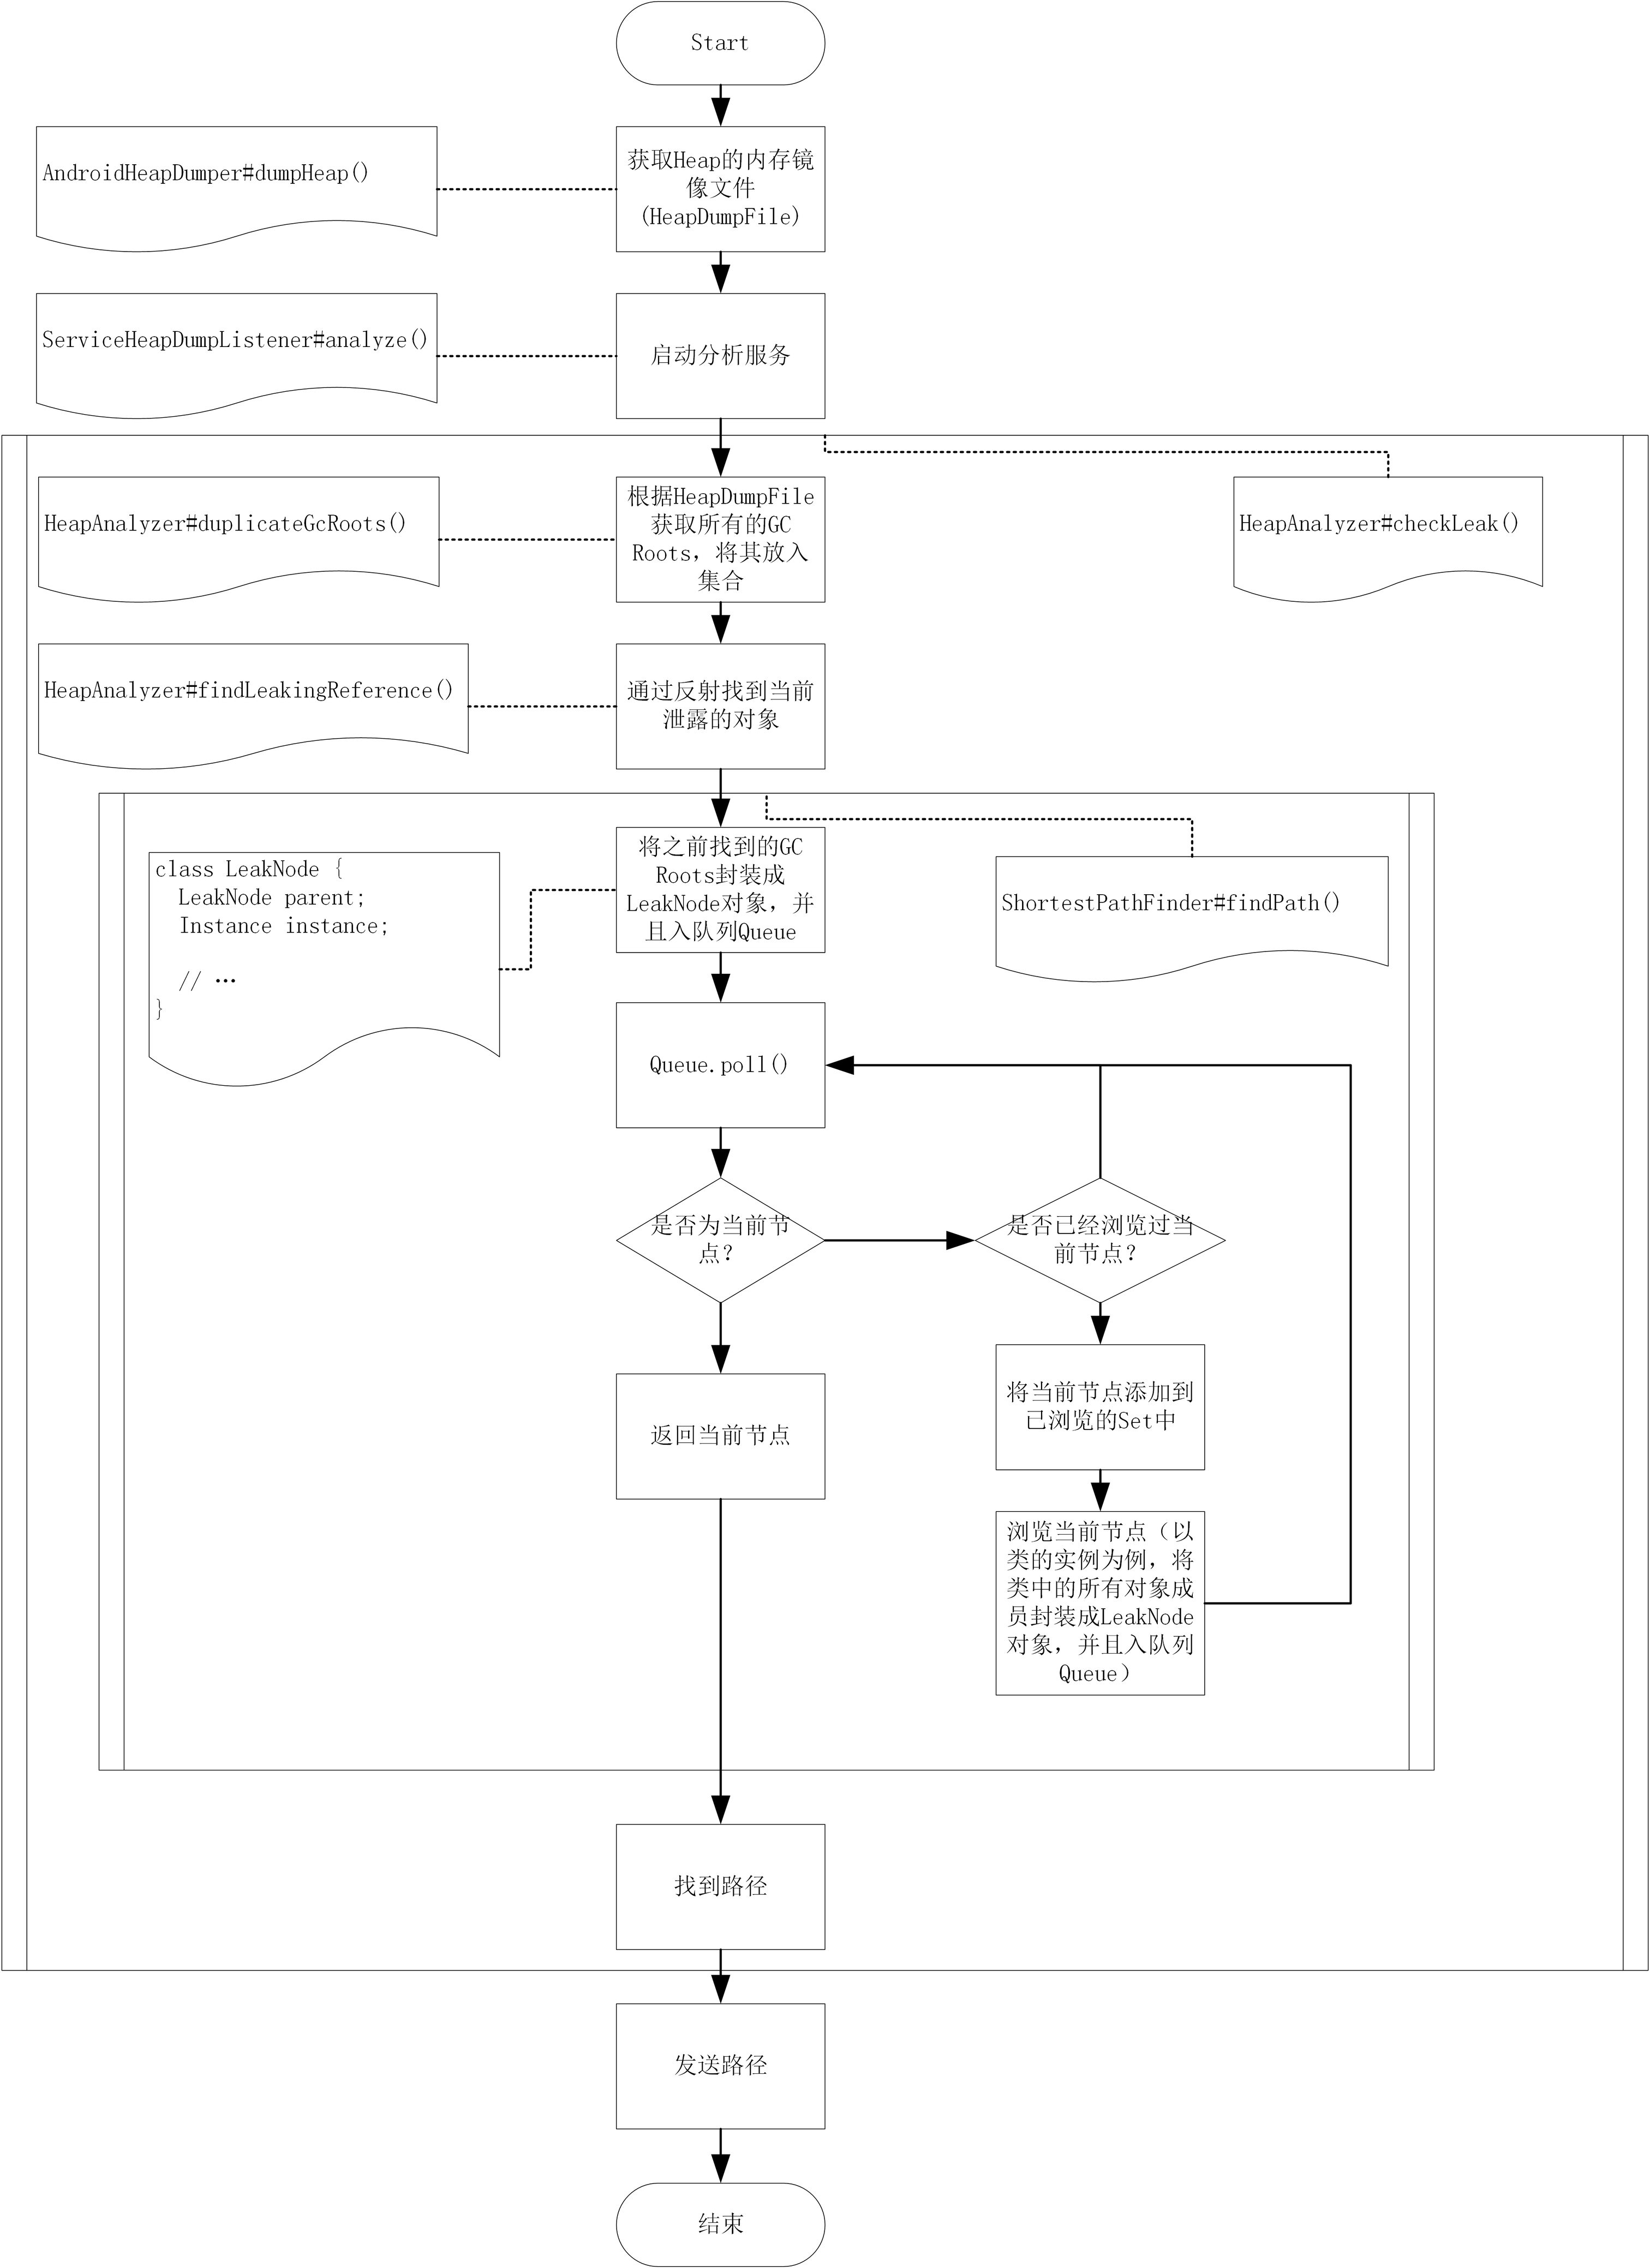
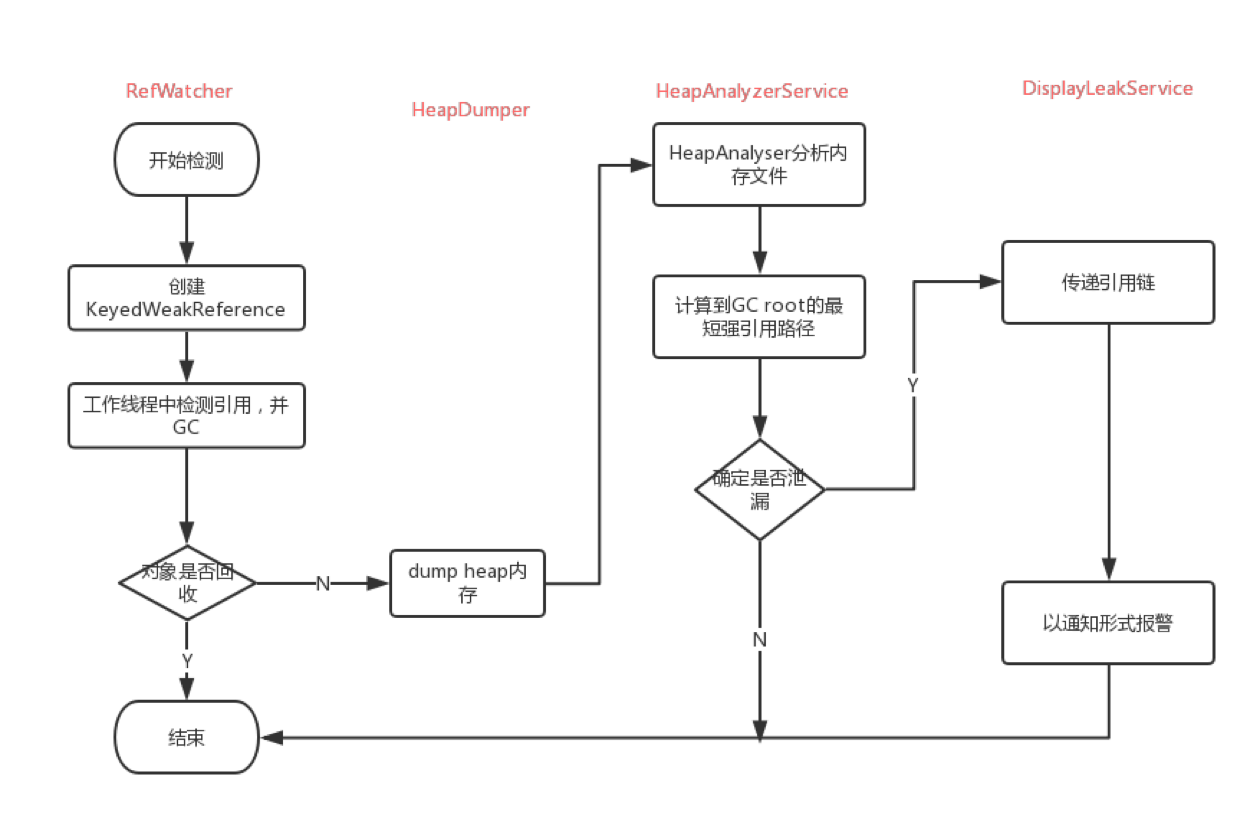
下面附一张leakcanary的流程图
七、leakcanary中Shark的代码分析
Shark是Leakcanary 2.0.0时推出的Heap分析工具,替代了之前使用的HAHA库,其作者称它比haha使用的perflib快6倍,使用的内存却是之前的10分之一 Shark文件架构如下:
- shark:生成heap分析报告
- shark-android:生成安卓的heap分析报告
- share-cli:在电脑上分析手机里的安卓app,不必依赖leakcanary到项目中去
- shark-graph:heap对象的导航图
- shark-hprof:读写heap文件记录 使用方法:
dependencies {
  implementation 'com.squareup.leakcanary:shark-android:$sharkVersion'
}
