

前段时间风靡盆友圈的【猜画小歌】大家应该都玩过,画一幅灵魂画作由AI猜。国外有盆友通过Google Colab训练模型,并基于TensorFlow.js实现了浏览器版的你画我猜,下面是对原文的翻译
代码和Demo
代码:https://github.com/zaidalyafeai/zaidalyafeai.github.io/tree/master/sketcher
Demo:https://zaidalyafeai.github.io/sketcher/
Google Colab notebook:https://colab.research.google.com/github/zaidalyafeai/zaidalyafeai.github.io/blob/master/sketcher/Sketcher.ipynb
数据集
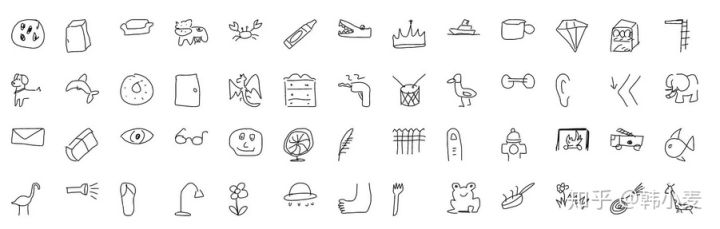
我们使用卷积神经网络CNN来识别画出的图像的类型,在Quick Draw数据集上进行模型训练,这个数据集有345个类别的大约5千万张手绘图像
流程
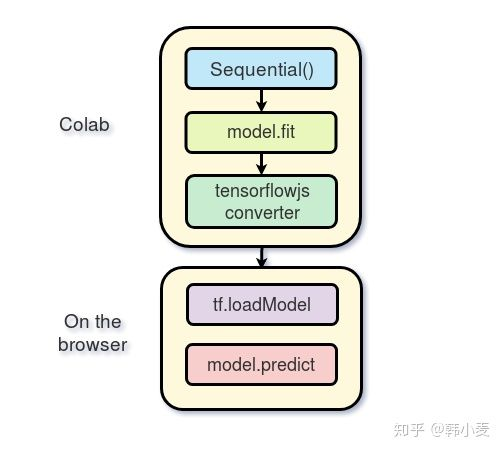
我们将使用 Keras 框架在Google Colab 免费提供的 GPU 上训练模型,然后在浏览器里基于TensorFlow.js运行模型,我之前写过TensorFlow.js的教程,在继续阅读下问之前,可以先看一下这个教程。下图为这个项目的实现流程
在Colab上训练
Google提供了免费的GPU,你可以在这个教程查看如何创建一个notebook和进行GPU编程
导入
我们使用Keras,以tensorflow作为后端运行
import os
import glob
import numpy as np
from tensorflow.keras import layers
from tensorflow import keras
import tensorflow as tf
加载数据
由于内存有限,所以我们不会训练所有的分类,只选了其中的100个分类作为数据集。每个分类的数据都可以在Google Cloud上以numpy数组的形式找到,数组的大小为 [N, 784],N为这个分类下图片的数量。我们先下载这个数据集
import urllib.request
def download():

  base = 'https://storage.googleapis.com/quickdraw_dataset/full/numpy_bitmap/'
  for c in classes:
    cls_url = c.replace('_', '%20')
    path = base+cls_url+'.npy'
    print(path)
    urllib.request.urlretrieve(path, 'data/'+c+'.npy')
由于内存有限,我们只加载每个分类里的5000张图片,并且预览其中的20%作为测试数据
def load_data(root, vfold_ratio=0.2, max_items_per_class= 5000 ):
    all_files = glob.glob(os.path.join(root, '*.npy'))

    #initialize variables
    x = np.empty([0, 784])
    y = np.empty([0])
    class_names = []

    #load a subset of the data to memory
    for idx, file in enumerate(all_files):
        data = np.load(file)
        data = data[0: max_items_per_class, :]
        labels = np.full(data.shape[0], idx)

        x = np.concatenate((x, data), axis=0)
        y = np.append(y, labels)

        class_name, ext = os.path.splitext(os.path.basename(file))
        class_names.append(class_name)

    data = None
    labels = None

    #separate into training and testing
    permutation = np.random.permutation(y.shape[0])
    x = x[permutation, :]
    y = y[permutation]

    vfold_size = int(x.shape[0]/100*(vfold_ratio*100))

    x_test = x[0:vfold_size, :]
    y_test = y[0:vfold_size]

    x_train = x[vfold_size:x.shape[0], :]
    y_train = y[vfold_size:y.shape[0]]
    return x_train, y_train, x_test, y_test, class_names
数据预处理
在训练模型之前,需要对数据进行预处理。该模型将使用规模为 [N, 28, 28, 1] 的批处理,并且输出规模为 [N, 100] 的概率。
# Reshape and normalize
x_train = x_train.reshape(x_train.shape[0], image_size, image_size, 1).astype('float32')
x_test = x_test.reshape(x_test.shape[0], image_size, image_size, 1).astype('float32')

x_train /= 255.0
x_test /= 255.0

# Convert class vectors to class matrices
y_train = keras.utils.to_categorical(y_train, num_classes)
y_test = keras.utils.to_categorical(y_test, num_classes)
创建模型
我们将创建一个简单的卷积神经网络,模型越简单、参数越少越好。因为我们将在浏览器里运行模型,并且希望能快速得到预测结果。因此我们的模型只包含 3 个卷积层和 2 个全连接层:
# Define model
model = keras.Sequential()
model.add(layers.Convolution2D(16, (3, 3),
                        padding='same',
                        input_shape=x_train.shape[1:], activation='relu'))
model.add(layers.MaxPooling2D(pool_size=(2, 2)))
model.add(layers.Convolution2D(32, (3, 3), padding='same', activation= 'relu'))
model.add(layers.MaxPooling2D(pool_size=(2, 2)))
model.add(layers.Convolution2D(64, (3, 3), padding='same', activation= 'relu'))
model.add(layers.MaxPooling2D(pool_size =(2,2)))
model.add(layers.Flatten())
model.add(layers.Dense(128, activation='relu'))
model.add(layers.Dense(100, activation='softmax'))
# Train model
adam = tf.train.AdamOptimizer()
model.compile(loss='categorical_crossentropy',
              optimizer=adam,
              metrics=['top_k_categorical_accuracy'])
print(model.summary())
拟合、验证及测试
接着我们对模型进行了 5 轮训练,将训练数据分成了 256 批输入模型,并且分离出 10% 作为验证集。
#fit the model
model.fit(x = x_train, y = y_train, validation_split=0.1, batch_size = 256, verbose=2, epochs=5)

#evaluate on unseen data
score = model.evaluate(x_test, y_test, verbose=0)
print('Test accuarcy: {:0.2f}%'.format(score[1] * 100))
下面是训练结果
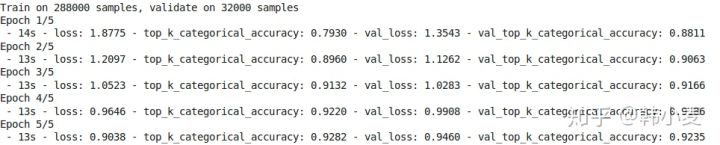
测试结果达到了 92.20% 的 top 5 准确率
准备web格式的模型
得到准确率符合预期的模型之后,我们将模型保存下来
model.save('keras.h5')
安装tensorflow.js
!pip install tensorflowjs
转换模型
!mkdir model
!tensorflowjs_converter --input_format keras keras.h5 model/
转换之后生成了一些权重文件和包含模型架构的 json 文件
通过 zip 将模型进行压缩,以便将其下载到本地机器上:
!zip -r model.zip model
下载模型
from google.colab import files
files.download('model.zip')
在浏览器进行预测
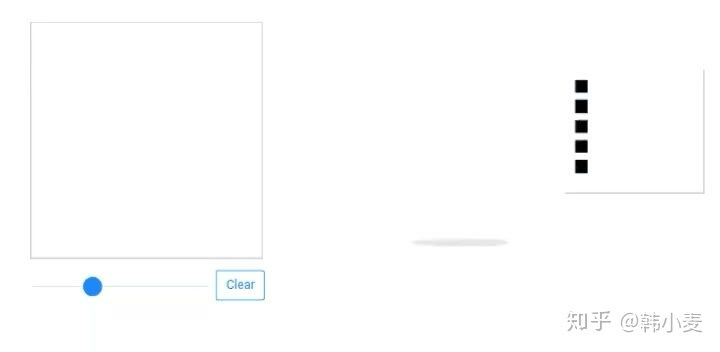
在这部分,我们将介绍如何在浏览器加载模型,并进行预测。我们将创建一个300*300的画布,这里我将不会介绍画布相关实现,而是将重点放在TensorFlow.js这部分
加载模型
为了使用 TensorFlow.js,我们首先需要加载对应脚本
<script src="https://cdn.jsdelivr.net/npm/@tensorflow/tfjs@latest"> </script>
你的本地机器上需要有一台运行中的服务器来托管权重文件,你可以使用apache 服务器或者和我一样托管在GitHub上
model = await tf.loadModel('model/model.json')
预处理
在进行预测前,需要把得到的数据进行一定的处理,首先从canvas上获取图片数据
//the minimum boudning box around the current drawing
const mbb = getMinBox()
//cacluate the dpi of the current window
const dpi = window.devicePixelRatio
//extract the image data
const imgData = canvas.contextContainer.getImageData(mbb.min.x * dpi, mbb.min.y * dpi,
						       (mbb.max.x - mbb.min.x) * dpi, (mbb.max.y - mbb.min.y) * dpi);
文章稍后将介绍 getMinBox(),dpi 变量用来根据屏幕像素的密度对裁剪出的画布进行拉伸
我们将画布当前的图像数据转化为一个张量,调整大小并进行归一化处理:
function preprocess(imgData)
{
return tf.tidy(()=>{
    //convert the image data to a tensor
    let tensor = tf.fromPixels(imgData, numChannels= 1)
    //resize to 28 x 28
    const resized = tf.image.resizeBilinear(tensor, [28, 28]).toFloat()
    // Normalize the image
    const offset = tf.scalar(255.0);
    const normalized = tf.scalar(1.0).sub(resized.div(offset));
    //We add a dimension to get a batch shape
    const batched = normalized.expandDims(0)
    return batched
})
}
我们使用 model.predict 进行预测,这将返回一个规模为「N, 100」的概率。
const pred = model.predict(preprocess(imgData)).dataSync()
我们可以排序得到Top5的概率
提升准确率
我们的模型接受的输入数据是规模为 [N, 28, 28, 1] 的张量,我们绘图画布的尺寸为 300*300,但是用户可能在这个画布上画了个很小的图像,因此我们需要剪裁出包含手绘图像的那部分,通过找到手绘内容最左上方和右下方的点即可实现
//record the current drawing coordinates
function recordCoor(event)
{
  //get current mouse coordinate
  var pointer = canvas.getPointer(event.e);
  var posX = pointer.x;
  var posY = pointer.y;

  //record the point if withing the canvas and the mouse is pressed
  if(posX >=0 && posY >= 0 && mousePressed)
  {
    coords.push(pointer)
  }
}

//get the best bounding box by finding the top left and bottom right cornders
function getMinBox(){

   var coorX = coords.map(function(p) {return p.x});
   var coorY = coords.map(function(p) {return p.y});
   //find top left corner
   var min_coords = {
    x : Math.min.apply(null, coorX),
    y : Math.min.apply(null, coorY)
   }
   //find right bottom corner
   var max_coords = {
    x : Math.max.apply(null, coorX),
    y : Math.max.apply(null, coorY)
   }
   return {
    min : min_coords,
    max : max_coords
   }
}
手绘测试
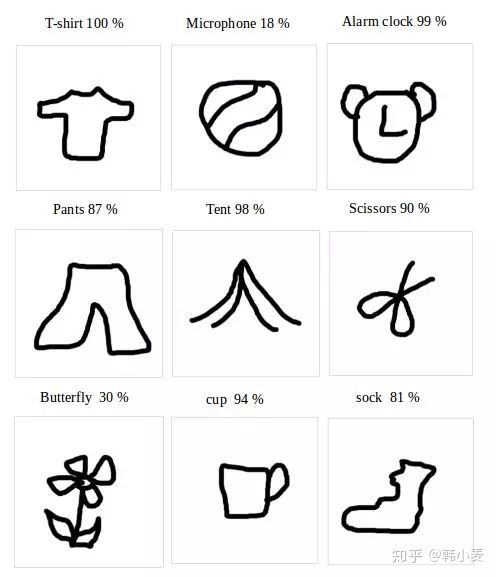
下图显示了一些第一次绘制的图像以及准确率最高的类别,所有的手绘图像都是我用鼠标画的,用笔绘制的话应该会得到更高的准确率
原文地址:https://medium.com/tensorflow/train-on-google-colab-and-run-on-the-browser-a-case-study-8a45f9b1474e
