

本人所使用的Gephi版本为0.9.2,以下方式亲测可用。
概述:
动态网络是一种包括时间信息的简单网络。你可以想象一下你的朋友关系网络,随着时间的推移,你认识的人越来越多,与这些人的关系也会发生变化,对应到图中,你的朋友节点数和连接数随着时间的在增长,属性值也在随着时间改变。现实中还有很多随着时间改变的关系网络,所以,我们需要使用Gephi来可视化跟时间相关的动态网络。
三种方式生成动态数据:
方法一:时间列转化为动态数据
想象一下你的同事关系网络,你入职的时候与同事建立同事关系,离职的时候同事关系结束,这里可以使用这两个时间点来建立动态网络,那怎么在Gephi中实现这个动态的时间间隔呢?
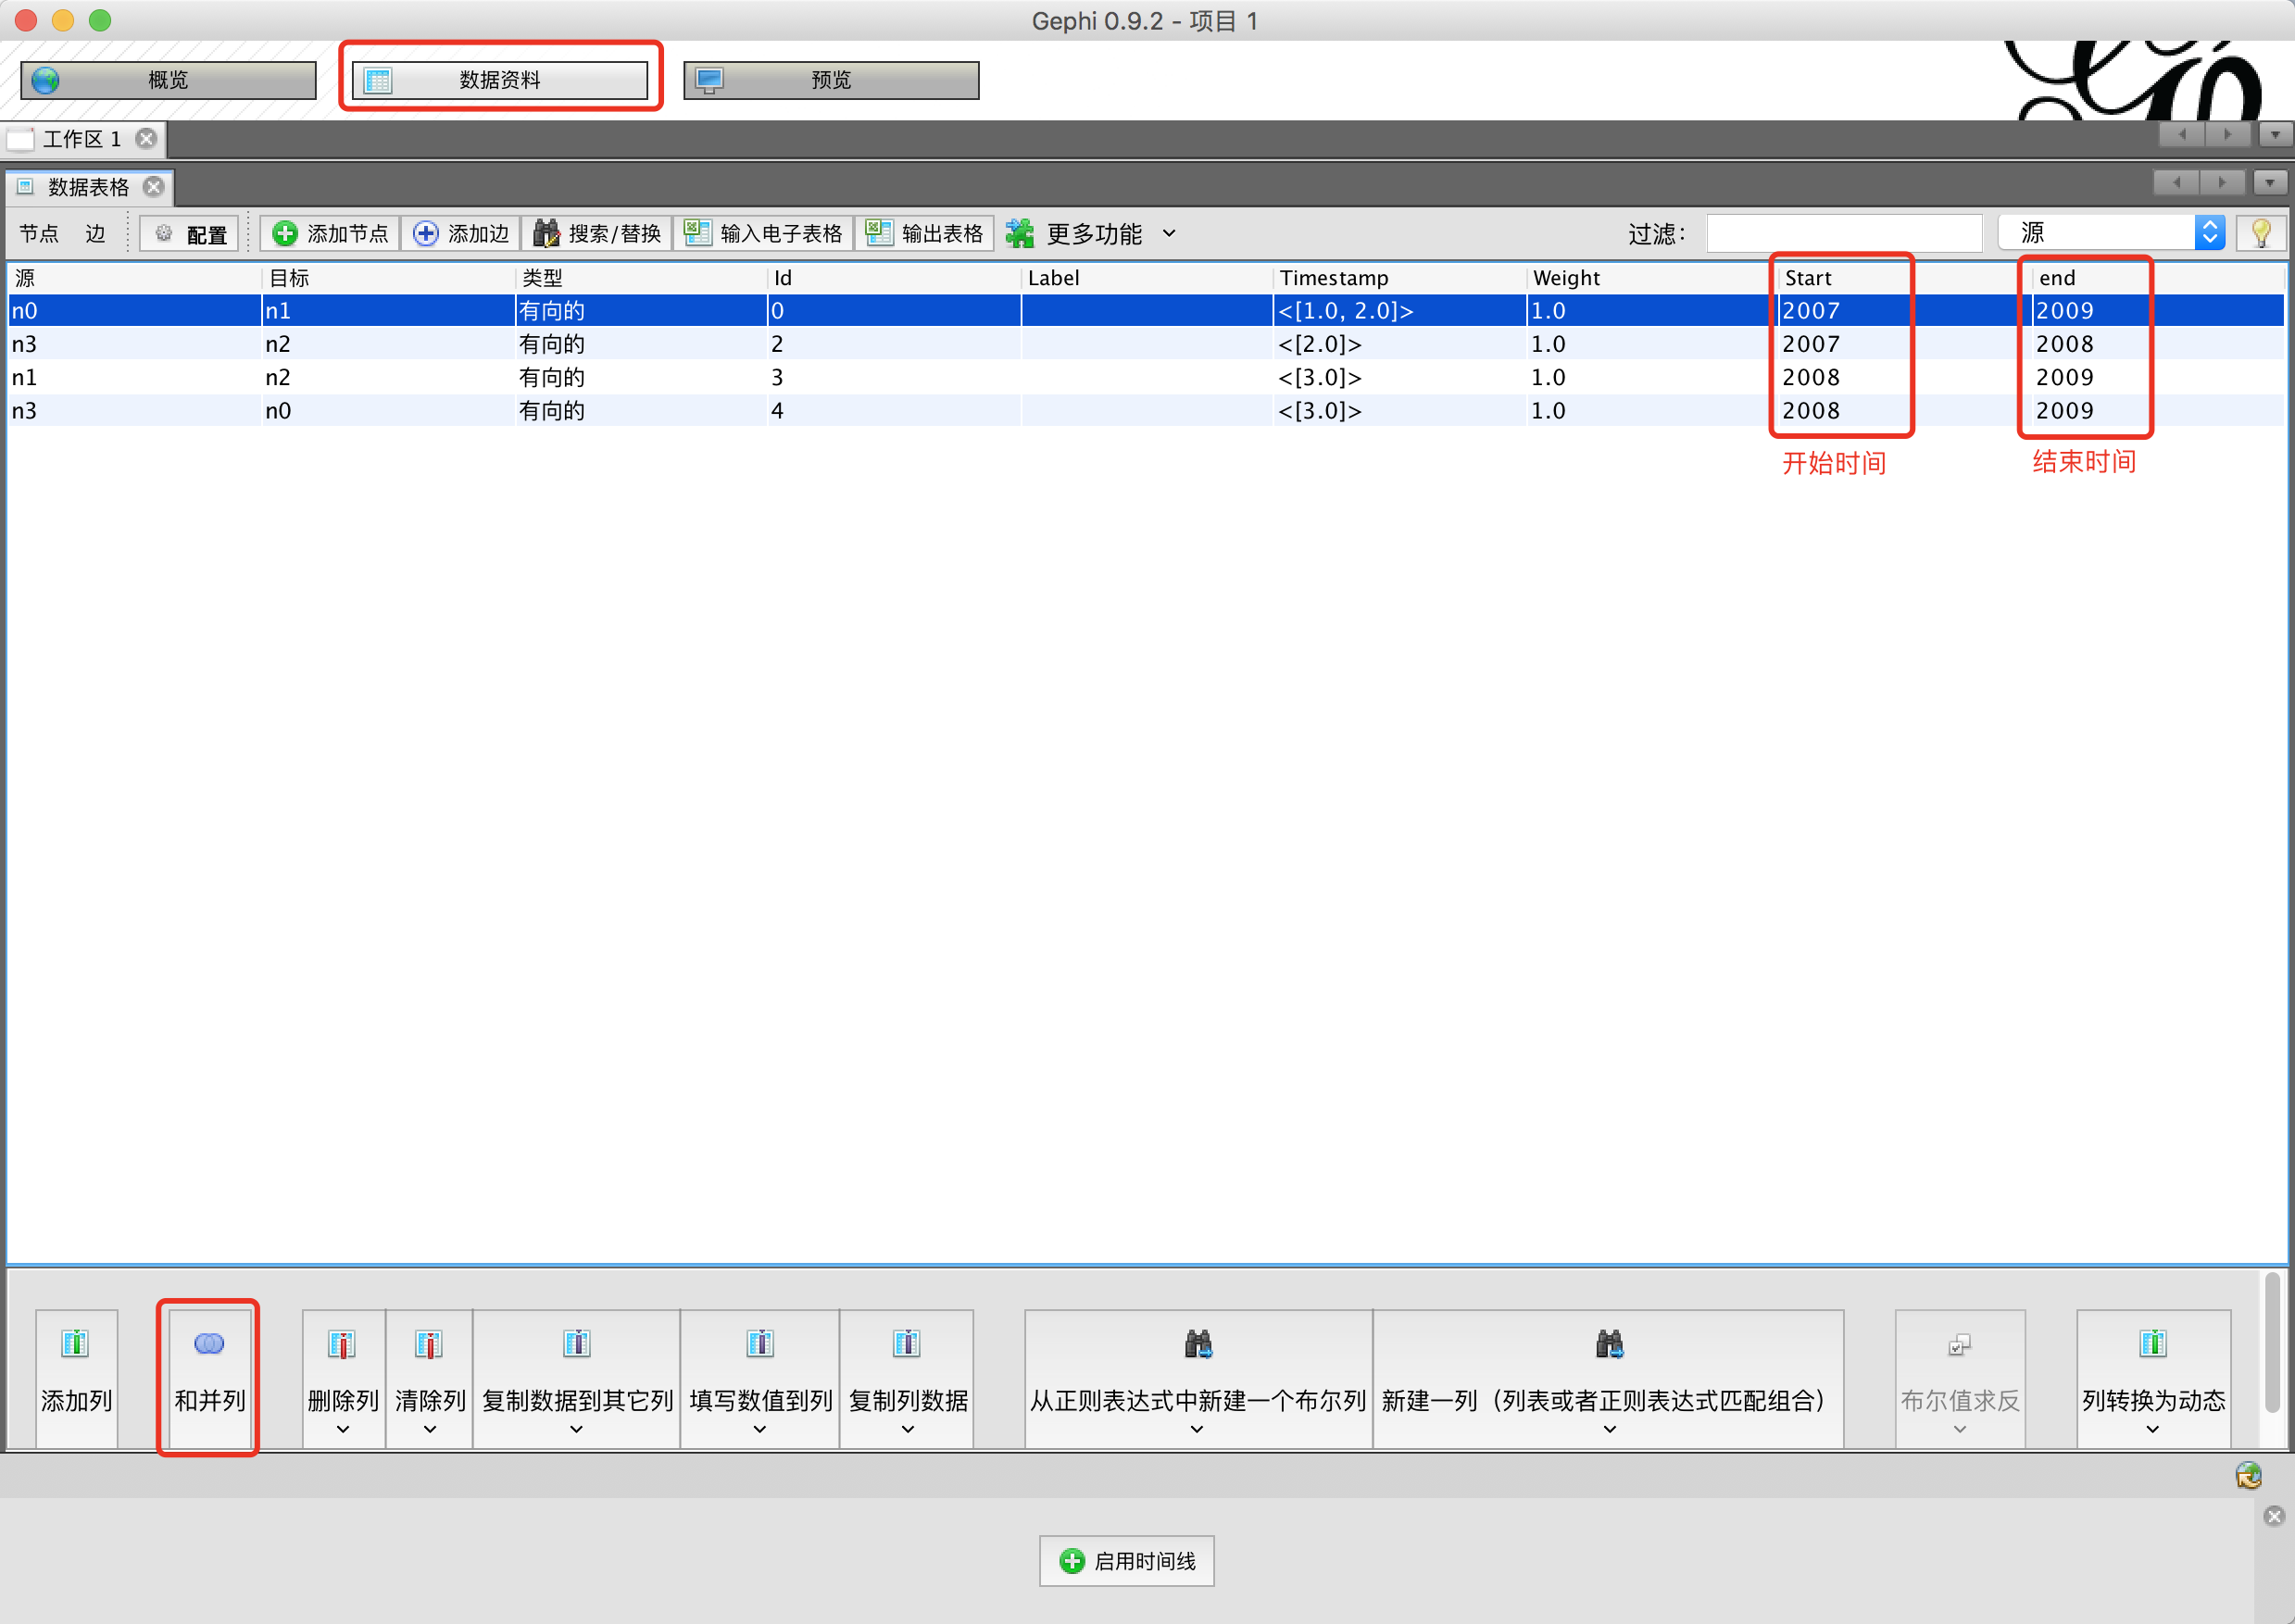
假设你的数据已经导入到Gephi的数据资料中
-
在[数据资料]中点击[合并列]
-
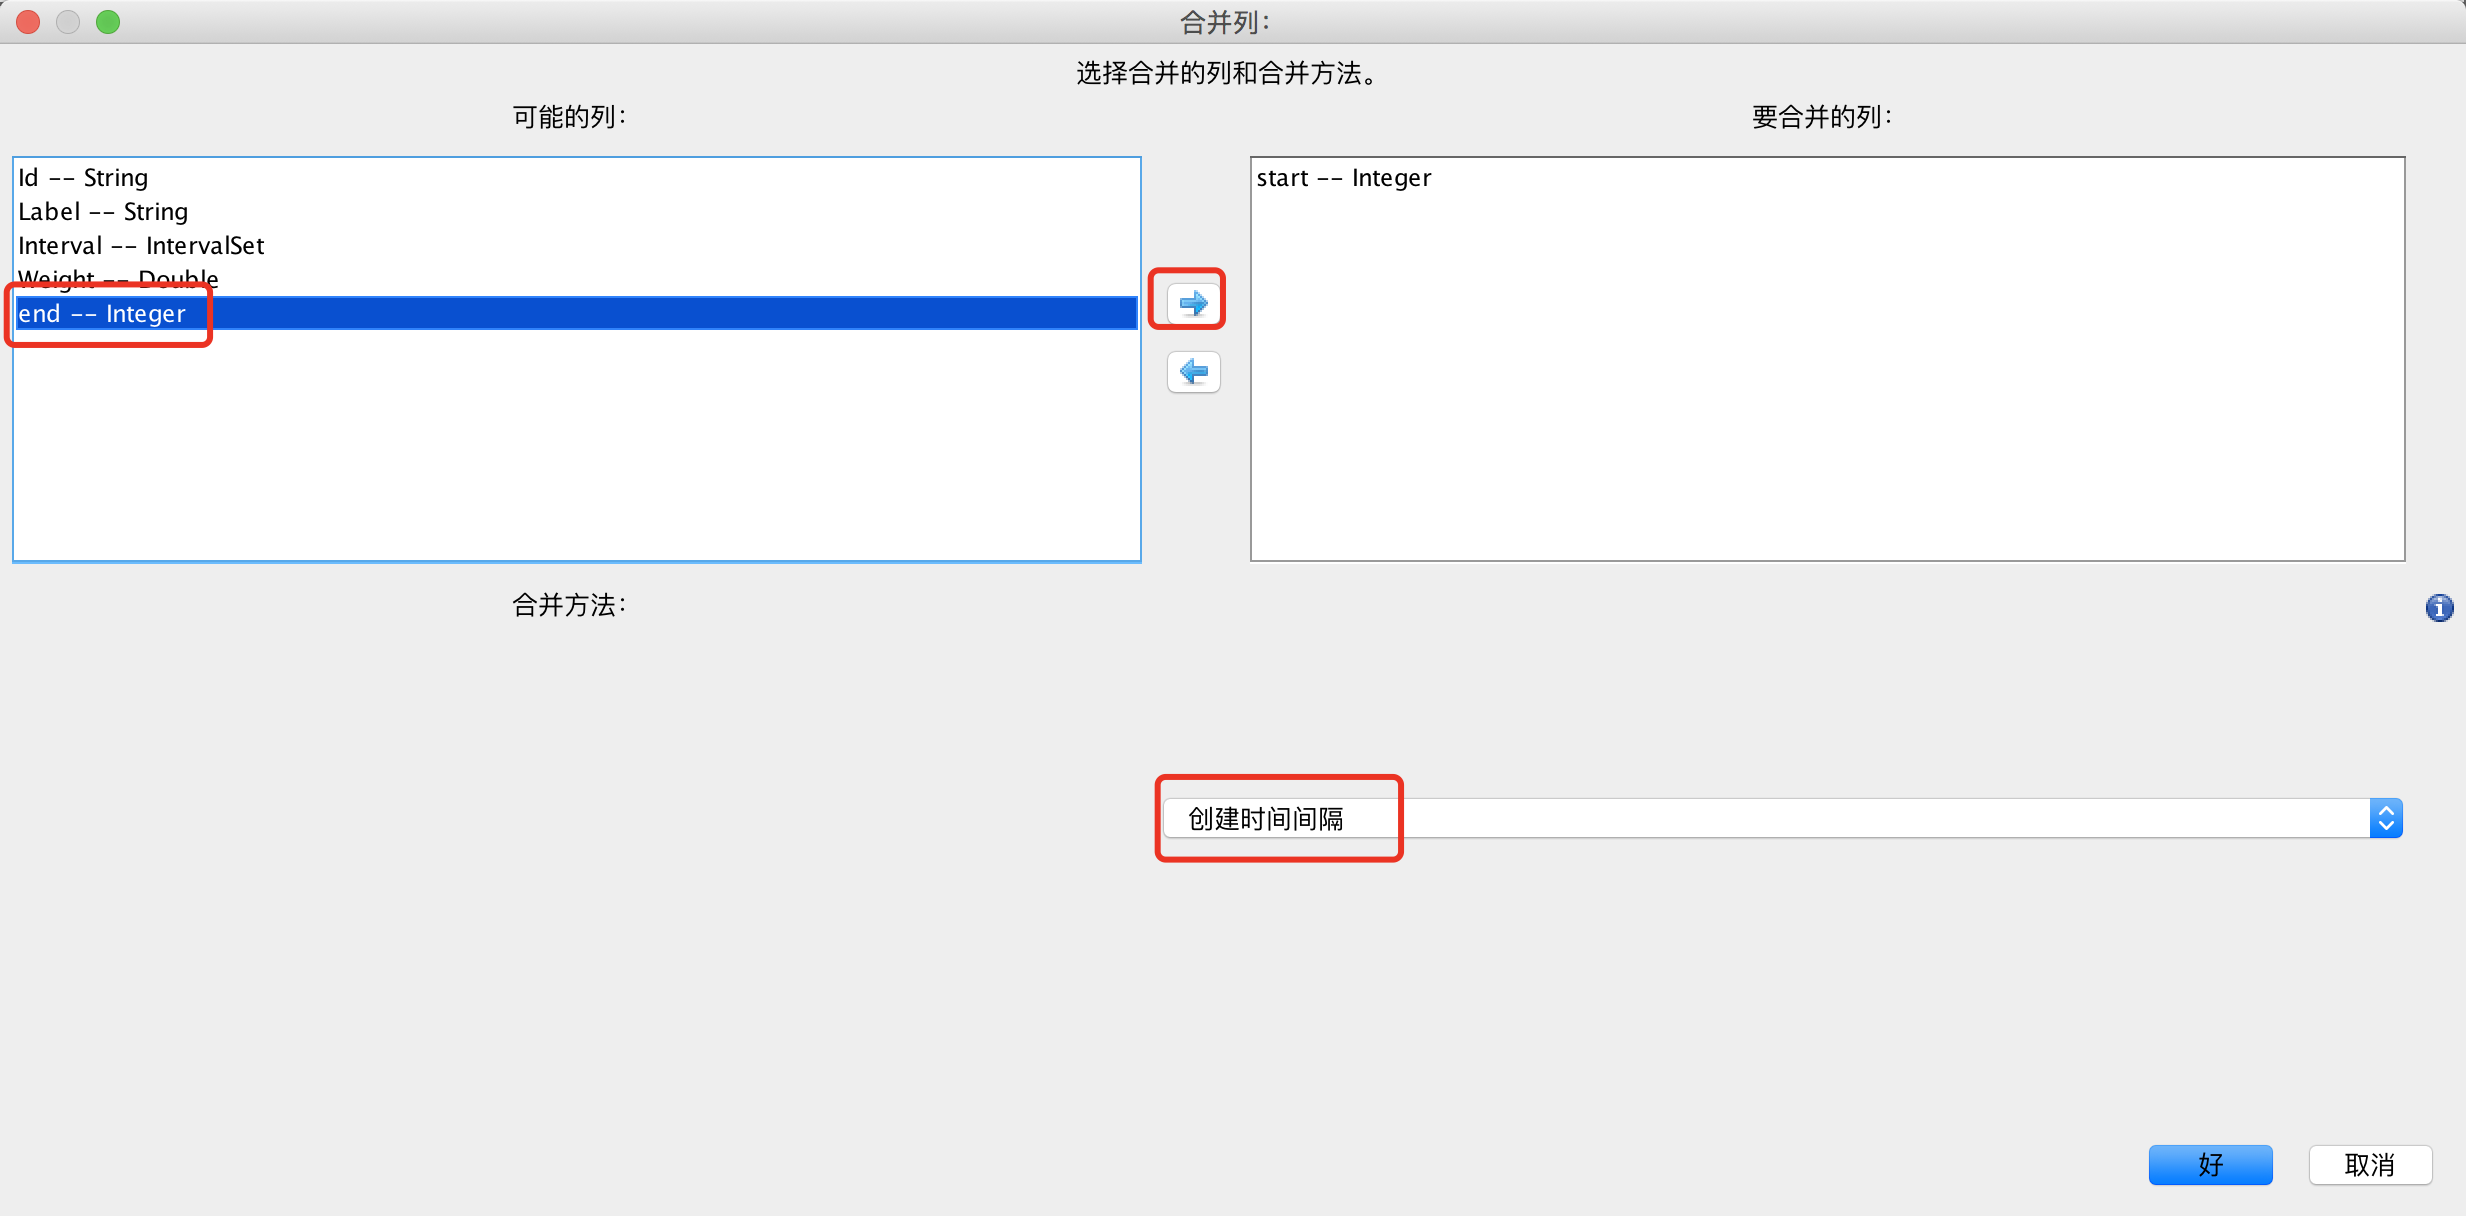
在合并列窗口选择要合并的列到右边的窗口,下面选择[创建时间间隔]
-
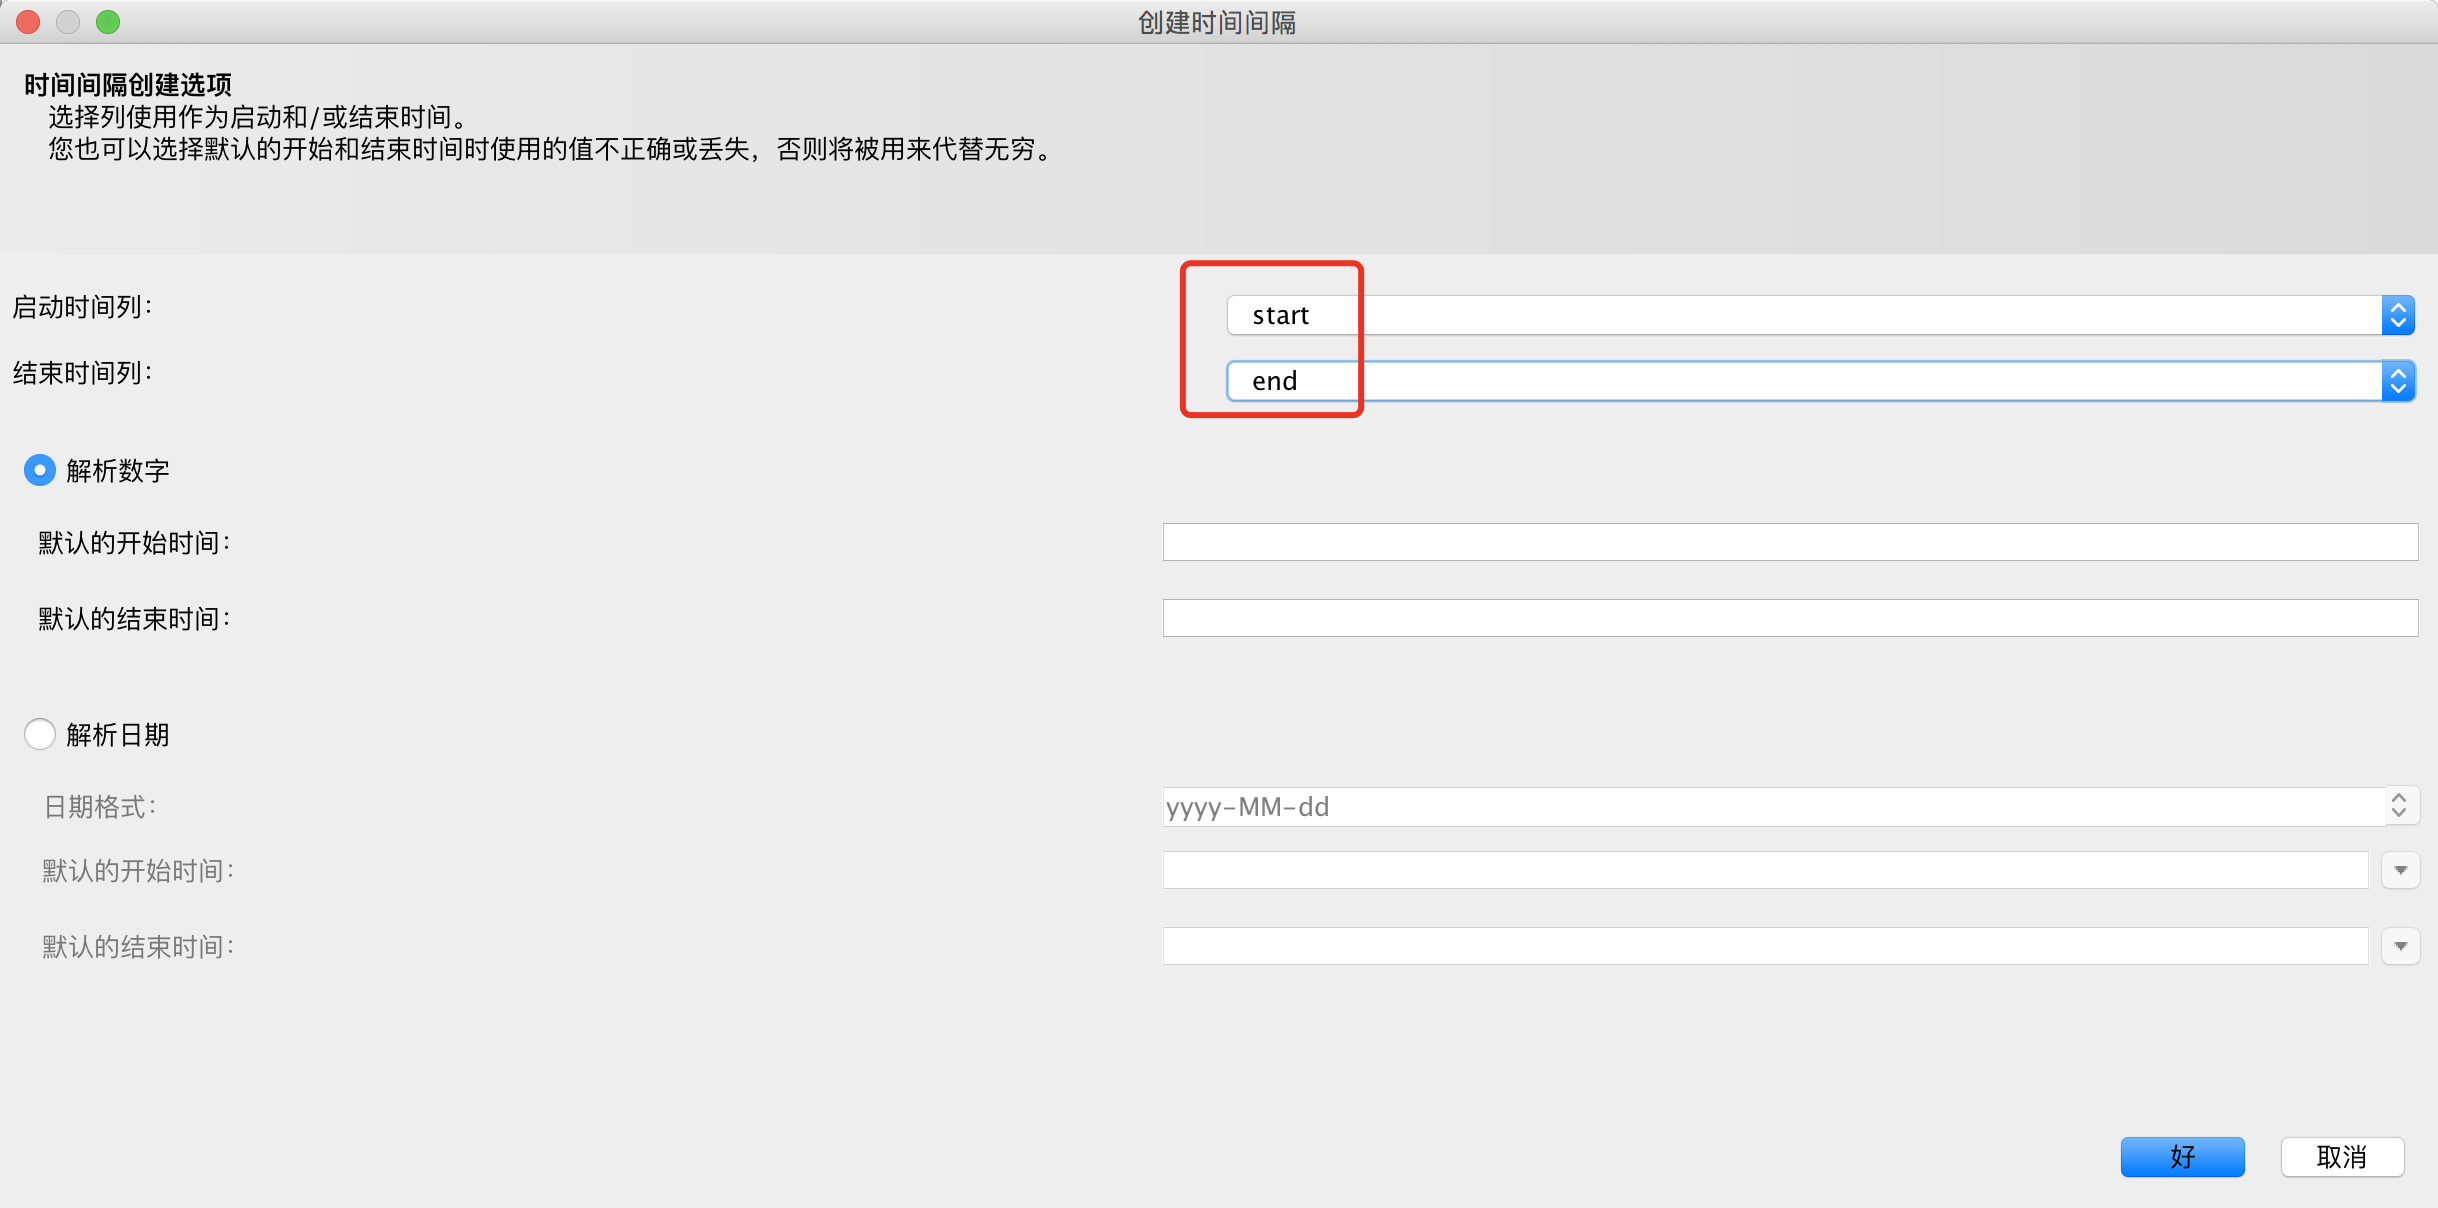
选择启动时间列和结束时间列,如果你的列的类型为int选择解析数字,如果为string类型选择解析日期
至此你的动态数据已经生成了。


方法二:导入动态的GEXF 文件
GEXF文件是一种XML标记语言,包含了动态网络所需的所有信息。在GEXF中,你可以使用’start’和’end’属性来标示一个节点或者边的出现和消失。
一个简单的GEXF文件的示例:
<?xml version="1.0" encoding="UTF-8"?>
<gexf xmlns="http://www.gexf.net/1.1draft"
       xmlns:xsi="http://www.w3.org/2001/XMLSchema-instance"
       xsi:schemaLocation="http://www.gexf.net/1.1draft
                             http://www.gexf.net/1.1draft/gexf.xsd"
      version="1.1">
  <graph mode="dynamic" defaultedgetype="directed">
    <nodes>
      <node id="n1" label="Node 1" start="2007" endopen="2009" />
      <node id="n2" label="Node 2" start="2007" end="2009" />
      <node id="n3" label="Node 3" start="2008" end="2009" />
    </nodes>
    <edges>
      <edge source="n1" target="n2" />
      <edge source="n1" target="n3" start="2008"/>
      <edge source="n3" target="n2" start="2008" endopen="2009"/>
    </edges>
  </graph>
</gexf>
说明:
- 我们使用
mode = dynamic来声明这是一个动态网络。 -
我们使用
start和end来表示类似[2007, 2009]包含两个零界点,使用startopen和endopen来表示类似(2008,2009)不包含两个零界点。复杂点的GEXF文件的示例:
<gexf xmlns="http://www.gexf.net/1.1draft"
      xmlns:xsi="http://www.w3.org/2001/XMLSchema-instance"
      xsi:schemaLocation="http://www.gexf.net/1.1draft
                          http://www.gexf.net/1.1draft/gexf.xsd"
                          version="1.1">
  <graph mode="dynamic" defaultedgetype="directed">
    <attributes class="node" mode="dynamic">
      <attribute id="price" title="Price" type="float"/>
    </attributes>
    <nodes>
      <node id="n1" label="Node 1" start="2007" endopen="2009" >
        <attvalues>
          <attvalue for="price" value="25.5" start="2007"/>
          <attvalue for="price" value="42.5" start="2008"/>
        </attvalues>
      </node>
      <node id="n2" label="Node 2" start="2007" end="2009" >
        <attvalues>
          <attvalue for="price" value="12" start="2008"/>
        </attvalues>
      </node>
      <node id="n3" label="Node 3" start="2008" end="2009" >
        <attvalues>
          <attvalue for="price" value="40.5" start="2008" end="2009" />
        </attvalues>
      </node>
    </nodes>
    <edges>
      <edge source="n1" target="n2" />
      <edge source="n1" target="n3" start="2008"/>
      <edge source="n3" target="n2" start="2008" endopen="2009"/>
    </edges>
  </graph>
</gexf>
将上面的文件内容保存为
.gexf文件,使用Gephi打开就导入了动态数据。
方法三:导入多个静态的GEXF文件
把下面三份数据保存为三个.gexf文件
<?xml version="1.0" encoding="UTF-8"?>
<gexf xmlns="http://www.gephi.org/gexf/1.1draft" xmlns:xsi="http://www.w3.org/2001/XMLSchema-instance" xsi:schemaLocation="http://www.gephi.org/gexf/1.1draft http://gephi.org/gexf/1.1draft.xsd" version="1.3">
    <graph mode="slice" defaultedgetype="directed" timerepresentation="timestamp" timestamp="1">
        <nodes>
            <node id="n0" label="Bob"/>
            <node id="n1" label="Jack"/>
        </nodes>
        <edges>
            <edge weight="1" source="n0" target="n1">
            </edge>
        </edges>
    </graph>
</gexf>
<?xml version="1.0" encoding="UTF-8"?>
<gexf xmlns="http://www.gephi.org/gexf/1.1draft" xmlns:xsi="http://www.w3.org/2001/XMLSchema-instance" xsi:schemaLocation="http://www.gephi.org/gexf/1.1draft http://gephi.org/gexf/1.1draft.xsd" version="1.3">
    <graph mode="slice" defaultedgetype="directed" timerepresentation="timestamp" timestamp="2">
        <nodes>
            <node id="n0" label="Bob"/>
            <node id="n1" label="Jack"/>
            <node id="n2" label="Sue"/>
            <node id="n3" label="Beth"/>
        </nodes>
        <edges>
            <edge weight="1" source="n0" target="n1"/>
            <edge weight="1" source="n3" target="n2"/>
        </edges>
    </graph>
</gexf>
<?xml version="1.0" encoding="UTF-8"?>
<gexf xmlns="http://www.gephi.org/gexf/1.1draft" xmlns:xsi="http://www.w3.org/2001/XMLSchema-instance" xsi:schemaLocation="http://www.gephi.org/gexf/1.1draft http://gephi.org/gexf/1.1draft.xsd" version="1.3">
    <graph mode="slice" defaultedgetype="directed" timerepresentation="timestamp" timestamp="3">
        <nodes>
            <node id="n0" label="Bob"/>
            <node id="n1" label="Jack"/>
            <node id="n2" label="Sue"/>
            <node id="n3" label="Beth"/>
        </nodes>
        <edges>
            <edge weight="1" source="n1" target="n2"/>
            <edge weight="1" source="n3" target="n0"/>
        </edges>
    </graph>
</gexf>
使用Gephi在[文件]中选择[打开],然后一起选中上面保存的三个文件打开,在弹框中选中Merge into new worskpace

至此,动态数据就已经导入到了Gephi中。
动态网络的使用
Gephi网络可视化的过程本篇文章就不介绍了,大家可以看另外一篇文章传送门,这里重点讲讲时间网络的用法。
动态数据导入成功后,在Gephi界面会多一个时间轴

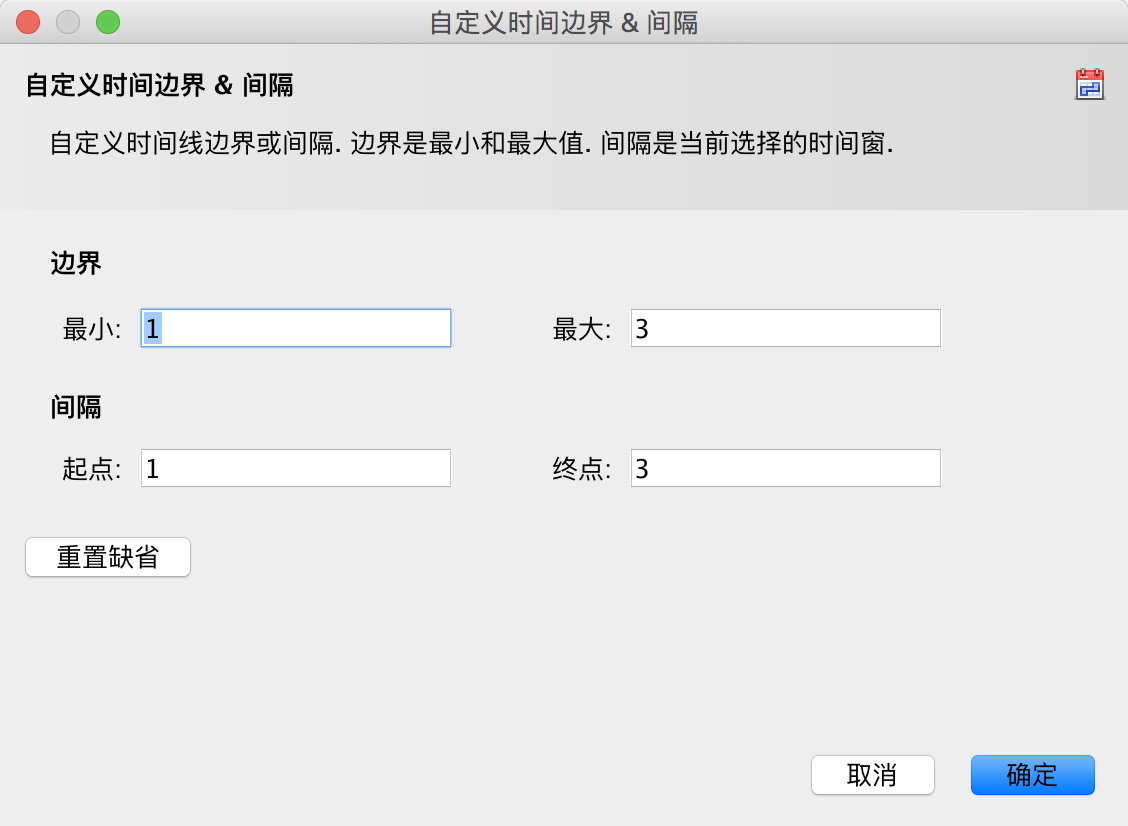
点击时间轴左下角的设置按钮进行以下设置:
-
设置时间轴运行的起始时间和终止时间
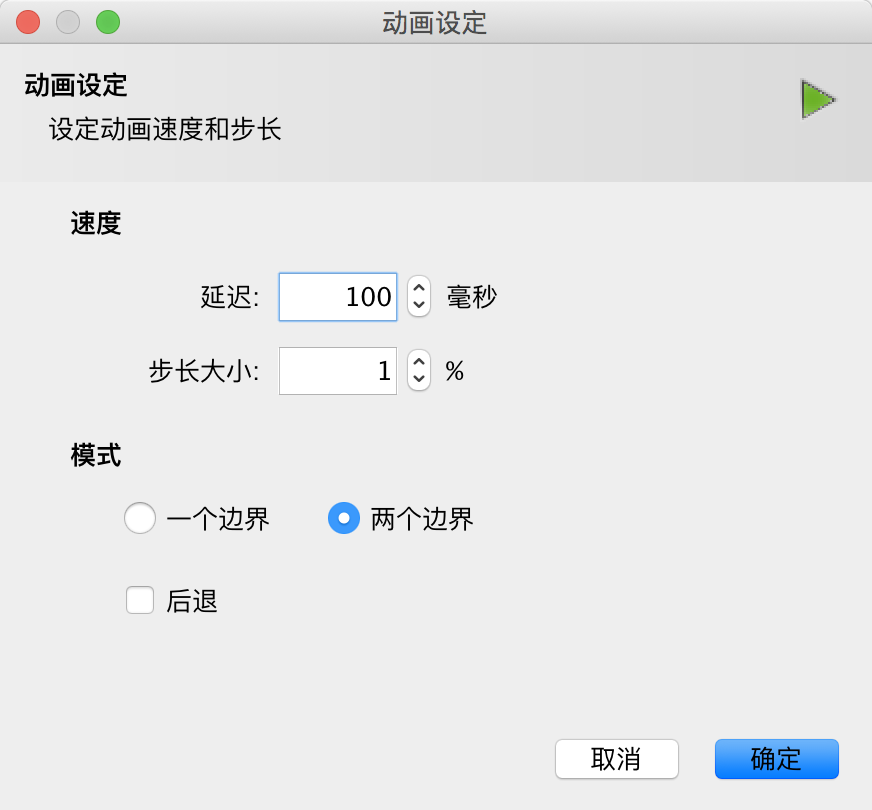
-
设置时间轴运行的速度和运行模式
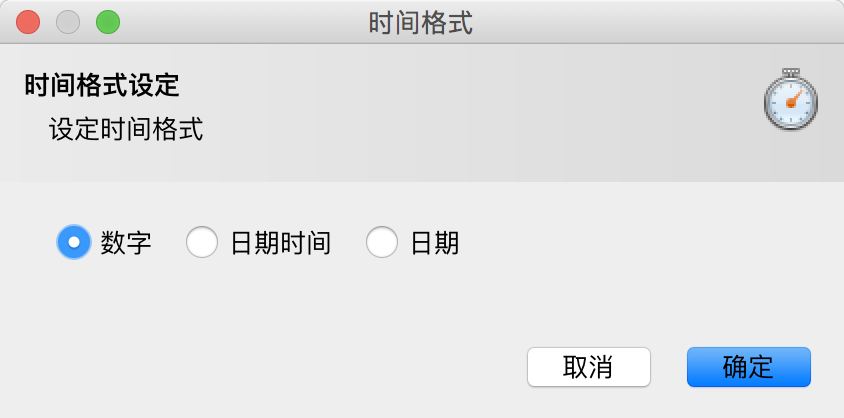
-
设置时间轴运行的数据格式


在Gephi的”概览” “数据资料” “预览” 三种状态下都可以使用时间轴来观察数据变化,在’’预览”中不会随着时间轴的运行自动刷新预览效果,需要暂停之后手动刷新查看效果。
