使用 D3.js 默认的 svg 渲染
D3默认的树状图画图使用的是svg, 比如这个来自D3作者的例子:
使用svg有好有坏:
- 好处是方便操作dom元素, 添加用户交互
- 坏处是渲染效率不高, 在数据量较大时页面易掉帧, 卡顿
在大多数数据量不是特别大情况下, 使用svg的好处是远远盖过坏处的,但如果我们真的需要渲染大量的数据呢?
使用 D3.js + Canvas 渲染
source code
demo page
ssthouse.github.io/organizatio…
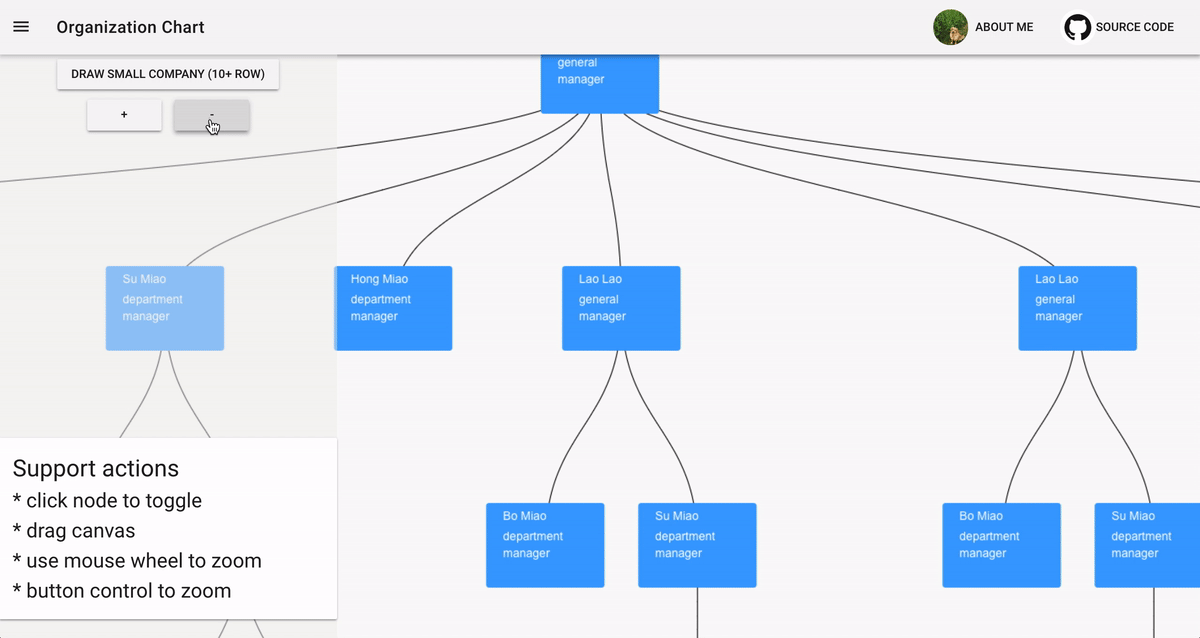
上面的demo就是使用 D3.js + Canvas 的方式实现的, 在组织的层数超过300时才会出现明显的卡顿, 能满足大部分的组织结构图的数据.
思路
- 使用 D3.js的 Three 在
虚拟Dom中画好图像 - 使用Canvas绘图 API将
虚拟Dom中的数据 (坐标 & 线的path) 等绘制到Canvas上 - 使用
Unique-color的方式实现Canvas 的用户交互 - 通过绘制一张和之前 Canvas数据相同的隐藏Canvas, 并给每一个 想要接受用户交互的节点赋予唯一的颜色
- 通过监听Canvas点击事件, 获取点击像素的颜色值来判断点击的节点
- 该文章中有对该思路的详细介绍: medium.com/@lverspohl/…
1.使用 D3.js的 Three 在 虚拟Dom 中画好图像
首先调使用D3创建 Tree的虚拟Dom:
this.data = this.d3.hierarchy(data)
this.treeGenerator = this.d3.tree()
  .nodeSize([this.nodeWidth, this.nodeHeight])
let nodes = this.treeData.descendants()
let links = this.treeData.links()
上面的变量 nodes 和 links 现在就包含了结构图中每个 组织节点 和 连接线 的坐标信息.
2. 使用Canvas绘图 API将 虚拟Dom 中的数据 (坐标 & 线的path) 等绘制到Canvas上
在 drawShowCanvas中, 通过 d3.select拿到虚拟的dom节点, 再使用 Canvas的绘图函数进行绘制, 这里用到了一些 Util的工具方法, 具体实现请参考源码.
  drawShowCanvas () {
    this.context.clearRect(-50000, -10000, 100000, 100000)

    let self = this
    // draw links
    this.virtualContainerNode.selectAll('.link')
      .each(function () {
        let node = self.d3.select(this)
        let linkPath = self.d3.linkVertical()
          .x(function (d) {
            return d.x
          })
          .y(function (d) {
            return d.y
          })
          .source(function () {
            return {x: node.attr('sourceX'), y: node.attr('sourceY')}
          })
          .target(function () {
            return {x: node.attr('targetX'), y: node.attr('targetY')}
          })
        let path = new Path2D(linkPath())
        self.context.stroke(path)
      })

    this.virtualContainerNode.selectAll('.orgUnit')
      .each(function () {
        let node = self.d3.select(this)
        let treeNode = node.data()[0]
        let data = treeNode.data
        self.context.fillStyle = '#3ca0ff'
        let indexX = Number(node.attr('x')) - self.unitWidth / 2
        let indexY = Number(node.attr('y')) - self.unitHeight / 2

        // draw unit outline rect (if you want to modify this line ===>   please modify the same line in `drawHiddenCanvas`)
        Util.roundRect(self.context, indexX, indexY, self.unitWidth, self.unitHeight, 4, true, false)

        Util.text(self.context, data.name, indexX + self.unitPadding, indexY + self.unitPadding, '20px', '#ffffff')
        // Util.text(self.context, data.title, indexX + self.unitPadding, indexY + self.unitPadding + 30, '20px', '#000000')
        let maxWidth = self.unitWidth - 2 * self.unitPadding
        Util.wrapText(self.context, data.title, indexX + self.unitPadding, indexY + self.unitPadding + 24, maxWidth, 20)
      })
  }
3. 使用 Unique-color 的方式实现Canvas 的用户交互
下图中可以看到, 实际上是有两张Canvas的, 其中下面的Canvas除了的节点颜色不同外, 和上面的Cavans绘制的数据完全相同.
  drawCanvas () {
    this.drawShowCanvas()
    this.drawHiddenCanvas()
  }
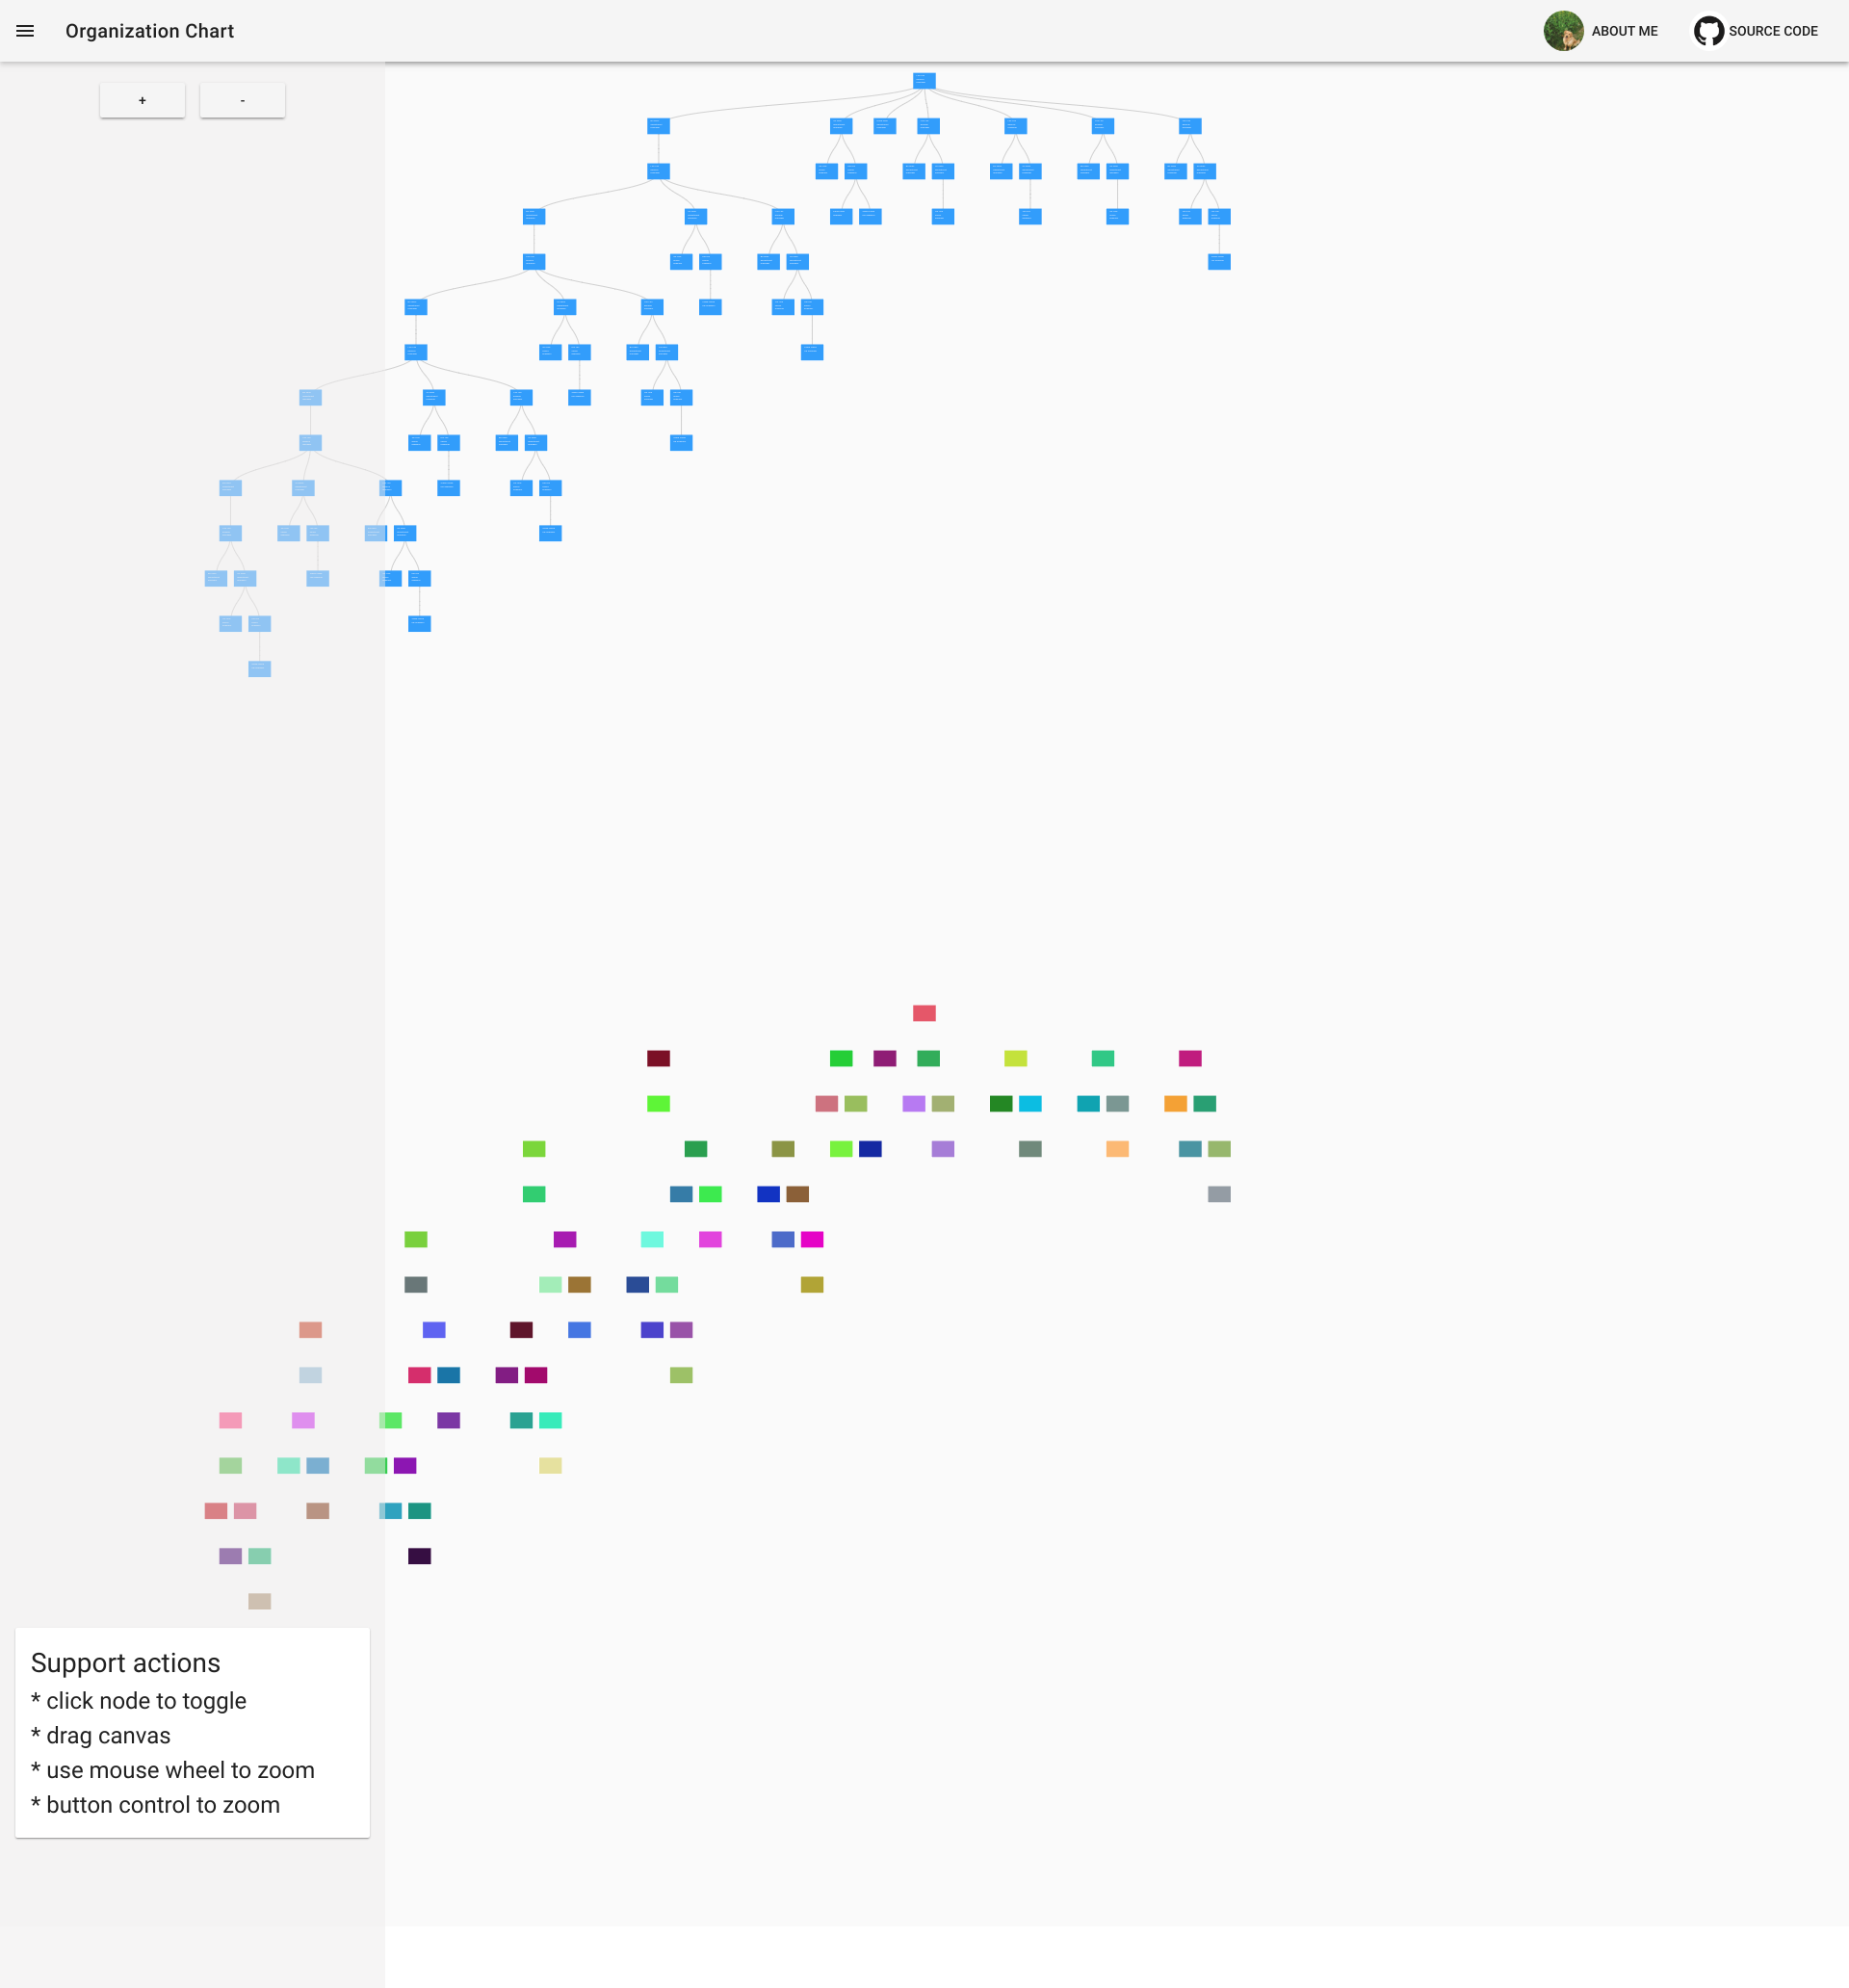
在上面一张Canvas上监听用户点击事件, 通过象素的坐标, 在下面一张图中拿到用户点击的节点 (注意: 颜色和节点的键值对 是在下面一张Canvas绘制的时候就已经创建好的.)
  setClickListener () {
    let self = this
    this.canvasNode.node().addEventListener('click', function (e) {
      let colorStr = Util.getColorStrFromCanvas(self.hiddenContext, e.layerX, e.layerY)
      let node = self.colorNodeMap[colorStr]
      if (node) {
        // let treeNodeData = node.data()[0]
        // self.hideChildren(treeNodeData, true)
        self.toggleTreeNode(node.data()[0])
        self.update(node.data()[0])
      }
    })
  }
下面是创建 unique-color和节点的 键值对 的参考代码:
  addColorKey () {
    // give each node a unique color
    let self = this
    this.virtualContainerNode.selectAll('.orgUnit')
      .each(function () {
        let node = self.d3.select(this)
        let newColor = Util.randomColor()
        while (self.colorNodeMap[newColor]) {
          newColor = Util.randomColor()
        }
        node.attr('colorKey', newColor)
        node.data()[0]['colorKey'] = newColor
        self.colorNodeMap[newColor] = node
      })
  }
其他
To draw your own nested data
please replace the data in /src/base/data-generator with your own nested data.
please add your data drawing logic in /src/components/org-chart.js #drawShowCanvas
Want to develop locally ?
source code
if you like it , welcome to star and fork :tada:
# install dependencies
npm install

# serve with hot reload at localhost
npm run dev

# build for production with minification (build to ./docs folder, which can be auto servered by github page 🤓)
npm run build
想继续了解 D3.js ?
这里是我的 D3.js 、 数据可视化 的github 地址, 欢迎 start & fork :tada:
如果觉得不错的话, 不妨点击下面的链接关注一下 : )
欢迎关注我的公众号: