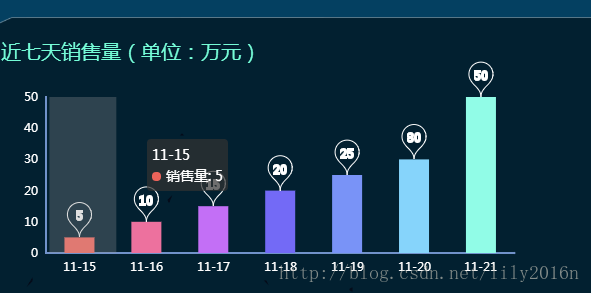
markPoint: 图表标注 ,如下图,详见官方http://echarts.baidu.com/option.html#series-bar.markPoint
<script>
var myChart = echarts.init(document.getElementById('salesVolume'));
option = {
title : {
text: '近七天销售量(单位:万元)',
textStyle:{
color:'#75fcd7',
fontSize: 20,
fontWeight: 'normal',
align: 'left',
fontFamily:"微软雅黑"
}
},
grid:{
// top:40,
x:50,
// y:20,
bottom:20,
borderWidth:80
},//柱状图的大小
tooltip : {
trigger: 'axis',
axisPointer : { // 坐标轴指示器,坐标轴触发有效
type : 'shadow' // 默认为直线,可选为:'line' | 'shadow'
}
},
legend: {
data:['近七天销售量(单位:万元)']
},
xAxis : [
{
axisTick:{
show:false //刻度消失
},
splitLine:{show: false},
type : 'category',
axisLabel: {
show: true,
textStyle: {
color: '#fff'
}
},
axisLine: {
show: true,
lineStyle: {
color:'#7192ca',
width:2
}
},
data : ['11-15','11-16','11-17','11-18','11-19','11-20','11-21']
},
],
yAxis : [
{
axisTick:{
show:false //刻度消失
},
splitLine:{show: false},//去除网格线
type : 'value',
nameTextStyle:{
color:'#fff'
},
axisLabel : {
formatter: '{value}',
textStyle: {
color: '#fff',
// fontSize:16
}
},
axisLine: {
show: true,
lineStyle: {
color:'#7192ca',
width:2
}
},
}
],
series : [
{
name:'销售量',
type:'bar',
barWidth : 30,
itemStyle: {
emphasis: {
barBorderRadius: [10, 10, 10, 10]
},//圆角
normal: {
color: function(params) {
// build a color map as your need.
var colorList = ['#ec635a','#ed719e','#c36ff6','#736af6','#7993f7','#86d4fb','#91fce7'];
return colorList[params.dataIndex] //柱状图的颜色
}
}
},
data:[5, 10, 15, 20, 25, 30, 50],
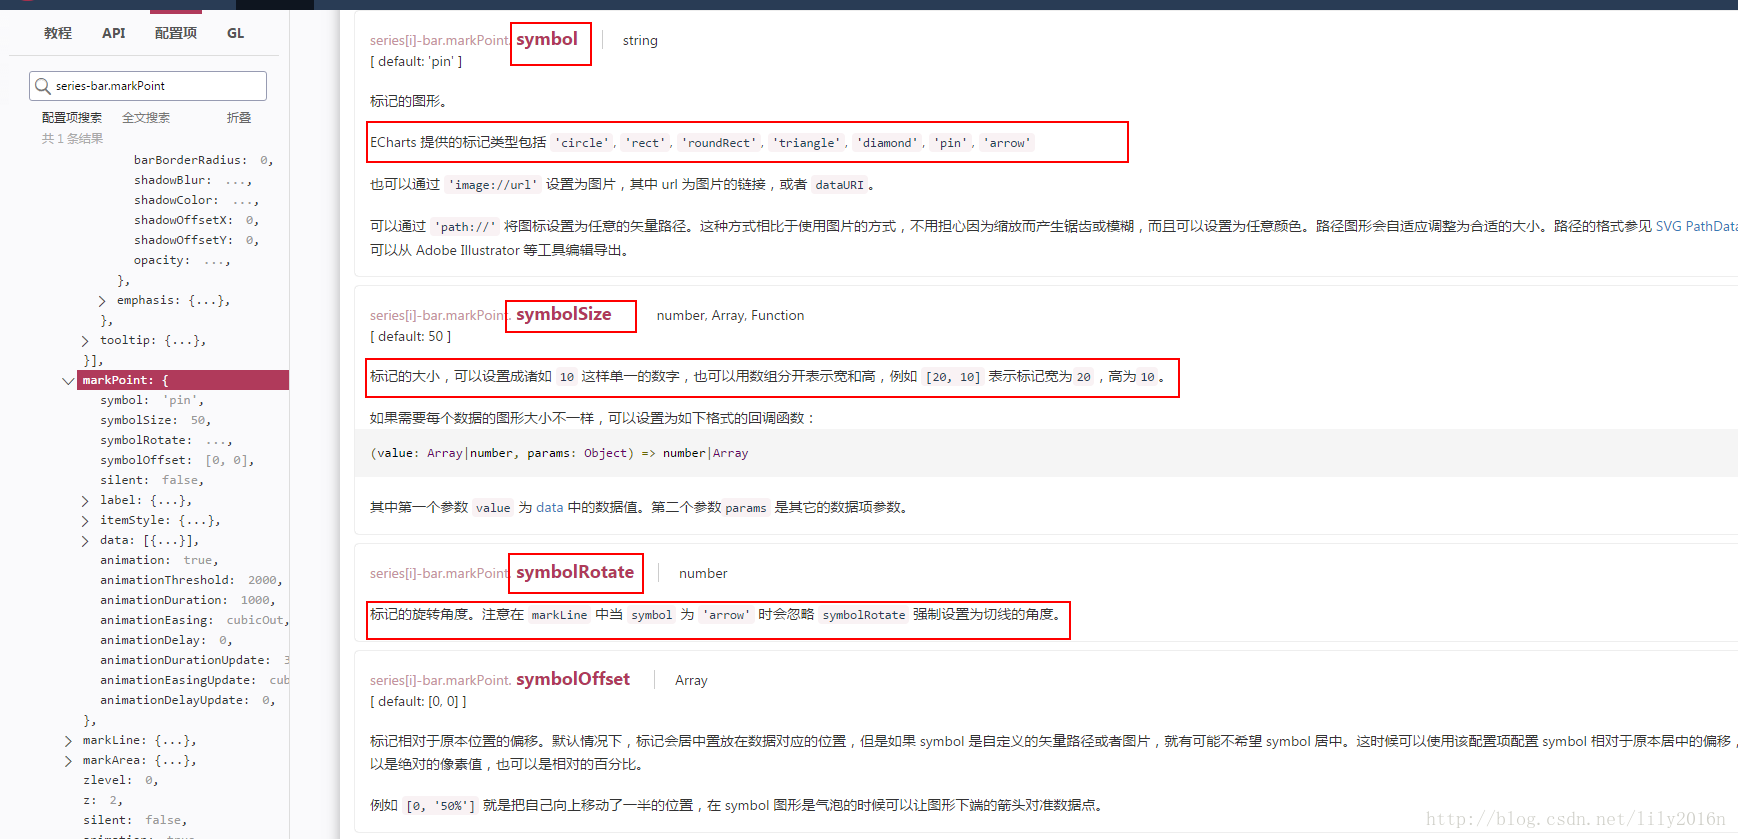
markPoint : {
symbol:'pin',//标记类型
symbolSize: 40,//图形大小
itemStyle: {
normal: {
borderColor: '#fff',
borderWidth: 1, // 标注边线线宽,单位px,默认为1
label: {
show: true
}
}
},
data : [//配置项
{value:'5',xAxis: 0, yAxis: 5},
{value:'10',xAxis:1, yAxis: 10},
{value:'15',xAxis:2, yAxis: 15},
{value:'20',xAxis:3, yAxis: 20},
{value:'25',xAxis:4, yAxis: 25},
{value:'30',xAxis:5, yAxis: 30},
{value:'50',xAxis:6, yAxis: 50},
]
},
},
]
};
myChart.setOption(option);
window.onresize = function(){
myChart.resize();
}//组件随着页面的缩放而缩放
</script>
效果图