

本文已经翻译成中文《【译】在 Chrome 开发者工具中调试 Node.js》,欢迎参加「掘金翻译计划」,翻译优质的技术文章。
This post introduces a novel approach to developing, debugging, and profiling Node.js applications within Chrome DevTools.
devtool
Recently I’ve been working on a command-line tool, devtool, which runs Node.js programs inside Chrome DevTools.
The recording below shows setting breakpoints within an HTTP server.
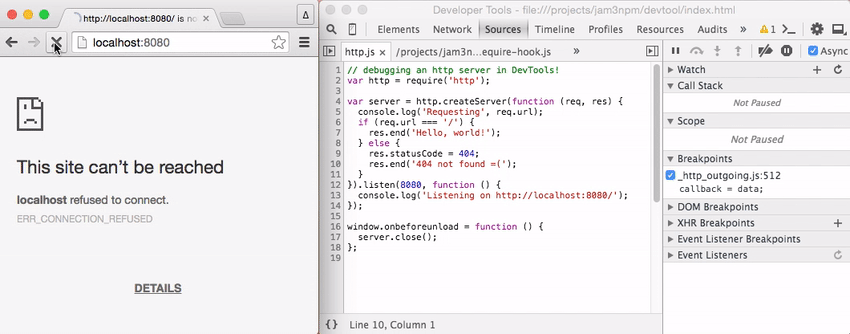
This tool builds on Electron to blend Node.js and Chromium features. It aims to provide a simple interface for debugging, profiling, and developing Node.js applications.
You can install it with npm:
npm install -g devtool
REPL
In some ways, we can use it as a replacement to the node shell command. For example, we can open a REPL like so:
devtool
This will launch a new Chrome DevTools instance with Node.js support:
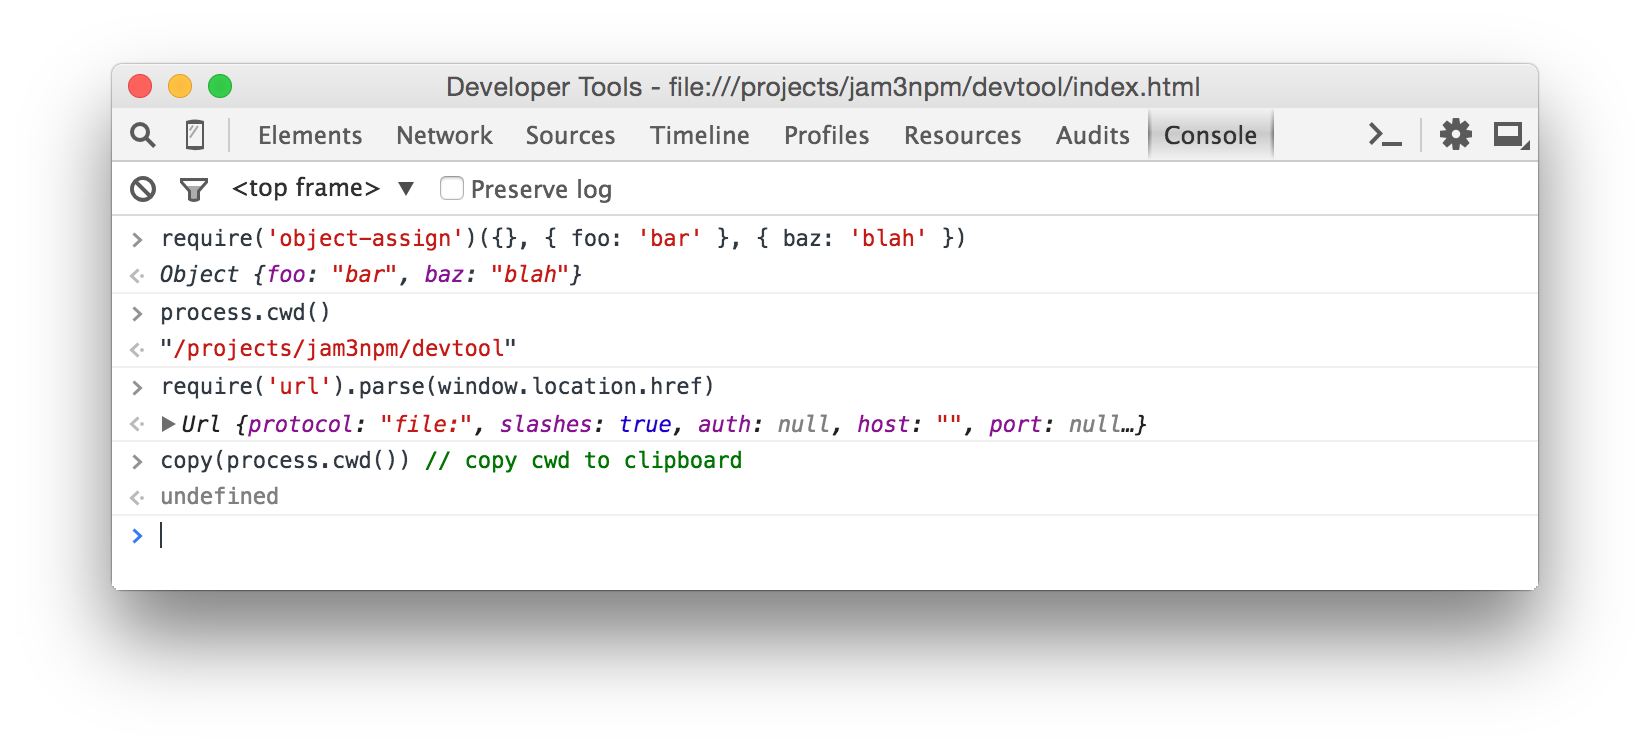
We can require Node modules, local npm modules, and built-ins like process.cwd(). We also have access to Chrome DevTools functions like copy() and table().
Other examples at a glance:
# run a Node script
devtool app.js

# pipe in content to process.stdin
devtool < audio.mp3

# pipe in JavaScript to eval it
browserify index.js | devtool
Development
We can use devtool for general purpose module and application development, instead of existing tools like nodemon.
devtool app.js --watch
This will launch our app.js in a Chrome DevTools console. With --watch, saving the file will reload the console.
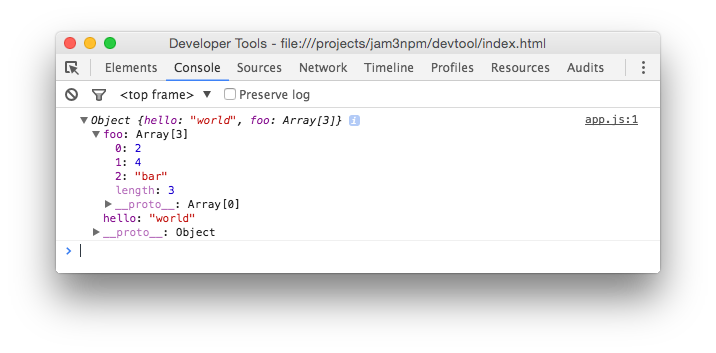
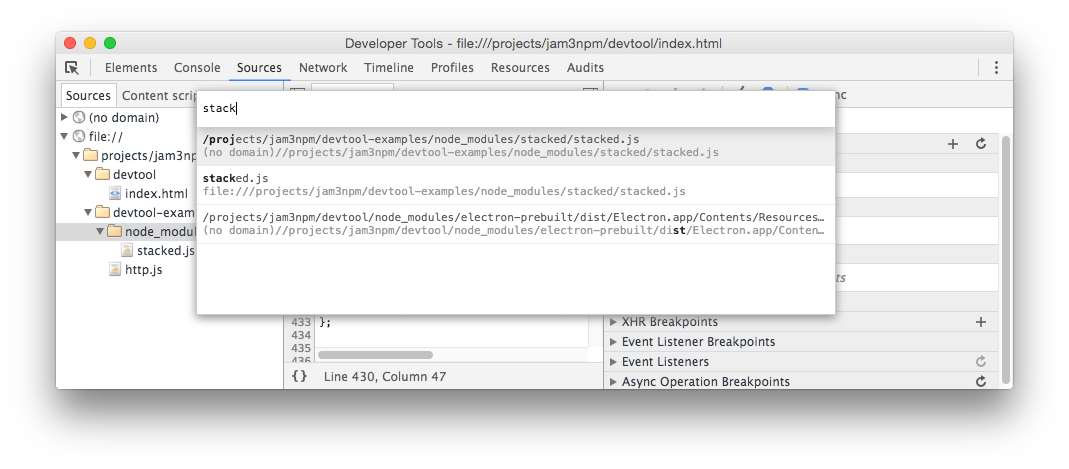
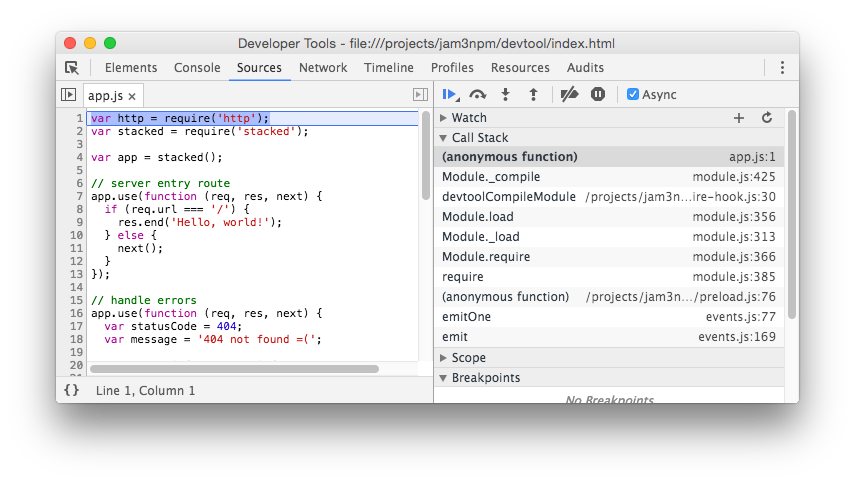
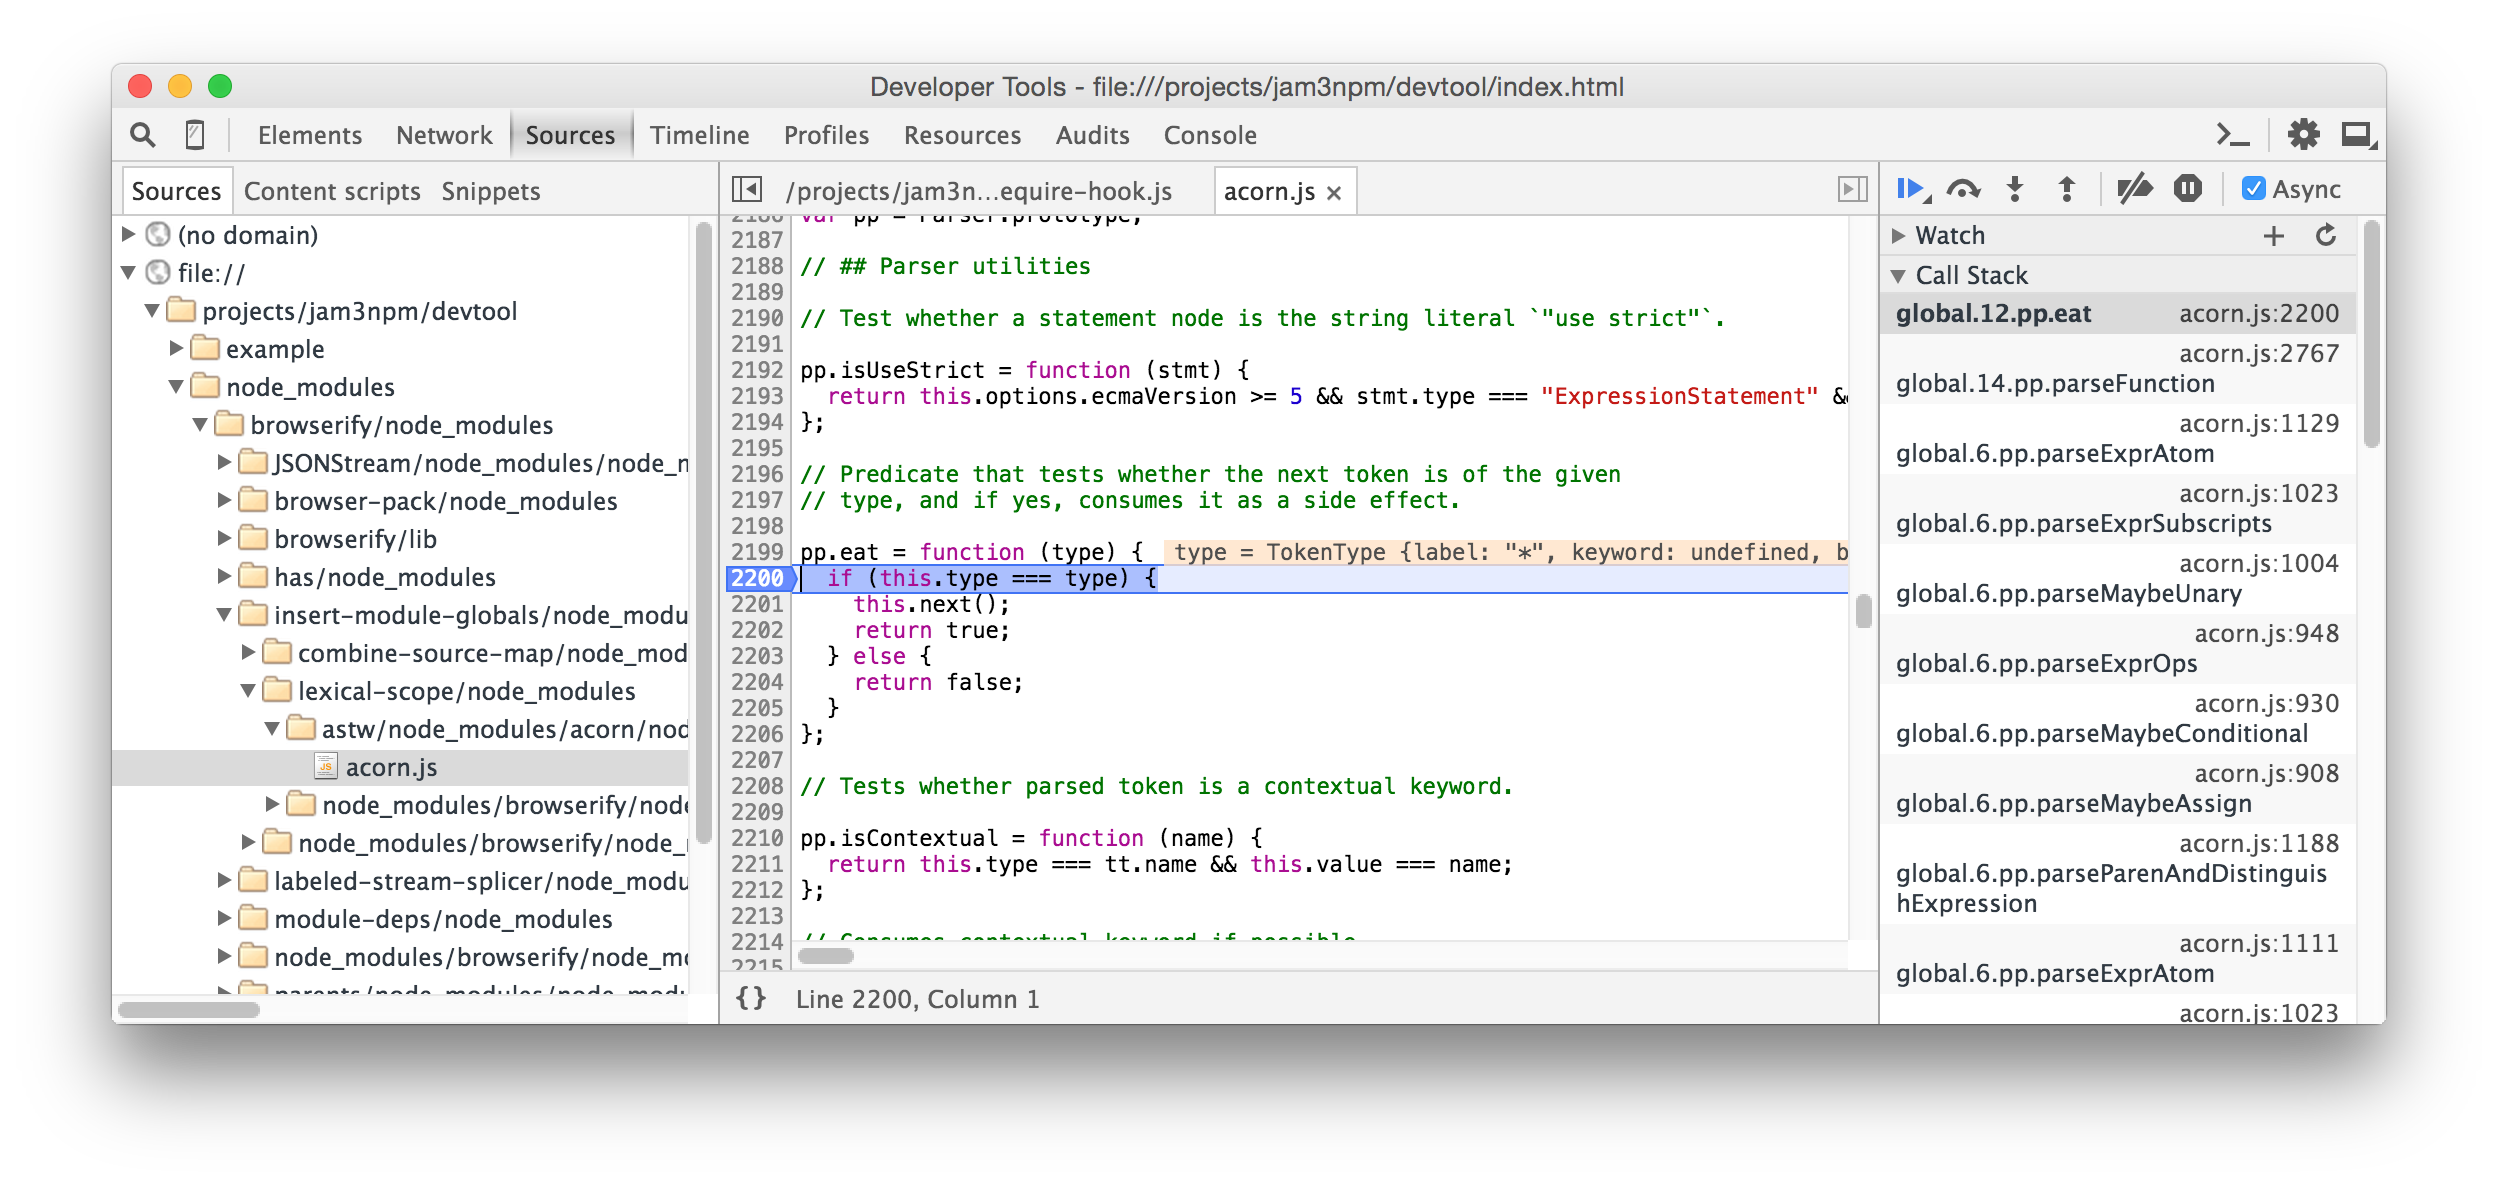
Clicking on the app.js:1 link will take us to the relevant line in the Sources tab:
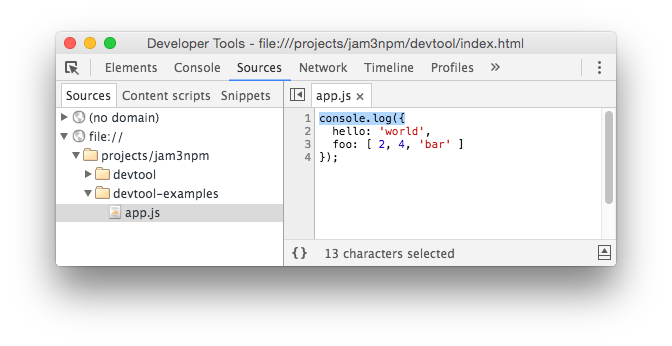
While in the Sources tab, you can also hit Cmd/Ctrl + P to quickly search across required modules. You can even inspect and debug internal modules, such as those of Node.js. You can also use the left-hand panel to browse modules.
Debugging
Since we have access to the Sources tab, we can use it for debugging our applications. You can set break points and then reload the debugger (Cmd/Ctrl + R), or you can set an initial breakpoint with the --break flag.
devtool app.js --break
Below are a few features that may not be immediately obvious to those learning Chrome DevTools:
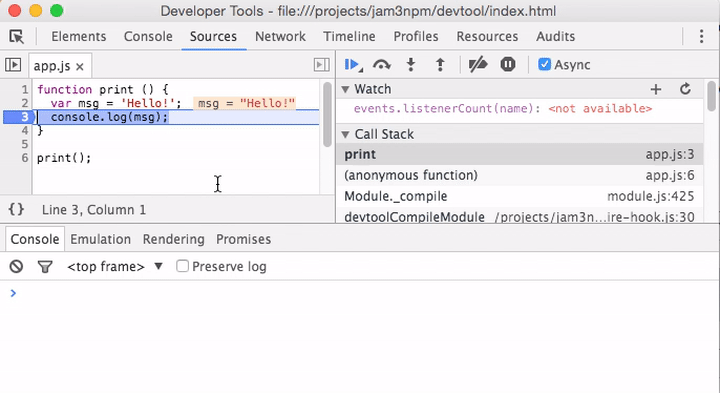
tip – While the debugger is paused, you can hit the
Escapekey to open a console that executes within the current scope. You can change variables and then continue execution.
Profiling
Another use for devtool is profiling applications like browserify, gulp, and babel.
Here we use console.profile(), a feature of Chrome, to profile CPU usage of a browser bundler.
var browserify = require('browserify');

// Start DevTools profiling...
console.profile('build');

// Bundle some browser application
browserify('client.js').bundle(function (err, src) {
  if (err) throw err;

  // Finish DevTools profiling...
  console.profileEnd('build');
});
Now we can run devtool on our file:
devtool app.js
After execution, we can see the results in the Profiles tab.
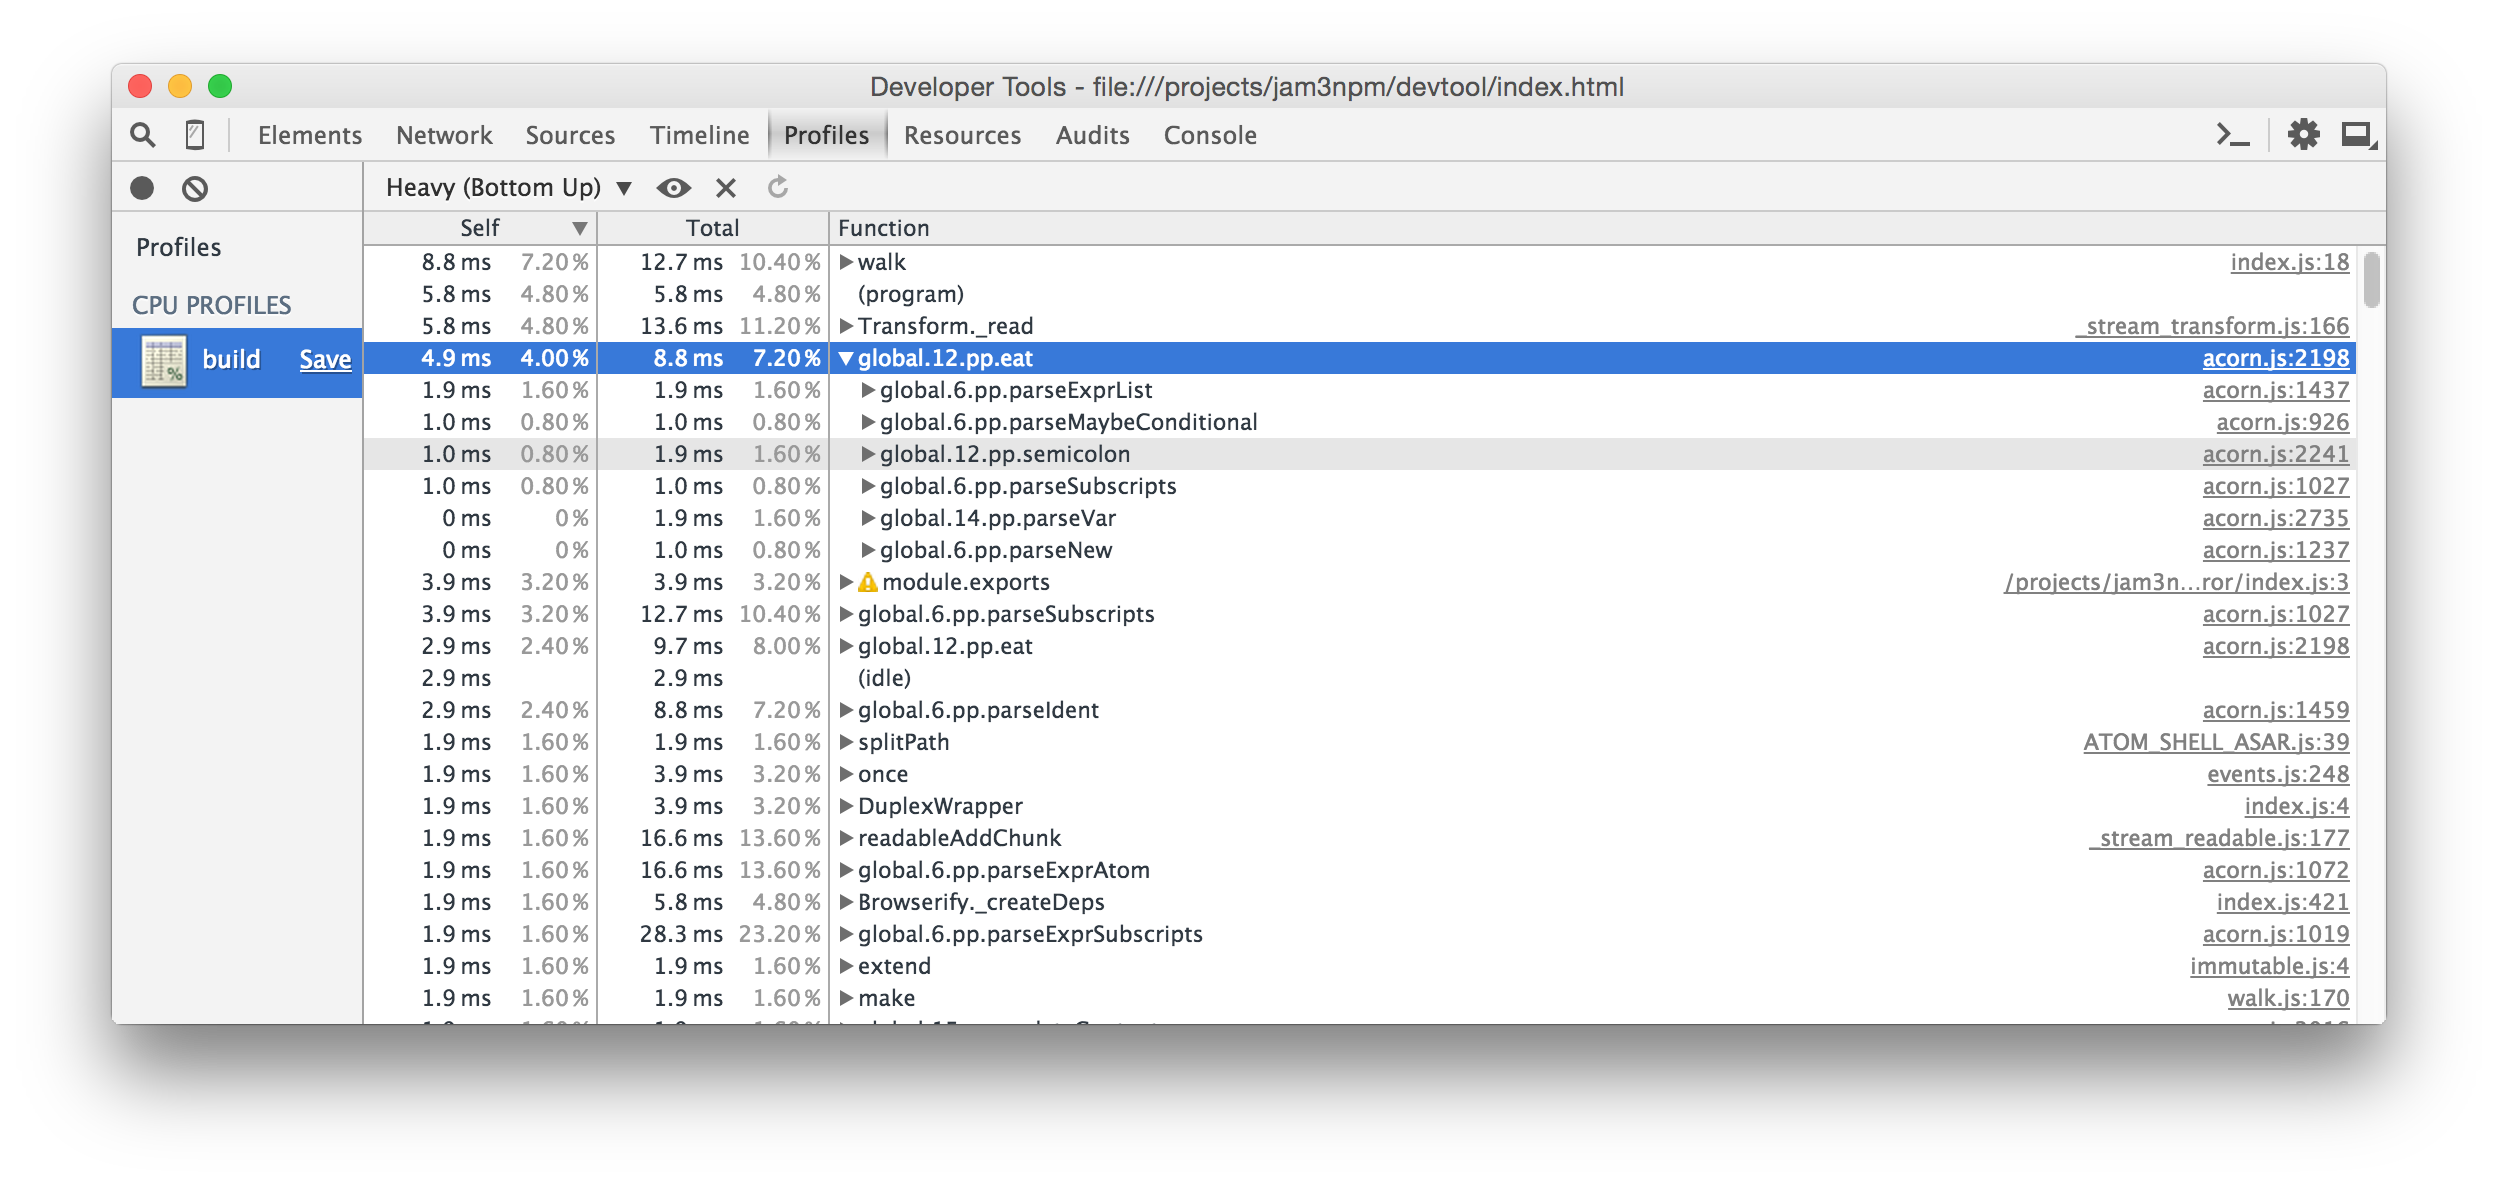
We can use the links on the right side to view and debug the hot code paths:
Advanced Options
Experiments
Chrome is constantly pushing new features and experiments into their DevTools, like the Promise Inspector. You can enable it by clicking the three dots in the top right corner, and selecting Settings -> Experiments.
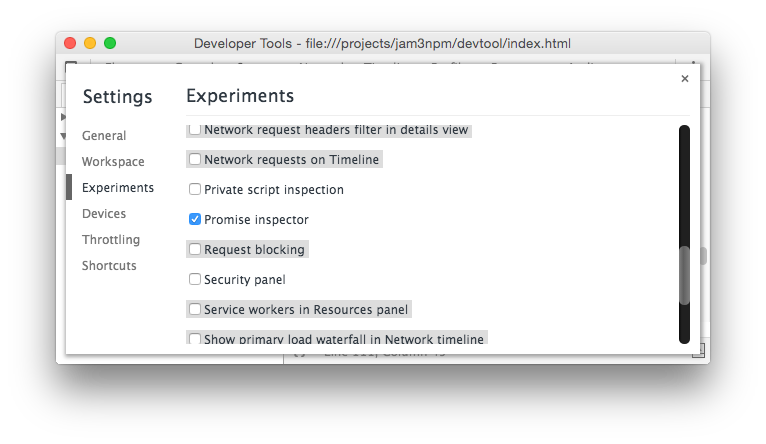
Once enabled, hit the Escape key to bring up a panel with the Promises inspector.

tip – In the Experiments page, if you hit
Shift6 times, you will be exposed to some even more experimental (and unstable) features.
--console
You can redirect console output back to terminal (process.stdout and process.stderr), which allows you to pipe it into other processes such as TAP prettifiers.
devtool test.js --console | tap-spec
-- and process.argv
Your scripts can parse process.argv like in a regular Node.js application. If you pass a full stop (--) to the devtool command, anything after it will be used as the new process.argv. For example:
devtool script.js --console -- input.txt
Now, your script can look like this:
var file = process.argv[2];
console.log('File: %s', file);
Output:
File: input.txt
--quit and --headless
With --quit, the process will quit with exit code 1 when it reaches an error (such as a syntax error or uncaught exception).
With --headless, the DevTools will not be opened.
This can be used for command-line scripts:
devtool render.js --quit --headless > result.png
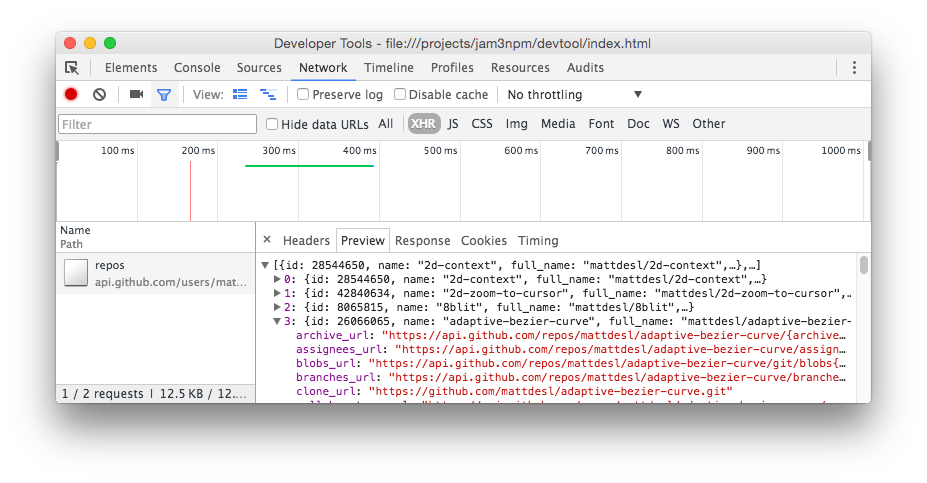
--browser-field
Some modules may provide an entry point that is better to run in a browser. You can use --browser-field to support the package.json flag when requiring modules.
For example, we can use xhr-request which will use XHR when required with the "browser" field.
const request = require('xhr-request');

request('https://api.github.com/users/mattdesl/repos', {
  json: true
}, (err, data) => {
  if (err) throw err;
  console.log(data);
});
And in shell:
npm install xhr-request --save
devtool app.js --browser-field
Now, we can inspect requests Network tab:
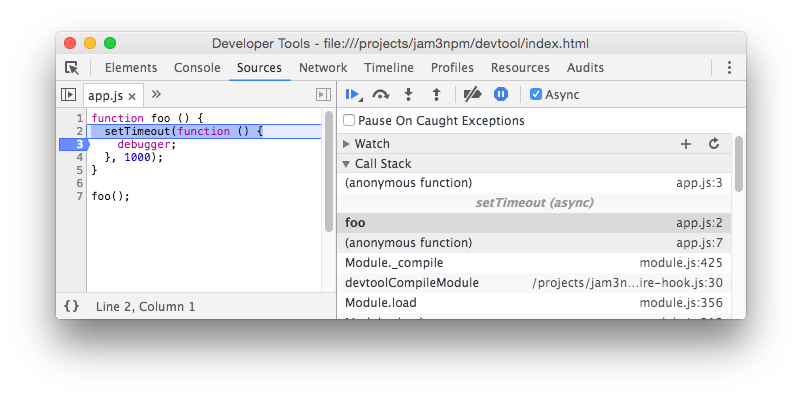
--no-node-timers
By default, we shim the global setTimeout and setInterval so they behave like Node.js (returning an object with unref() and ref() functions).
However, you can disable this to improve support for Async stack traces.
devtool app.js --no-node-timers
V8 Flags
In your current directory, you can add a .devtoolrc file that includes advanced settings, such as V8 flags.
{
  "v8": {
    "flags": [
      "--harmony-destructuring"
    ]
  }
}
See here for more details.
Gotchas
Since this is running in a Browser/Electron environment, and not a true Node.js environment, there are some gotchas to be aware of.
Comparisons
There are already some existing debuggers for Node.js, so you may be wondering where the differences lie.
WebStorm Debugger
The WebStorm editor includes a very powerful Node.js debugger. This is great if you are already using WebStorm as your code editor.

However, it lacks some features and polish of Chrome DevTools, such as:
- A rich and interactive console
- Pause on Exception
- Async Stack Traces
- Promise Inspection
- Profiles
But since it integrates with your WebStorm workspace, you can make modifications and edit your files while debugging. It also runs in a true Node/V8 environment, unlike devtool, so it is more robust for a wide range of Node.js applications.
iron-node

A similar Electron-based debugger is iron-node. iron-node includes a built-in command to recompile native addons and a complex graphical interface that shows your package.json and README.md.
Whereas devtool is more focused on the command-line, Unix-style piping/redirection, and Electron/Browser APIs for interesting use-cases.
devtool shims various features to behave more like Node.js (like require.main, setTimeout and process.exit) and overrides the internal require mechanism for source maps, improved error handling, breakpoint injection, and "browser" field resolution.
node-inspector

You may also like node-inspector, which uses remote debugging instead of building on top of Electron.
This means your code will run in a true Node environment, without any window or other Browser/Electron APIs that may pollute scope and cause problems with certain modules. It has stronger support for large Node.js applications (i.e. native addons) and more control over the DevTools instance (i.e. can inject breakpoints and support Network requests).
However, since it re-implements much of the debugging experience, it may feel slow, clunky and fragile compared to developing inside the latest Chrome DevTools. It has a tendency to crash often and often leads to frustration among Node.js developers.
Whereas devtool aims to make the experience feel more familiar to those coming from Chrome DevTools, and also promotes other features like Browser/Electron APIs.
